
The Elliott wave count as updated in yesterday’s analysis is unfolding mostly as expected.
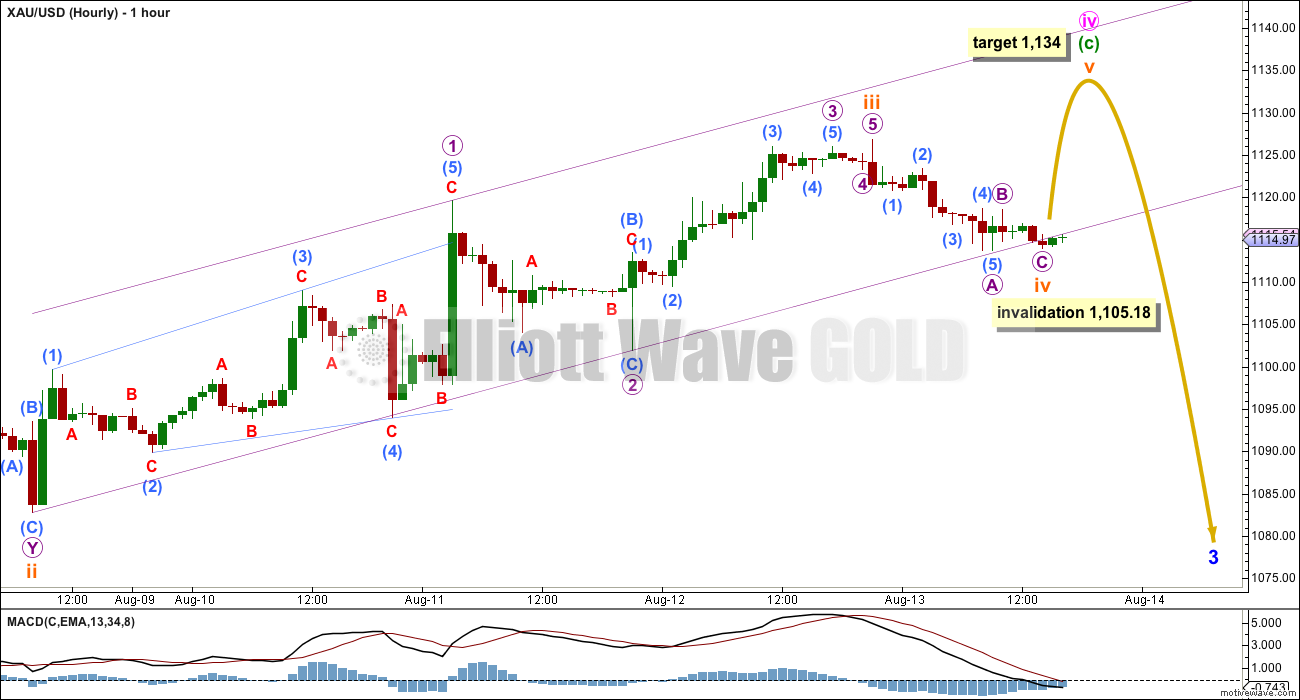
Summary: The structure for minute wave iv is still incomplete. Minute wave iv still needs one final fifth wave up to end it, and a target is now calculated at 1,134 which sees price reach up into the zone of resistance between 1,131 and 1,142. If subminuette wave iv continues sideways or lower, then this target must be recalculated; the invalidation point remains at 1,105.18. If minute wave iv continues for three more days, then it may total a Fibonacci 21 days (to give or take one either side of this number would be an acceptable Fibonacci relationship). The bigger trend remains down; this current movement is still a correction against the trend. Only a break below 1,105.18 plus a red daily candlestick on higher volume would tell us a downwards breakout is underway.
To see weekly charts and analysis click here.
Changes to last analysis are bold.
ELLIOTT WAVE COUNT
Click chart to enlarge.
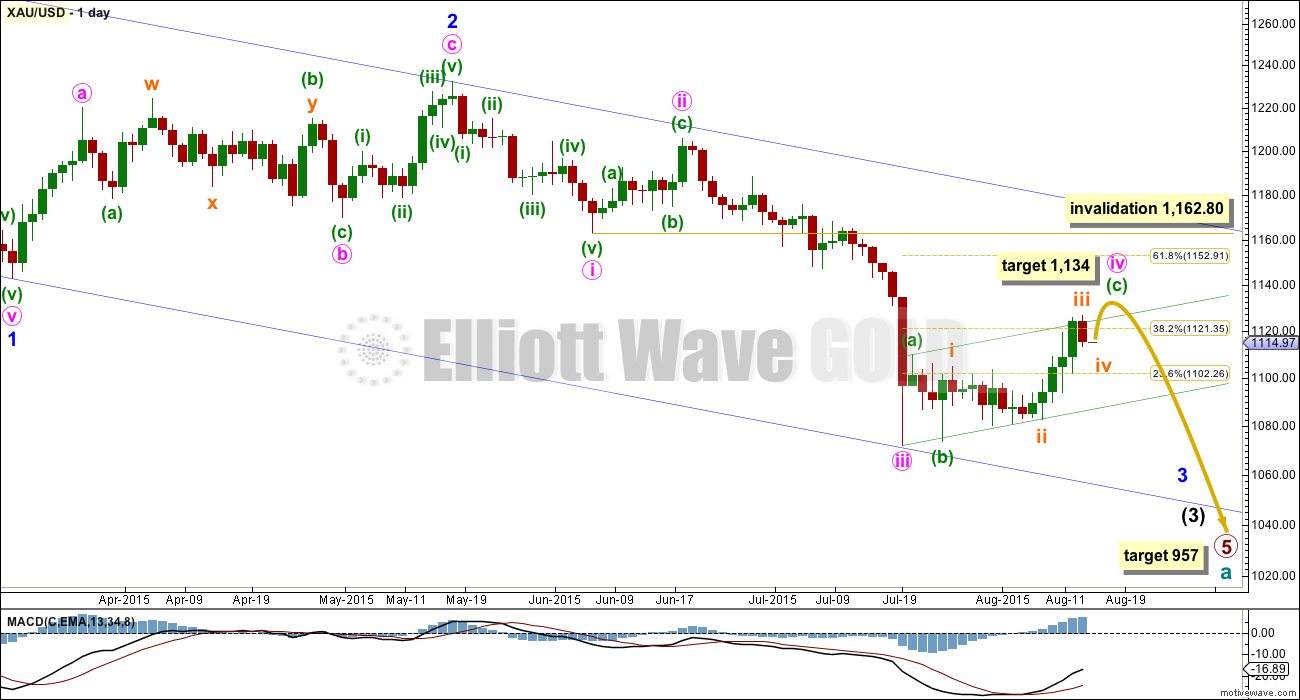
Cycle wave a is an incomplete impulse.
Within primary wave 5, the daily chart focuses on the middle of intermediate wave (3). Within intermediate wave (3), minor wave 3 now shows a slight increase in momentum beyond that seen for the end of minor wave 1 at the left of the chart. Third waves for Gold usually have clearly stronger momentum than its first waves, so I still expect to see a further increase in downwards momentum. The strongest downwards movement is still ahead of us, and now it may be expected to show up within the next fifth wave down of minute wave v to end minor wave 3. Gold often exhibits very strong fifth waves, and when it does this they usually turn up to end its third wave impulses.
It is possible (just, with an unusual looking expanded flat within it for a second wave) to see minute wave iii as over. The duration of this current correction indicates that despite the problem within its subdivisions minute wave iii must have been over and this current correction is minute wave iv.
Minute wave ii was a deep 0.618 single zigzag lasting nine days. Minute wave iv is a more shallow flat correction, which is still incomplete.
Minute wave iv may not move into minute wave i price territory above 1,162.80.
The blue channel is a base channel drawn about minor waves 1 and 2: draw the first trend line from the start of minor wave 1 (off to the left of the chart at the high of 1,308) to the end of minor wave 2, then place a parallel copy on the end of minor wave 1. The lower trend line perfectly shows where minute wave iii found support. Minor wave 3 should have the power to break through support at the lower trend line; when its fifth wave arrives, then it should be strong enough to do that.
There is no Fibonacci ratio between minute waves i and iii, which makes it very likely that minute wave v will exhibit a Fibonacci ratio to either of minute waves i or iii. When minute wave iv is confirmed as complete, then a target for minute wave v down may be calculated. It is likely to be extended and very strong.
Along the way down to the final target for primary wave 5 at 954, there will be two more big fourth wave corrections: one for minor wave 4 and another for intermediate wave (4). They may be expected to be less time consuming than their counterpart second wave corrections; they may also be expected to be shallow, but they will both still likely be multi week corrections (at least two weeks in the case of minor wave 4 and longer for intermediate wave (4) ).
At 957 primary wave 5 would reach equality in length with primary wave 1.
Click chart to enlarge.
Within the flat correction of minute wave iv, minuette waves (a) and (b) both subdivide as three wave structures, and minuette wave (b) is a 97% correction of minuette wave (a) meeting the minimum requirement of 90% for a B wave within a flat. Minuette wave (c) may only be a five wave structure, and at this stage, it looks like an incomplete impulse.
Within the impulse, subminuette wave iv may not move into subminuette wave i price territory below 1,105.18.
Subminuette wave ii was a time consuming double combination. Subminuette wave iv may exhibit alternation as a quicker zigzag or zigzag multiple, or less likely a flat or triangle. It is possible that it is over already lasting just one day and subdividing as a zigzag, but it is also possible it may continue for another day or so to take more time and be better in proportion to subminuette wave ii. So far it shows up on the daily chart as one red candlestick. If it continues further, then it may not move into subminuette wave i price territory below 1,105.18.
If subminuette wave iv is already over, then at 1,134 subminuette wave v would reach 0.618 the length of subminuette wave i. If it moves lower, then this target must be recalculated.
If the lower invalidation point is breached (before new highs), then my analysis is likely to be wrong at the hourly chart level; it is possible that minute wave iv would be over. Only a red candlestick on the daily chart with an increase in volume would confirm a downwards breakout.
TECHNICAL ANALYSIS
Click chart to enlarge.
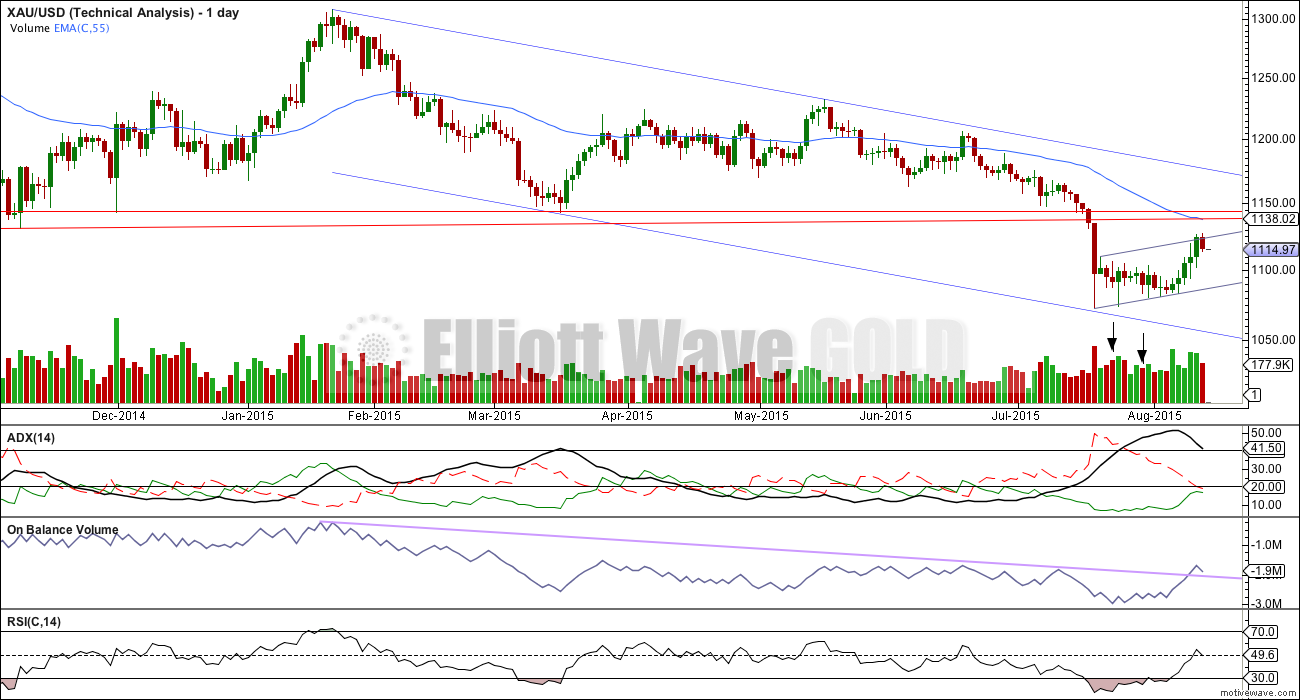
ADX is below 45 and clearly declining. A correction is likely. This is what has been unfolding now for over two weeks; ADX does tend to be a lagging indicator. However, at this stage, what ADX clearly shows today is that this upwards movement is not a new trend.
On Balance Volume has breached its long held lilac trend line, a very bullish indicator which is at odds with ADX. This now gives a mixed message about where price may be expected to go next.
I have added two horizontal trend lines of resistance, which were previously support. The first is at 1,131 from that low on 7th November 2014. The second is at 1,142 from the lows at 1st December 2014 and 17th March 2015. If price breaks above 1,131, then the next line at 1,142 may show where upwards movement ends. 1,142 was tested four times, so it is highly technically significant.
RSI has returned well into normal range. There is plenty of room for the market to rise or fall.
The EMA is changed to a Fibonacci 55 days. This may also provide some resistance.
Volume for the two days (indicated with black arrows) has been changed retrospectively. Previously these two downwards days showed higher volume than upwards days, which indicated a downwards breakout as more likely than upwards. This is no longer the case; this changed volume profile can be seen on separate data feeds, so should now be correct.
Overall, within this correction, it is upwards days now which have stronger volume, which would indicate an upwards breakout is more likely than downwards. However, this disagrees with ADX, which indicates the market is consolidating and not in a new upwards trend. While these two indicators give opposite messages, the picture is unclear; caution is advised.
The strongest piece of technical analysis on this chart is the horizontal lines of resistance, particularly 1,142. At this stage, it should be expected that price will respect that trend line.
Note: I am still searching for a reliable new data feed for Gold spot prices. I will use volume data from IG brokers to supplement this data from FXCM. Today both data feeds show volume for Thursday’s downwards day was lower than the prior upwards days.
This analysis is published about 06:34 p.m. EST.
Downside projected we go Up.
Upside projected we go down.
Incredible.
Gold has not invalidated yet below 1105.
“Subminuette wave iv may exhibit alternation as a quicker zigzag or zigzag multiple, or less likely a flat or triangle. It is possible that it is over already lasting just one day and subdividing as a zigzag, but it is also possible it may continue for another day or so to take more time and be better in proportion to subminuette wave ii”
Aidan please read the comments guidelines.
All comments must meet the guidelines.
All members are expected at all times to use this comments feature in a positive and collegial manner. This is what has allowed a small community of very experienced professionals to gather here to share their work and ideas. Criticism is welcomed but only if it is constructive, this means members are safe to present their ideas without fear of ridicule or nasty responses.
Your comment could be classified as snark. It offers no useful discussion of the market, no additional technical analysis, and is neither polite nor collegial.
General astoundment of the recent activity in gold.
While snark is not a word I am familiar with it was not my intention.
noun
Combination of “snide” and “remark”. Sarcastic comment(s).
Also snarky (adj.) and snarkily (adv.)
His commentary was rife with snark.
“Your boundless ineptitude is astounding,” she snarkily declared.
Not nice. Your comment does not belong here.
Hi Lara;
Since I subscribed as the member to your website, I had not regretted once. I had learned how to study EW, What to expect and what we should not be expected especially during correction period. I too learned from many good traders who are not shy away from sharing their professional thought with us every critical moments. I hereby thanks all of you and I had really learned a lot from you all. The best part is , we could be making money while learning from you. Have a good weekend Lara.
You’re welcome Rachel, and thank you.
I’ll close this part of the thread now, in that any further comments will be deleted.
Aidan was given a warning to which he chose to not take and has now been removed from the membership due to ignoring the guidelines both here and in personal correspondence with myself.
The comments guidelines will be strictly enforced.
I have deleted Joseph’s comment made here, as it did not meet the guidelines.
Thank you to all members for keeping this space polite, collegial and supportive. That’s how we’re going to maintain an environment where everyone feels comfortable sharing ideas, no matter how different they may be.
Hi Lara…
Shahab raises a very interesting point for traders…..
Are there EW rules to distinguish between
1………..nested 1-2 …1-2 patterns versus
2 ……….1-2 plus 3-4 of an opening diagonal and
…..would there be rules for trading the two differently?
Or the same rule for both?
For example…would a stop loss go at the bottom of the second W2 or the bottom of W4 regardless of how you labelled them?
Yes, that is a good point.
For a leading diagonal the first and third waves may subdivide as impulses and so yes, it could actually look exactly the same as 1-2, 1-2.
To accommodate both ideas the stop would be placed at the end of the first second wave correction. This would allow the fourth wave of the diagonal to overlap first wave price territory and move towards but not beyond the end of the second wave.
The reality though is that leading diagonals more commonly have the first, third and fifth waves subdivide as zigzags. If one of them is going to be an impulse it’s usually the third wave, typical third wave tendencies make that so I think.
So a diagonal would normally be indicated by the first wave subdividing as a zigzag.
If the actionary waves of a potential leading diagonal are all impulses (unusual, but possible) then look at the trend lines. If they fit then it should be an alternate wave count (or main if it’s really obvious). A deep second wave would be expected.
And at the same time the very same movement may also be 1-2, 1-2, 1-2.
And the price point which differentiates the two ideas would be the end of the last correction, the last second wave which would also be the end of the fourth wave within the potential diagonal.
The diagonal once complete would expect a deep second wave correction to move beyond that point, the other idea of a nested 1-2, 1-2, 1-2 would not. So at that stage a trading decision would have to be made on which idea was correct and how long one would want the pain of holding a position before profits are seen, and how much one would stand to lose if the whole thing was wrong. The invalidation point for the diagonal would be right back at the start of it.
Sorry for the long response. It’s a complicated idea!
Thanks Lara…excellent analysis…you have made it simpler for us..
So the structure of the W1’s (impulses vs zigzags) is a good first TELL….
Could W1 of a Leading Diagonal also be a Leading Diagonal?
No, it may only be a zigzag (most commonly) or an impulse (less common).
Thanks Lara. Is there a way to get these posts sent to my email when they are posted as opposed to checking in on the website?
I’m sorry Ted, no. We’ve looked into that and yes it would be a great feature, but the WP plug ins we’re using to make this comment section work does not do that.
I see a series of 1-2’s for dust , 3 of them.
meaning? what are your thoughts?
Usually it means a big strong move ahead in the same direction as a third wave takes off.
Looking for entry in oil. Once Lara updates wave count I will be looking at magical 9ema for the entry.
It does look like USOil is finding resistance at the 9EMA.
It may continue to do so.
The last move down at primary degree didn’t have big corrections out of it. It just kept falling for months.
Lara,
Take a look at the retracements for this oil count… several supporting signs.
Problem is.. oil does not fluctuate much between primary degrees.
exp.
Primary one: straight down.
Primary 3; straight down.
Primary 5; straight down also?? or….
Yes, very nice ratios indeed! Which is a big improvement on what I have.
The volume for the 13th was very light too. And with a hammer that is pretty bullish.
A trend channel breach would provide good confirmation at this stage I expect.
Within primary wave 3 intermediate (1) lasted only 4 days and was very deep (but I have intermediate (1) very short so it only moved 2.35 higher) and intermediate (4) was 6 days.
That is nice. If oil gets up tp 54 will create HnS. That will be the place to have entry. But oil is not known to do that like John wrote below/above.
I am waiting for oil to get above daily 9emq and trade below. That may be a real entry point.
I was concerned with that leading diagonal for minor wave 1. So I’ve looked at it on the hourly chart.
It will work and it doesn’t have to violate a rule, but only if there are two truncations, one huge, within the *edit: fourth wave of that diagonal.
I don’t think that move was a leading diagonal.
That’s a shame really, because that count has such nice Fibonacci ratios. But I don’t think I’ll change my count to that for that reason.
Lara:Good report once again. I think gold may go down one more day. It seems to day was short term turn.
And you were right. It’s looking better in proportion now.
Hi Lara,
You mentioned IG in the context of volume data. They don’t provide volume data for commodities here in Aus and even if they do elsewhere I wouldn’t use it as a reference point.
An alternative could be stockcharts.com. The daily data are free and they seem to be the first choice for many analysts posting charts. Their whole business is providing on-line charting rather than trading services and have been around for a long time.
I have pasted a 3-month daily example for you below. You can play around with the settings to suit. You will see that the volume data paints a very different picture for the last 2 weeks although it is not in conflict with your overall bearish view.
Also, interestingly, and in common with many other sources, Jul 24th shows a new low below the ‘crash’ low. Not sure if that would have a bearing on your analysis though.
http://stockcharts.com/h-sc/ui?s=%24GOLD&p=D&yr=0&mn=3&dy=0&id=p22103132510
Thanks, yes, I do think you’re right, StockCharts.com may be better.
The new low would make a difference if that last wave down subdivided as a five with that data, but I can’t see hourly so I don’t know.
It would still see the current upwards movement as a correction against the trend anyway.
So long as I use the same data every day for the wave count it doesn’t matter too much, different data feeds can be slightly different.
It too has highest volume within this current correction for upwards days.
Stockcharts get data feed from interactive data.
http://www.interactivedata.com/
I’ve been watching the week of Nov. 17th, we seem to be playing out pretty close to that move.
Yes, the two patterns are similar. If gold repeats the Nov pattern, it could break above former support/ now resistance and end in the 1150s. The fall thereafter looks quite appealing. Good observation.
This looks like possibly and abc off of this mornings high for a correction, just finishing c. Gdxj with a correction back as well.
I like your perspective that this continues into mid next week. This is when I’ll be looking to move back into shorts unless gold drops sooner.
Right, gold dropped below the recent low to create a simple 3 wave correction. That 3rd wave should still creep a little lower, maybe to 1107-09. Thereafter, gold should climb again for a few days. At least that is what I am expecting.
That’s what I see as well.