
Downwards movement was expected.
Price moved sideways to complete a very small red doji.
Summary: For the short term, both wave counts still expect downwards movement. The bull count expects a zigzag down to end most likely within a range of 1,105 – 1,091. The bear count expects a strong third wave down should be underway. A new low below 1,072.09 would finally and fully eliminate the bull count and provide confidence in the target at 957.
Changes to last analysis are bold.
To see weekly charts and the three different options for cycle wave b (main wave count) click here.
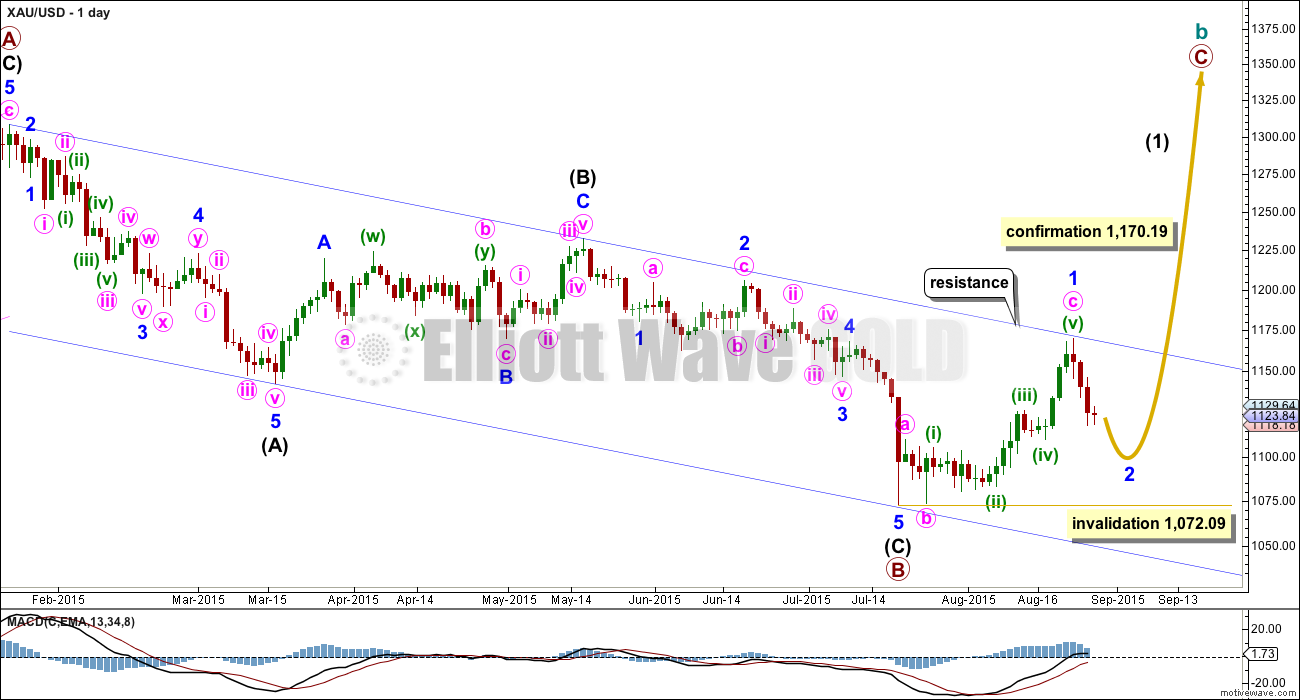
BULL WAVE COUNT – DAILY
Click chart to enlarge.
The bigger picture at super cycle degree is still bearish. A large zigzag is unfolding downwards. Along the way down, within the zigzag, cycle wave b must unfold as a corrective structure.
At this stage, there are three possible structures for cycle wave b: an expanded flat, a running triangle, or a combination.
This daily chart works for all three ideas at the weekly chart level.
For all three ideas, a five up should unfold at the daily chart level. This is so far incomplete. With the first wave up being a complete zigzag the only structure left now for intermediate wave (1) would be a leading diagonal. While leading diagonals are not rare they are not very common either. This reduces the probability of this bull wave count now to about even with the bear wave count.
A leading diagonal requires the second and fourth waves to subdivide as zigzags. The first, third and fifth waves are most commonly zigzags, the but sometimes may appear to be impulses. So far minor wave 1 fits well as a zigzag.
The common depth of second and fourth waves within diagonals is between 0.66 to 0.81 the prior wave. This gives a target range for minor wave 2 from 1,105 to 1,091.
Minor wave 2 may not move beyond the start of minor wave 1 below 1,072.09. If this invalidation point is breached, then it would be very difficult to see how primary wave B could continue yet lower. It would still be technically possible that primary wave B could be continuing as a double zigzag, but it is already 1.88 times the length of primary wave A (longer than the maximum common length of 1.38 times), so if it were to continue to be even deeper, then that idea has a very low probability. If 1,072.09 is breached, then I may cease to publish any bullish wave count because it would be fairly clear that Gold would be in a bear market for cycle wave a to complete.
To the upside, a new high above 1,170.19 would invalidate the bear wave count below and provide strong confirmation for this bull wave count.
Upwards movement is finding resistance at the upper edge of the blue channel and may continue to do so. Use that trend line for resistance, and if it is breached, then expect a throwback to find support there.
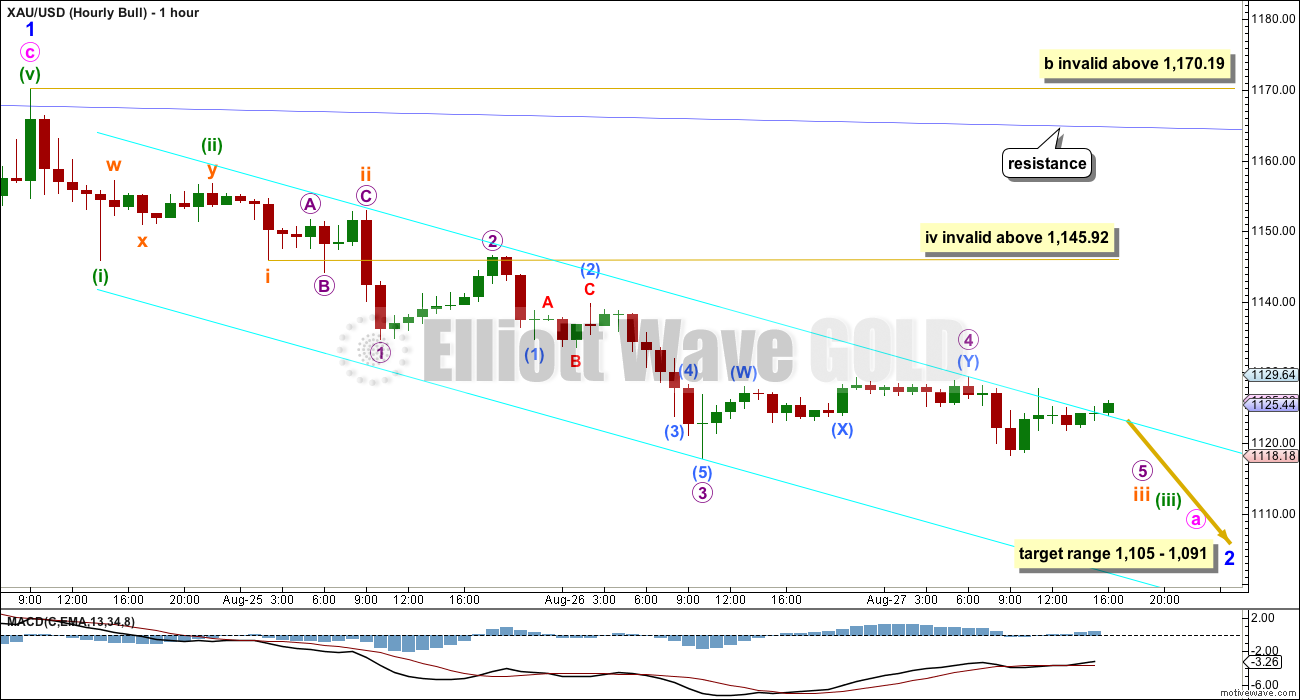
Click chart to enlarge.
Minor wave 2 should unfold as a zigzag. Zigzags subdivide 5-3-5. So far the first 5 down is incomplete.
Within minute wave a, the middle of its third wave looks to have passed. After a careful analysis of the five minute chart, I expect submicro wave (5) was over already and very quick. Micro wave 4 is probably over too as a double zigzag. Micro wave 5 is incomplete and should make a new low below the end of micro wave 3 at 1,117.84 to avoid a truncation.
I have considered the possibility that this downwards movement could be a complete corrective structure, but it will not subdivide as a complete single, double or even very rare triple zigzag. This downwards movement is obviously not a triangle, combination or flat correction, and will also not subdivide as a complete impulse or diagonal. I have concluded today that this downwards movement is very likely to be incomplete no matter what the structure is.
Price is no longer fitting nicely within the parallel channel. Sometimes fourth waves do not sit within channels. The channel may not be useful for this movement.
There is an outside possibility that micro wave 5 is over, if it was slightly truncated (highly unlikely, but possible). Subminuette wave iv, when it arrives (and this outside possibility sees it here already), may not move into subminuette wave i price territory above 1,145.92.
At this stage, there is no divergence showing between price and MACD. There is at least some divergence normally at the end of a movement at the hourly chart level. This supports a wave count which expects more downwards movement.
Minute wave b upwards should show up on the daily chart, so it should produce at least one green candlestick and probably more. It may not move beyond the start of minute wave a above 1,170.19.
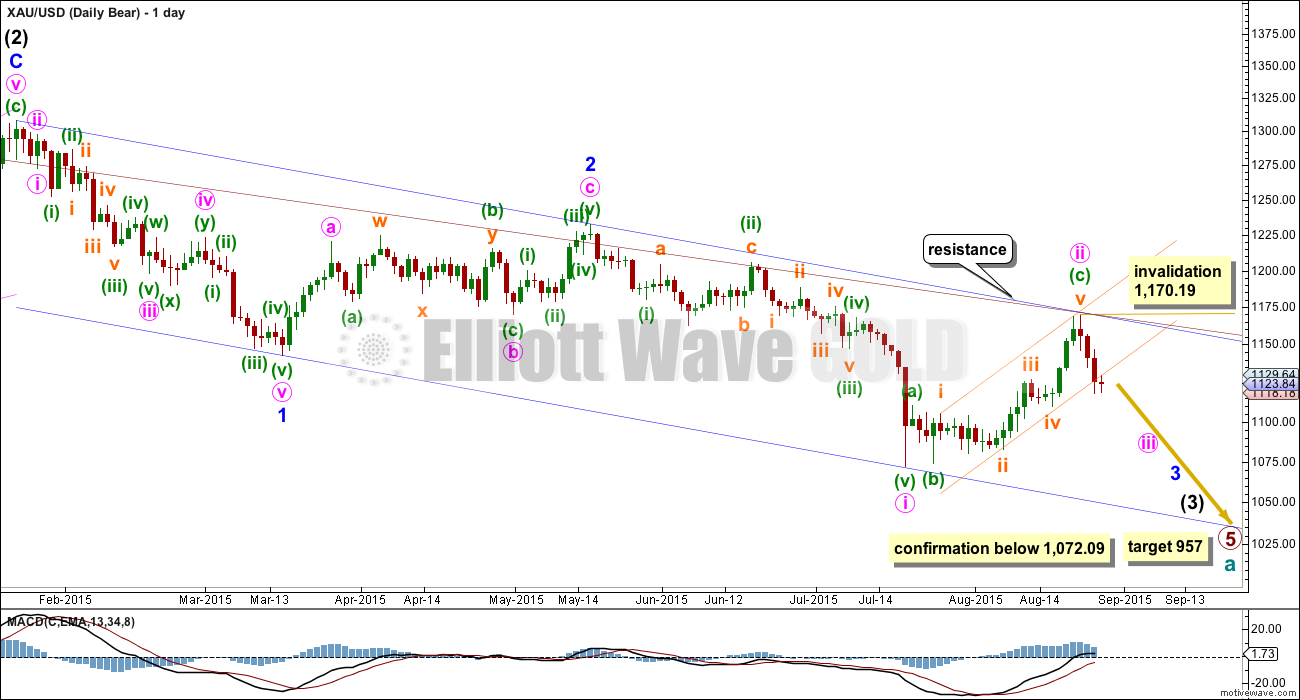
BEAR ELLIOTT WAVE COUNT
Click chart to enlarge.
At this stage, the reduction of probability for the bull wave count sees this bear wave count about even now in probability.
This wave count now sees a series of three overlapping first and second waves: intermediate waves (1) and (2), minor waves 1 and 2, and now minute waves i and ii. Minute wave iii should show a strong increase in downwards momentum beyond that seen for minute wave i. Before that comes though, we may yet have another second wave correction and if it unfolds before price makes a new low below 1,072.09, then we may not have clarity between these two wave counts for some time yet.
The blue channel is drawn in the same way on both wave counts. The upper edge will be critical. Both wave counts expect some downwards movement from here to bounce down from resistance about the upper blue trend line. Here the blue channel is a base channel drawn about minor waves 1 and 2. A lower degree second wave correction for minute wave ii should not breach a base channel drawn about a first and second wave one or more degrees higher. If this blue line is breached by one full daily candlestick above it and not touching it, then this wave count will substantially reduce in probability.
With the base channel providing strong resistance and price now moving strongly lower, I will move the invalidation point down. Within minute wave iii, no second wave correction may move beyond the start of its first wave above 1,170.19. A breach of that price point should see this wave count discarded as it would also now necessitate a clear breach of the blue channel and the maroon channel from the weekly chart.
Full and final confirmation of this wave count would come with a new low below 1,072.09.
If primary wave 5 reaches equality with primary wave 1, then it would end at 957. With three big overlapping first and second waves, now this target may not be low enough.
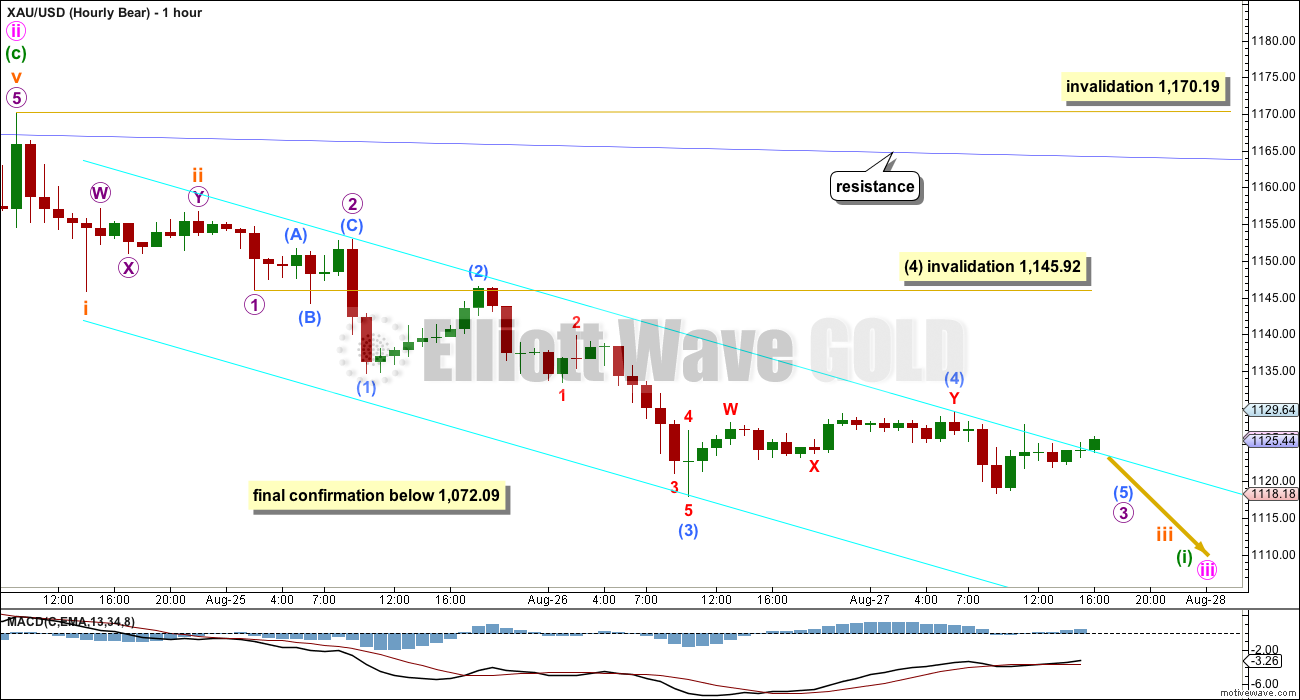
Click chart to enlarge.
This wave count expects an impulse to be beginning downwards. An impulse subdivides 5-3-5-3-5. So far the first 5 down is incomplete.
The beginning of an impulse and the whole of a zigzag have exactly the same subdivisions. There is no divergence between the labelling of the subdivisions at the hourly chart level (apart from the degree here being one lower) between bull and bear wave counts. The expectation of how downwards movement will unfold for the next few days will be the same.
When the first five down is complete, then the following second wave correction may not move beyond the start above 1,170.19. The rule for a second wave is the same as the rule for a B wave within a zigzag. There is no divergence between invalidation points either.
TECHNICAL ANALYSIS
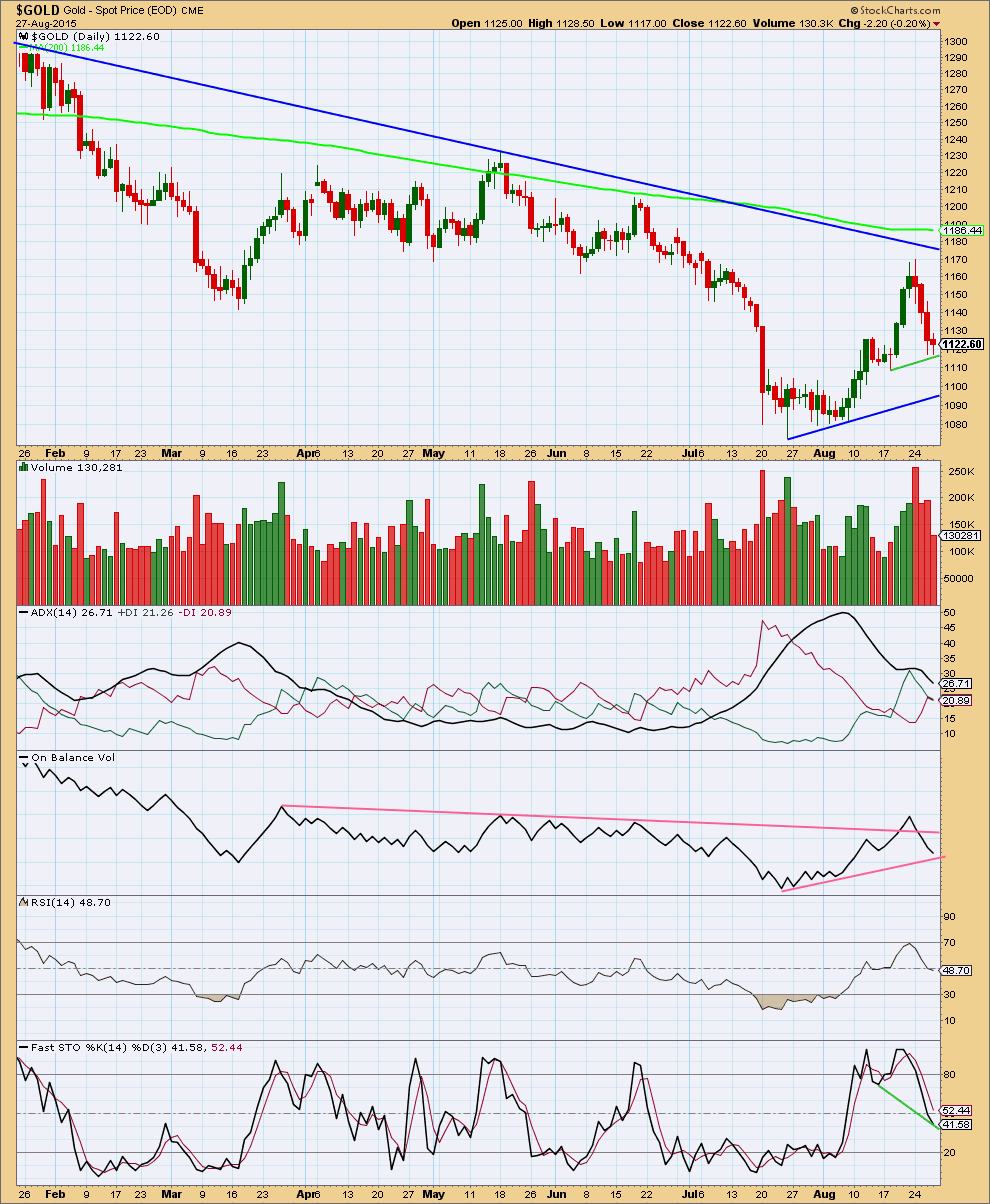
Click chart to enlarge. Chart courtesy of StockCharts.com.
The regular technical analysis picture is unclear.
I have changed the SMA today to show the 200 day SMA (lime green). Price has remained below the 200 day SMA since 6th February this year. A break above that line would be very bullish. With price below it and the average pointing down the larger picture looks bearish.
Today there is another red candlestick on sharply decreased volume. This candlestick has a very small red body and did not manage to make a new price low, so it looks like a very small correction within a trend. Volume for today may be lower for that reason. Price has not fallen to a new low, so the decline in volume is not necessarily bullish. But it is not bearish either.
During the prior upwards movement, the rise in price was clearly supported by a rise in volume culminating in a volume spike at the end. This looks bullish.
Overall the strongest volume day comes on a downwards day which supports the idea of a downwards trend, but that day was also a volume spike for the end of a movement, so it is not definitive either.
ADX is clear and tells us there is no trend and the market is range bound. A range bound system would be better employed than a trend following system. Resistance is being provided by the upper blue trend line, a potential support line has been drawn also in blue. Downwards movement would be expected to continue for this approach until Stochastics reaches oversold and price reaches support at the same time. Range bound markets should be avoided by all except the most experienced traders because they offer greater risk of losses. Trading a range bound market must be done with good money management and stops should always be used.
On Balance Volume is still overall bearish. While price is moving lower OBV also moves lower supporting the fall in price. The breach of the upper pink trend line on OBV is also bearish. I have added another trend line to OBV today which may provide some support. If that too is breached, then OBV would be again providing bearish indication.
There is still hidden positive divergence with Stochastics moving lower while price has not made new lows. This is a weak signal, but it is bullish.
At this time, because the picture is unclear from both the Elliott wave counts and regular technical analysis, the best approach would be to expect the market is currently range bound and to act accordingly. This means either stepping aside to wait until a clear trend emerges, or using a range bound system (like the one presented here with support / resistance and Stochastics). When traders insist on trading an unclear range bound market losses must be accepted as part of the risk, which must be carefully managed so that losses are minimized.
The strongest and simplest piece of technical analysis on this chart is the long blue downwards sloping trend line. This is replicated on the daily Elliott wave charts (it’s slightly different because the scales are slightly different). The larger picture is more bearish than bullish while the long blue downwards sloping trend line continues to provide resistance and price is below it. The bullish Elliott wave count must see price break above that line before full confidence may be had in it.
This analysis is published about 05:42 p.m. EST.
Volume for today’s up day is ever so slightly higher than the prior day, but well below the three downwards days which began this week.
This upwards movement is a correction against a downwards trend, at least in the short term.
This fits the EW counts, and so next week I’ll expect new lows and red candlesticks for another wave down.
The two biggest trades of the day to get right for maximum profits are at the market open and then at the low of the day direction change.
I’m interested in any success opinions and tips on getting these right. Thank you.
This upwards movement is a B or second wave, arriving earlier than I had expected. The invalidation point is at 1,170.19. I do not think it is quite over, current small sideways movement looks like a fourth wave triangle which would expect one final wave up.
My target for it to end will be 1,148 – 1,150.
When it is done the downwards move should resume.
Lara if possible we please get extra clarity on retracements which can last days.
Yes gold may continue down however after gold and miners dropped for 4 days last Friday to Wednesday’s low. Then already miners up big for 2 days and anyone holding bearish miner ETF like DUST expecting a bigger high in the near future may loss all their profits and suffer losses for days until gold finishes retracements and sideways chop until gold makes a new low. I have no DUST but many some may be looking to buy low and it’s still dropping and may for another 2 days.
Wednesday some had bullish miners but may have sold expecting deeper drops in gold when actually gold stalled and moved back up and miners came back up and DUST already dropped by 28% and JDST dropped by 37% in just 2 days.
4 days down followed by 4 days up on the deeper way down are trading opportunities with caution of course or else times to sell instead of hold like the last 2 days.
Thanks for your consideration Lara on this and all the clarity you already provide.
That upwards movement to the blue trend line last week was not what I had expected, as you know. While each day price moved higher I did expect it for the very short term, prior to each day it was not what I had expected.
This current fall is also deeper than I had expected at it’s start.
In short, while my prediction of direction for each day has been right more often than wrong, I am struggling with the bigger picture.
So to provide extra clarity… I would have had to have seen two things earlier than I did: I would have to have seen the resolution for the bull count which sees cycle b over half way through. And I would have to have seen a potential deep second wave correction up to the blue line providing resistance for the bear count.
And I saw neither of those possibilities before it happened.
I just don’t know what else I could have done to see that earlier.
I agree, anyone holding shorts would probably have been stopped out by that surprise upwards move.
Lara thank you for your clarity and honesty. Few would answer as you do, which I respect you for. Even if I studied the rest of my life I could NOT do a better job at forecasting gold than you.
I just got advised by a top trader that miners since Wednesday lows are already up two day and may go up another two days. I am out of DUST and it is very bearish today. Buying DUST today is trying to catch a falling knife.
Gold is definitely above the hourly channel but still within the daily channel.
Over the weekend in DUST may be risky as no clear gold trend however miners are retracing back up after mid week lows and punishing those who try to find low in DUST down another 3 dollars from Thursday’s low.
Hi Lara,
do you expect upwards movement to be over at today’s high?
Оne option.
I believe the A wave has a violation. second wave goes beyond the start of the first wave
Yes, it does.
An A wave within a flat correction can do that, but in this example it cannot be a flat correction because the B wave is well under 90% of the A wave.
So the count does not meet the rules.
I’m still long gold following the cup and handle pattern. Its broken out of the handle channel and on its way up. I will stop long until I see this patten fail.
Same targeting 1151 -1159 then drop then reload for a squeeze to 1201 Taking half my position off at 1148 setting stop to break even and I expect this all to end by Wednesday maybe Thursday
Going long on oil could’ve been spectacular.
I agree…personally, I’m waiting for the next pullback, probably on Monday or Tuesday, perhaps near 43 WTI, then long to an estimated 48 WTI…
Gold turning down from here to Lara’ target 1072. This is it for gold. NOT based on EW.
I just sold NUGT.
agree . gold should have topped
Papudi, congratulations, that was a gutsy call a few days back on NUGT. Do you move into DUST now or wait for clarity?
50% retrace of 1208/1073 at 1140-41 tested, hourly RSI has enough in it to test Linear Regression at 1145-46, a break above here will likely see Gold price take off to the races testing 1153+ with upside risk 1167-72; a break below 1126-23 now required….
A small bite after noon and by end of day some more.
Eli, good call.
thank you. will watch the character of this pullback to see if we’re off to new highs or if it is just a short term thing. But the tape was just screaming bullish to me
It will be interesting to see COT data today???
Massive increase in commercial shorts.
A larger portion of that was producers. Swaps are still net long.
I like Lara’s count right now, and will probably look to short on Monday.
Hi Lara, what you think about this count ?….is it possible count wave I and III as zigzag?
Thanks
I do not think that count is valid because of the subdivisions if II.
For a diagonal it needs to be a zigzag. When you try to see a zigzag in there the A wave only fits as a leading diagonal but the wave lengths within it do not meet the rules.
I know that Daneric and EWI have that upwards movement you have labelled II as a zigzag. I have no idea how they resolved that violation of the rules.
Go to this video and about 5:50 I show that piece of movement and explain the problem with seeing it as a zigzag.
This post is a day old, but it shows some targets for gold, silver, GDX, and GDXJ that may be useful. When you look at these charts, the intermediate term looks pretty bearish.
I’ll post the GDX chart and there’s many more charts in the link.
http://rambus1.com/?p=43432
Hi. So what would you suggest: To hold on to Gold Sell for a break below 20dma 1118 or close now? I have sells from 1166, 1156, 1146 and today 1132…. Thanks.
Looks like you are in good shape until we hit Lara’s target for Minuette wave 1 to end.
Dreamer: Many thanks your view. I am just a little concerned until a break below 20dma does not occur…
Personally I think we’re done going down for a while. Will need a little more confirmation before I add to longs, but I’m already positioned that way
Whilst 1119-1117 appears to be holding, looks like Gold price is finding resistance under 50dma with 10dma/5dma above there… Gold price broke to the upside of Thursday’s narrow range inside day, possibly indicative of continuation further upwards…. I wonder?~!
Hi Lara :
I think USOil had breached the daily trend line. Would you mind to take a look at my chart attached? Thank You. Any comments about the chart are very welcome.
I agree, Oil has breached the trend line. I’ll be updating the analysis of that and Silver tomorrow when I have some time to do so.
I’m not sure about your ending diagonal for minute (pink) (v). The fourth wave isn’t overlapping into first wave price territory.
Oh yes , totally forgot about that rule! :)-Thank you. Looking forwad for your wave analysis.
Hi Lara, are you still looking for a better data feed than fxcm?
Not for price, no.
My options are limited, I use Macs. I looked at BarCharts and Money.net. Neither provide Gold spot (cash) data, they provide futures only. Futures data is lighter, very gappy, it’s not heavy enough for a good EW analysis.
I’ll use StockCharts data to supplement for regular TA.
But until Money.net provide data for the cash market I’ll continue to use FXCM.
Their price data doesn’t change. It’s their volume data which is suspect, due to retrospective changes.
Same setup for me, I’m using the yahoogle feed, at least its free, but no gold, that’s why I’ve switch to analysing GLD instead. My interday gold data is at Investing.com looking at their in house CFDs, but I can only get their EoD into motiveWave.
If I understand it correctly, you’re analysing fxcm CFDs?
Have you read this
https://en.wikipedia.org/wiki/FXCM
Yes.