
A breakout of this consolidation is expected to occur on Monday.
Summary: The triangle is most likely complete. Subminuette wave v down should unfold next week to either 1,068 (more likely) or 1,036 – 1,038 (less likely). If the first target is correct, then it may be reached within one to three days. If the second target is correct, then it may be met in five or eight trading days. The upper edge of the pennant pattern is providing resistance. Each time price touches that trend line or the bright aqua blue trend line it should find resistance and a bounce down should be initiated. As long as price remains below 1,099.61 this scenario will be preferred; a new low short term below 1,082.77 would provide confidence in a downwards breakout. If Monday completes a red candlestick with increased volume, then a downwards breakout would be strongly indicated.
To see weekly charts and analysis click here.
Changes to last analysis are bold.
MAIN ELLIOTT WAVE COUNT
Click chart to enlarge.
Cycle wave a is an incomplete impulse.
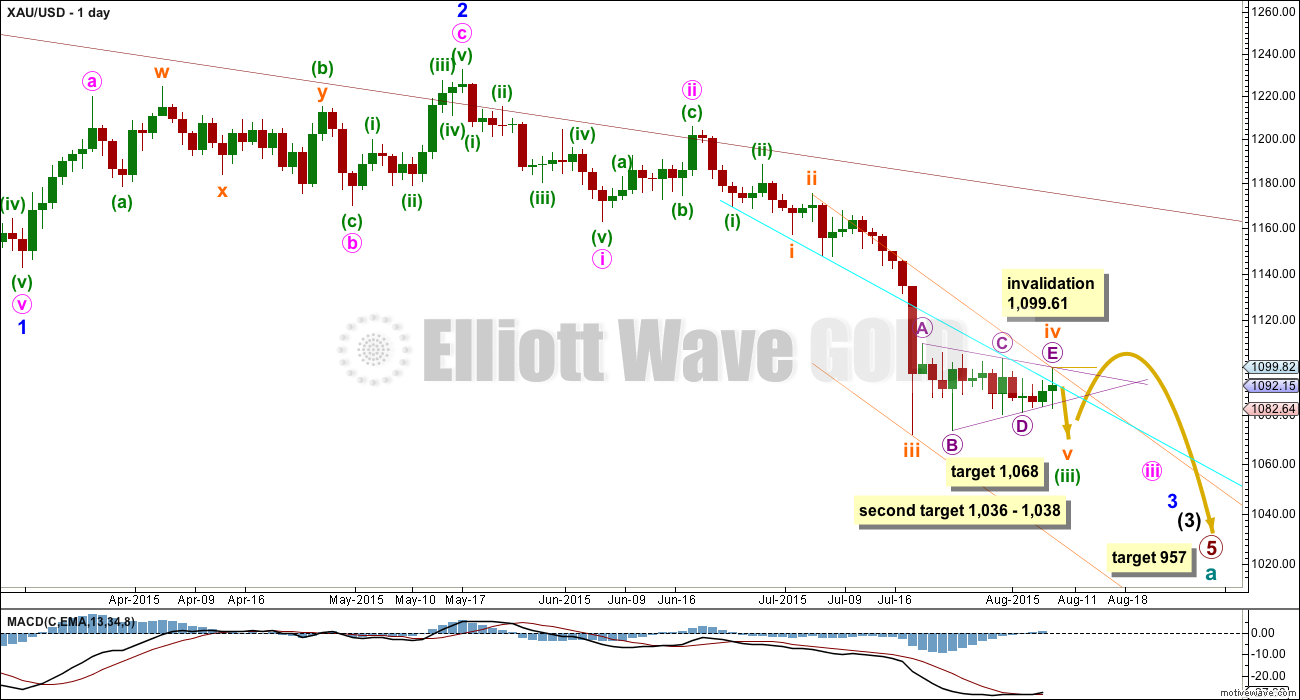
Within primary wave 5, the daily chart focuses on the middle of intermediate wave (3). Within intermediate wave (3), minor wave 3 now shows a slight increase in momentum beyond that seen for the end of minor wave 1 at the left of the chart. Third waves for Gold usually have clearly stronger momentum than its first waves, so I still expect to see a further increase in downwards momentum. The strongest downwards momentum may appear in a fifth wave somewhere within minor wave 3, maybe the fifth wave to end minuette wave (iii) or minute wave iii, or that to end minor wave 3 itself.
Subminuette wave iii looks like it is over at the daily chart level. Subminuette wave iii has a typical curved look to it at the daily chart level and this wave count has the right look.
Subminuette wave iv may not move into subminuette wave i price territory above 1,157.14.
Subminuette wave iv is a regular contracting triangle. The structure is clear on the daily and hourly charts. Subminuette wave ii was a relatively deep 0.58 zigzag lasting two days, and subminuette wave iv exhibits perfect alternation as a shallow 0.27 triangle lasting fourteen days. Zigzags are normally quicker than triangles, so some disproportion would be expected. This disproportion is a little unusual for Gold. Sometimes this happens, but not often. It does also mean that this main wave count should be preferred over the alternate because the alternate requires the disproportion to be even greater.
The bright aqua blue trend line has been overshot. That’s okay because price is returning below it. Once price is again below that line, it should again show were upwards corrections find resistance. At the daily chart level, it looks like micro wave E to end the triangle ends perfectly at the A-C trend line, but on the hourly chart this is overshot (the charts are on different scales).
At 1,068 subminuette wave v would reach equality in length with subminuette wave i. This target is more likely because Gold’s fifth waves to follow fourth wave triangles are sometimes surprisingly short. If price reaches the first target and the structure of subminuette wave v is incomplete, or if price just keeps falling through the first target, then the second target would be used. At 1,036 subminuette wave v would reach 0.618 the length of subminuette wave iii, and at 1,038 minuette wave (iii) would reach 4.236 the length of minuette wave (i).
Extend the triangle trend lines outwards. The point in time at which they cross may see a trend change. Sometimes this is when the fifth wave to follow ends.
Within the final fifth wave of subminuette wave v no second wave correction may move beyond its start above 1,099.61.
At 957 primary wave 5 would reach equality in length with primary wave 1.
Click chart to enlarge.
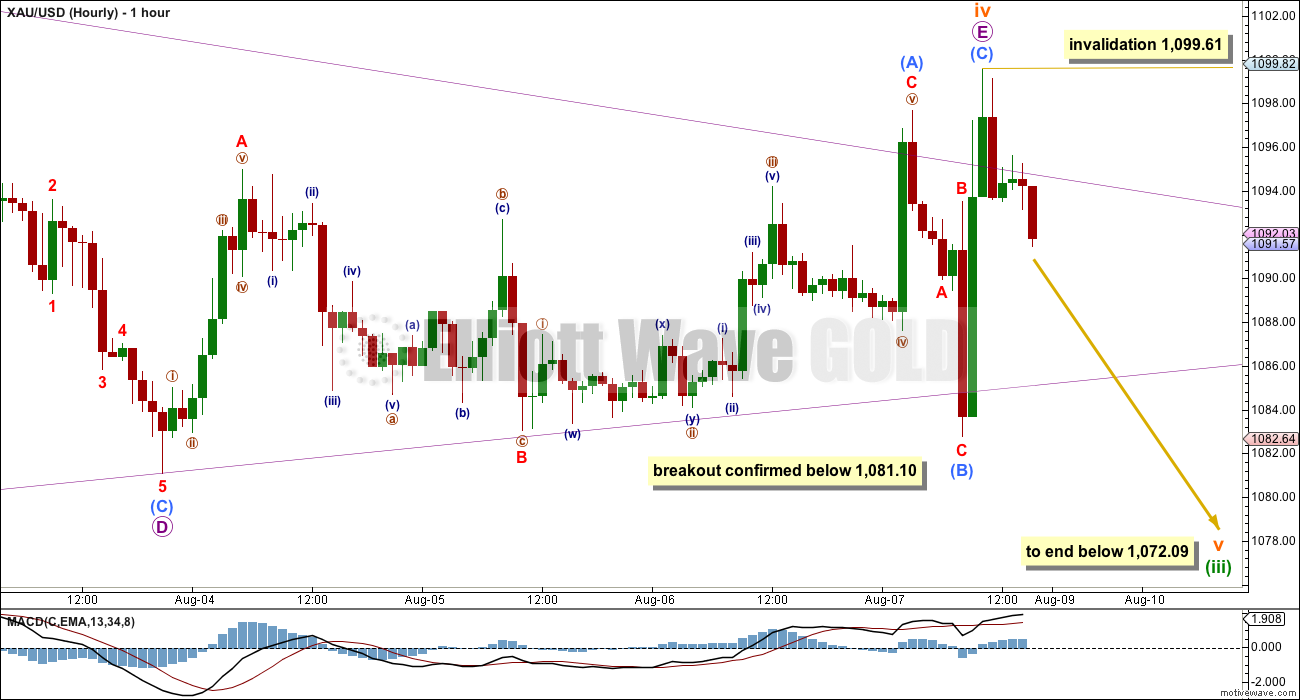
Four of the five sub waves of a triangle must be zigzag or zigzag multiples. Within this triangle, it was micro wave B which fits best as a double zigzag. Only one of the triangle sub waves may be a multiple.
This main wave count has two small problems:
The first problem is within the zigzag of micro wave C (to the left of the chart). There is a truncation: submicro wave (C) was 1.57 below the end of submicro wave (A).
All of the triangle sub waves must subdivide as corrective structures. One of them may be a structure different to a zigzag or zigzag multiple. Micro wave E fits as a regular flat correction, which meets the rules for a triangle. Within the flat correction of micro wave E, submicro wave (B) is just 90% of submicro wave (A) (it is 89.928). I would round this up to 90%, but it is on the borderline of acceptability, so this is the second problem for this wave count.
A new low below 1,082.77 would provide some confidence in a downwards breakout of the triangle. At that stage, if it comes on a downwards day with clearly stronger volume, then that would increase the probability a downwards breakout is underway. If the structure of downwards movement is unfolding as a five and not a three, then that would increase the probability for this wave count.
I will be looking carefully at how the next wave down unfolds to determine if the alternate below can be discarded or not.
ALTERNATE ELLIOTT WAVE COUNT
Click chart to enlarge.
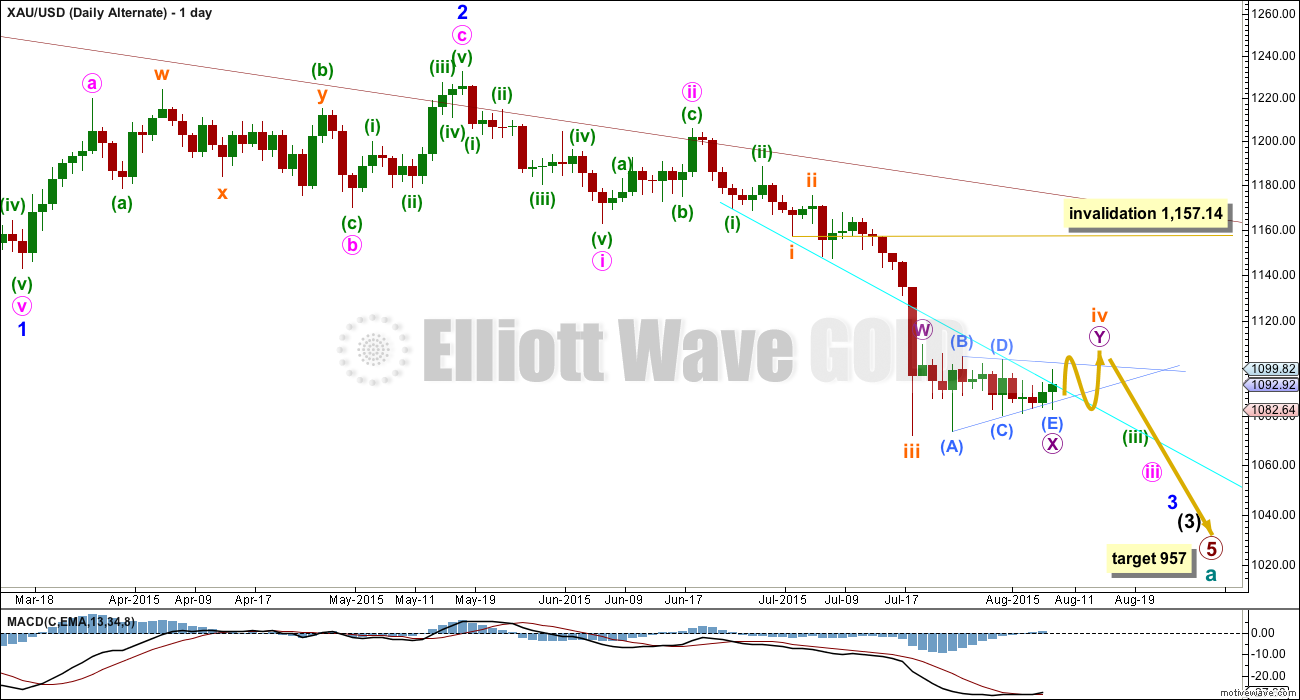
With the end of the triangle for the main wave count looking slightly odd and the two small problems within it (as outlined above), I want to consider all possibilities.
Triangles are very tricky structures. The difficulty comes with figuring out exactly where they begin and end. What if the triangle began later than the main wave count expected?
If subminuette wave iv is to continue sideways as a combination, then the second structure within it may only be a flat correction (only one zigzag is allowed within a combination and micro wave W is already taking that). A flat correction for micro wave Y would need at least three days to unfold, and probably longer. This would see subminuette wave iv absolutely huge in terms of duration compared to the three days for subminuette wave ii. The disproportion for the main wave count is already extreme; for it to continue has a very low probability.
The triangle would be seen here as micro wave X, a “three” to join the two structures of a double combination.
Subminuette wave iv may not move into subminuette wave i price territory above 1,157.14.
Click chart to enlarge.
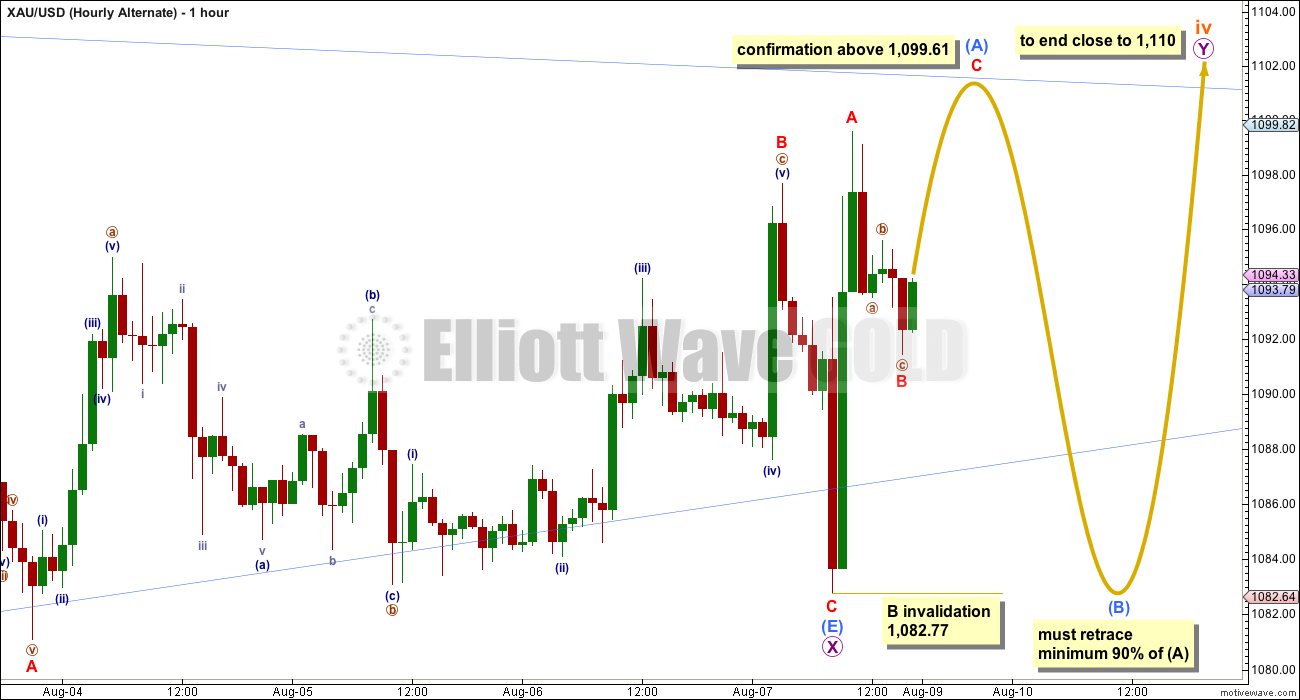
If the triangle was micro wave X, then within it submicro wave (A) subdivides as a double zigzag.
There is a truncation too within this triangle: within the zigzag of submicro wave (E), minuscule wave C is 1.67 above the end of minuscule wave A.
Apart from the big problem of disproportion, there is another significant problem with this wave count: the wave down labelled minuscule wave C must be seen as a five wave structure, which is very difficult, even on the one minute chart.
Micro wave Y may only subdivide as a flat correction. Within the flat, submicro wave (A) must be a three wave structure, so it cannot be over at the high labelled minuscule wave A because that subdivides as a five. Submicro wave (A) would be unfolding as a zigzag, and within it, minuscule wave B may not move beyond the start of minuscule wave A below 1,082.77.
A new high above 1,099.61 would invalidate the main wave count and provide confirmation for this alternate.
When submicro wave (A) is a completed three wave structure, then submicro wave (B) must retrace a minimum 90% of submicro wave (A) and it must do so as a three wave structure. Submicro wave (B) at that stage may move beyond the end of submicro wave (A) as in an expanded flat. B waves within flats are most commonly between 1 to 1.38 times the length of the A wave.
The purpose of double combinations is to take up time and move price sideways. To achieve that purpose the second structure in the double normally ends close to the same level as the first structure. Micro wave Y may be expected to end about 1,110 because that is where micro wave W ended.
Overall I would judge this alternate to have a very low probability, maybe as low as 5%. But I want to consider all possibilities no matter how unlikely. Sometimes a low probability outcome does occur, and if it does, then it is better to be prepared.
TECHNICAL ANALYSIS
Click chart to enlarge.
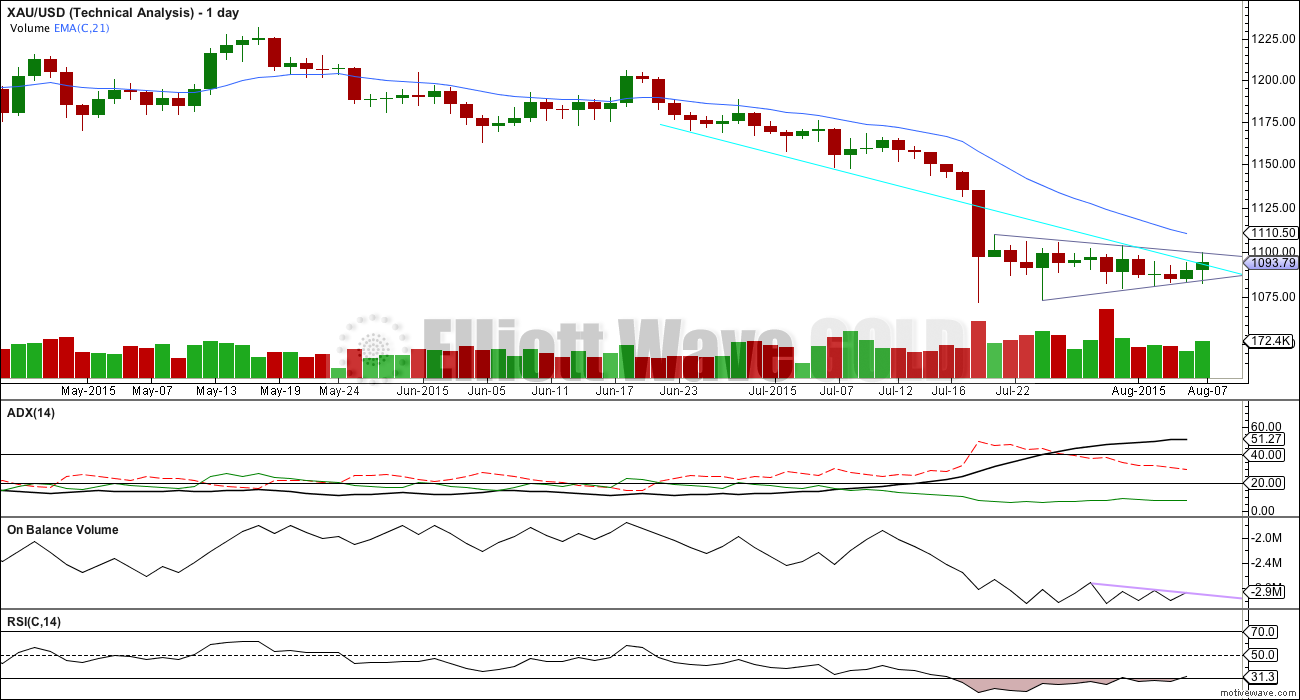
The small pennant pattern continues to unfold. Pennants are smaller versions of triangles. This classic technical analysis pattern is the most reliable continuation pattern, particularly when it turns up in a clearly defined trend and unfolds on declining volume as this one does. During the unfolding of this pennant pattern, it is a downwards day which clearly has the strongest volume providing further indication that the breakout of this pattern is likely to be downwards. When price breaks below the lower trend line of the pennant, and when volume shows an increase, then a downwards breakout should be expected to be underway.
Pennants can last up to three weeks. This one is within its second week. If the breakout comes on Monday, then it will still be a pennant pattern. To become a classic technical analysis triangle it would need to continue into next week.
ADX continues to rise during the formation of this consolidation. Despite price drifting sideways the trend continues to strengthen and remains down.
A trend following strategy should be used. Trading with the trend is advised. A mean reverting system which allows trades against the trend should only be used by the most experienced professional traders, and for all others it is strongly advised to never trade against the trend.
The simplest system for a downwards trend like this is to use resistance lines: each time price touches resistance that represents an opportunity to enter in the direction of the trend. Trades may be held until price either reaches support, a target, or if the trade is held for one day if you are a day trader. Depending upon your trading style, your risk management, and management of the equity in your account, stops as always are essential: they may be money management stops, they may be just above lines of resistance (allow for small overshoots), or they may be Elliott wave invalidation points.
Corrections against the trend offer an opportunity to join the trend at a good price. Corrections do not offer good trading opportunities when they are at low wave degrees; trying to trade the small waves within a correction exposes your account to the potential for big losses.
This approach outlined here is just one trend following method of many.
There is a little positive bullish divergence last week: the low for 23rd July did not move below the prior low of 17th July, but On Balance Volume did make a new low. OBV moved lower while price did not. This bullish divergence indicates a correction against the trend to unfold, which is what has been happening. This correction should resolve this divergence.
Today’s small green candlestick has somewhat even upper and lower wicks indicating a continuation of the correction. It comes on slightly higher volume, but volume for this upwards day is still lower by a wide margin than a prior downwards day within the pattern.
On Balance Volume is moving within a narrowing range while price does too. The breakout is now very close.
RSI has returned from oversold to above 30. There is again room for the market to fall.
This analysis is published about 05:37 p.m. EST.
Just Sold DUST as well as selling my mining holdings this morning.
really really awful awful day.
This is exactly why I provide confidence price points. They don’t always work, but they work very often.
“A new low below 1,082.77 would provide some confidence in a downwards breakout of the triangle.”
We never did get any confirmation or confidence that the downwards breakout was underway.
And this is also why I’ll provide alternates when I see they’re necessary.
Corrections are harder to trade, and impossible until the end to know exactly which of the 23 possible structures a fourth wave was.
There’s another maxim of long time traders: trying to pick highs and lows is a fools game. It will see you take too many losses. Waiting for confirmation that a trend has resumed is a better safer approach.
Stay with the trend, wait for confirmation that corrections are over before jumping back in. While a correction is underway accept that flexibility is essential, and know what you need to see to know it’s over.
Main Wave count – Invalidated
“Must retrace a minimum 90% of (A)” – into 1080’s – Incorrect
Not hard to see why I held Dust.
Sold miners based on all analysis indicating downside was imminent – incorrect.
I’m not confident with how I had the triangle labelled in this analysis above.
I’ve taken another look at it, and I think it ended earlier as a nine wave triangle for X.
Which means Y as a flat correction is almost complete. Technically it’s just a regular flat because B to end a the last low of 1,082.77 was 109.9% of A. If we round this up (it’s 109.866) to 110% it’s an expanded flat.
Either way, the C wave must be a five and it began back at the last low of 1,082.77.
Someone mentioned a few days ago when that whipsaw unfolded that it didn’t look like how a triangle ended, and I agree. And that’s what I was not comfortable with.
If the triangle ended earlier then that whipsaw was the end of waves A and B within a flat correction. The behaviour fits better.
This means I’d be expecting another green candlestick for Tuesday up to a target zone at 1,118 – 1,123. And that should end this fourth wave correction.
The bigger picture; intermediate (3) is incomplete and it still has to show an increase in downwards momentum beyond that seen for intermediate (1) which is clear and strong. It hasn’t done that yet.
When this fourth wave correction is over then the fifth wave down to end minor 3 may be very swift and very strong. Another huge drop down would be typical for Gold.
This makes the most sense of all and seems absolutely correct. Great work, Lara!
The main wave count is invalidated and the alternate is confirmed. The correction is not over.
This upwards day comes with lower volume, this rise in price is not supported by volume.
Volume continues to tell us Gold is within a consolidation, and it’s not over yet.
There will be only one wave count today; a fourth wave is unfolding as a combination, zigzag – X (triangle) – flat.
The flat is unfolding 3-3-5 and the A wave within it is probably incomplete. I can see a zigzag unfolding upwards, with A-B and C incomplete, looking like it needs it’s final fifth wave up to make an impulse. I need to look at the subdivisions of this zigzag up on the five minute chart first though before I can be firm on that conclusion; I’ll be looking to see if it could be over already.
The flat needs a B wave down to be a three wave structure and retrace a minimum 90% of the A wave.
I’m moving the degree of labelling of this fourth wave correction all up TWO degrees today. The duration is just way to long to be subminuette or even minuettte. It looks right as minute.
I’ve already spent some time looking at the hourly chart to see if minute wave iii could be over, and it does work albeit not perfectly. But the duration of this correction is indicating that despite imperfections within the third wave (an expanded flat in there with a very deep B wave is my problem) that is what this is.
It doesn’t fit into it’s Elliott channel either which is annoying. It’s not easy to find the upper line of resistance at this stage.
Minute ii was deep, right at 0.618 of minute i. So this fourth wave may end about 0.382 of minute iii which is at 1,121.
Minute ii was a zigzag so minute iv as a combination shows perfect alternation.
The other option for minute iv would be a double zigzag, but that does not look right because the X wave is too deep and it’s a triangle, and that wouldn’t provide good alternation with the single zigzag of minute ii. But I will consider it, we need to consider all possibilities.
The downwards breakout will come, but not yet. Only when we see a red candlestick at the daily chart level with increased volume will it be indicated.
Well that answers my question :). Thanks
Yay! I am glad that you are finally moving this fourth wave up two degrees. It makes so much more sense. I was also worried about getting all kinds of misleading targets in the future. Now we are on the same page. 🙂
I know. It became increasingly problematic the longer it dragged on.
One of the hardest things about EW is which degree to label a movement. And it’s often not until it’s almost over that it’s clear.
And today’s invalidation points to why alternate wave counts are so important. Because there are 23 possible structures for a fourth wave correction it’s impossible to tell which one will unfold, so you have to be flexible and look at all possibilities while it unfolds and use alternates.
There are a couple of things of which I am still confident: this is a correction against the trend, the trend is still down, and the correction is not over.
From a classic TA point of view the breakout will still be down and will only be indicated with a red daily candlestick on higher volume.
And I keep saying: trying to trade the small waves within corrections is never advisable. When markets are correcting I stay out of it and wait for the correction to be confirmed as over before I re-enter in the trend direction. That’s simple, easy and profitable.
The next fifth wave down to end minor 3 is likely to be a typically strong extended fifth wave. If minor 3 were to reach 1.618 X minor 1 it’s target would be 965. For now that will be the target with the caveat that once the downwards breakout is confirmed it may be recalculated; then I’ll be able to calculate it at minute degree.
I thought that there is one more larger 4th wave correction to come still? Maybe that is what you mean.
I thought that this current 4th wave would complete somewhere in the 1100-1130 range, so your 1118-1123 target seems right on par. Then would come a 5th to take gold to around 1050 area (give or take).
However, thereafter, I would expect a lengthy multi-week correction (intermediate 4 of primary 5). The final plunge to 900s (intermediate 5 of primary 5) may occur at the end of 2015 or early 2016.
Along the way down to the final target we need two more big fourth wave corrections; the first for minor 4 and thereafter another one for intermediate (4).
For both of these I’ll expect them to be more brief than their counterpart second waves, and to also be shallow. They’ll still be multi week corrections though.
Minor 3 is not over yet. This current correction is the fourth wave within it. And so when this is done minute wave v to end the impulse of minor 3 may be very swift and very strong.
The only degree I can calculate a target for minor 3 to end at this stage is minor degree. And 1.618 X minor 1 = 965.
That’s still above 956, but not by much, and so I don’t have a lot of confidence in that target. Which means I should probably not try to calculate it at this stage. I know members are going to ask though. It’s a conundrum. I think it’s probably best left alone for now.
Thank you for the thorough answer.
I know that this is not something that you necessarily work with, but I, for one, will be very cautious about a strong upside correction come September. Historically, September is often one of gold’s strongest months. This one, in particular, will also be a loaded one because of the most anticipated FOMC meeting of the last decade.
That may be minor wave 4. It should move price comfortably higher and probably won’t last as long as minor 2 did.
But first, minor 3 down has to end.
Question for EW experts – i realize you can’t have a plain old zigzag to end Lara’s alternate idea, because you can’t have more than 1 zigzag in a double combination. But, why is it not possible for this 4th wave to be a simple wxy double zigzag with the x wave also being a triangle?
Unless the answer is you could, but it wouldn’t have the right look in this particular case because price has moved sideways and would need to move much higher against the trend. And also that it wouldn’t be as good an alternation
Lara Is alt wave count in play as flat?
If so how far gold is to rise from here?
Gold should go down to low 1080s now and then back up to 1110 area.
THX Matt
Sorry for the wrong info, Papudi. Lara said that gold still has upside potential to 1118-1123.
Raphael: I couldn’t reply to you below, but I believe that the last leg of the A wave completes as a simple zigzag. In other words, it is a smaller three wave structure.
However, to be clear, the bigger C wave, which is still a few days away, will be a 5 up.
I think Raphael is correct that submicro (A) and miniscule C are not over yet because miniscule C has to subdivide as a 5. We’ll see what Lara says shortly.
I was wrong. Thanks for clarifying. Lara talked about that around the 9 min mark of yesterday’s video and confirmed now.
Raphael, my apologies. I reviewed Lara’s video from yesterday and she confirmed that C of A must unfold as a 5. In the meantime, she also confirmed just now in the comments section.
@ Alister, comments maxed out below.
freestockcharts.com = TC2000 but with advertising and not supported the same as paid version I’m sure. Works for now.
Excellent – much appreciated.
I can now see from the chart that DUST reached your target – nice – did you get in?
yes sir I am. (almost said yes mam) XAU looks ready to come down. come on wave, do your thing!
Gut wrenching day so far….
For the alternate Lara stated “Micro wave Y may be expected to end about 1,110 because that is where micro wave W ended” Could this have passed already today at 1109?
I hope so –
Rotten day.
I don’t think so, because of the discussion about A-B-C within the micro Y. The B wave would need to retrace ATLEAST 90% of the A wave . I think we are finishing off the A wave now. Low of 1087.22 – 1108.94?? = A wave
So what is your target for submicro b ?
1085.50 @ 90% retrace. Lara said it could also be an expanded flat in which case, the target would be lower than 1082.88. Too early to tell which one would play out.
hi tham,
are you confident that A is over?
is it possible that 1109 was wave 3 of A and we just finished wave 4 at 1103?
thank you very much!
Hi Raphael.
Lara said micro Y must be a flat correction. Flats subdivide 3-3-5, so submicro A must be over since three waves can be counted.
hi Tham again and thank you,
sry c of A has not to be a five wave structure?
You’ve got a point there. We shall see the development.
This will be a larger 3 part movement – A up (which may or may not be complete now), B down (which has to drop at least 90% of the A wave) and then a final C wave up to likely end “close” to 1110.
This will all take a few days to unfold. However, the good news is that this is a fairly reliable pattern with ample trading opportunities.
Looks like Gold price is headed for an all out topping rally having eloquently tested the $1101-09 range, currently basing off $1104 (20dma) appears to be looking for more, perhaps the $1111-1116 range…. Hard to see Gold price back down to $1097-92 in a hurry…
It looks like we completed a 3rd wave at the low of 30.88 on dust. I also kept a small amount of dust thinking we were in a third wave up from 34.25, and set my stop at that price if I was wrong and took a loss today. It looks like on the two min chart that we still need another low on dust.
I have the wave 5 target between 30.25 and 29.50. That 3rd wave was killer, I have a rough calculation of 4.4 the length of wave 1, close enough to the fib ratio of 4.2.
What is target for wave 4?
Currently holding and would like to exit
holding NUGT or DUST?
if Dust I’d exit at submicro (B) end on Lara’s chart and re-enter at (C) top for 5th wave down. i think we just started (B) wihin Y within 4 .
per Tham 1:49 below:
1085.50 @ 90% retrace. Lara said it could also be an expanded flat in which case, the target would be lower than 1082.88. Too early to tell which one would play out.
see also Tham’s post @ 1:22 for more details about Dust.
[go to browser “Edit”, click “Find” and type 1:22] for faster searching
At this rate we’ll make Tham’s second DUST target @ 27 🙂
ouch.
Where is Tham by the way?
I sold for a loss from Friday, when gold made new highs. I’m not convinced it will go that low today, but would like to get in at these current sort of prices when gold looks likes it’s stopped rising!
absolutely. I decided not to sell Friday. In quite high, but as long as Lara’s overall direction is correct, I should be ok — re-buying larger amnt low.
Dsprospering – also holding from Friday.
Now that Alternative confirmed unlikely to retake $39
I’m looking at 4hr Dust 50-ma as buy in tgt and bouncing from there. Based on XAU we may be bouncing already – don’t know cause I can’t count small EW. Need EW analyst for that. Sure hope dust isn’t closing its gap and Tham’s 27 tgt is wrong.
Thanks. What are you using for your DUST chart?
TC2000 free version– responded on last forum
oh sorry, I responded to Aidan last forum
Thanks ds. Having trouble finding the free version, though.
DUST is in a 4th wave correction beginning at 40.00. Today’s low will be the first (of three) subwave. It has now completed the first subwave at 30.36, or there could be one more slight drop. My estimate was 30.09.
DUST will reach 27 at the end of the 4th wave, following closely gold’s rise. Gold has completed submicro A at 1109.05. Lara said that submicro B will retrace at least 90% of submicro A. DUST may also retrace up to 90% of the drop from 40.00 to today’s low. I am waiting to see if the low is in before buying DUST. At 0.618 retrace it ought to rise back to 36+. But if 90% it would hit 39.
I was watching the freak 5% probability alternate develop and hence did not participate in this forum earlier.
appreciate your comments now. amazing how a rare or 5% can show itself.
I agree. This is an anti-percentage play as we call it in contract bridge. Nobody in their right mind would execute such a play, hence the anguish shown today.
when there are 2 counts it is 50/50
Lara, I’ve seen some scary bullish targets on other forums. like 1257; 1144(less scary, but still). Can you confirm that we are near submicro (A) end
[of micro Y] within the alternate chart?
Any thoughts on this move?
This move fits the alternate.. Per Lara’s alternate chart, we are in subminuette C. That should subdivide as a 5. It looks to me like we are either in submicro 1 of micro 4 or miniscule 2 or 3 of submicro 5 of micro 3.
Thanks Fencepost
So 1172 is off the table now for quite a while?
Still holding DUST as expecting this to fall back new we are at resistance?
Looks like I was having trouble with the colors on Lara’s alternate hourly chart.
What are your current thoughts, fencepost?
see Dreamer’s response below: 11:01
Aug 20 th 2015 important date for 3xetfs traders:
Always reverse splits for 3xetfs; Thats telling you how costly these etfs are in terms of price decay.
——————————————————————
Reverse Splits
Direxion will execute 1-for-4 reverse splits of the shares of the Direxion Daily India Bull 3X Shares (INDL), Direxion Daily Real Estate Bear 3X Shares (DRV), Direxion Daily Semiconductor Bear 3X Shares (SOXS), Direxion Daily Developed Markets Bear 3X Shares (DPK) and Direxion Daily Natural Gas Related Bear 3X Shares (GASX), effective at the open of the markets on Tuesday, August 20, 2013. The firm will also execute a 1-for-5 reverse split of the shares of the Direxion Daily S&P 500 Bear 3X Shares (SPXS) and a 1-for-10 reverse split of the shares of the Direxion Daily Gold Miners Bull 3X Shares (NUGT), also effective at the open of the markets on Tuesday, August 20, 2013.
Which wave count is in play here????
Should gold move down?
Thank you Papudi for your wonderful posts here. About David Stockman’s massive deflation prediction and the ETFs reverse splits. Very appropriate information.
As to should gold move down… 🙂 of course! Down, then up in the coming months perhaps? I’m hoping everyone here is on the right side in this process.
re timing: we are still below Lara’s 1099.61 marker.
David Stockman a former OBV director from White House.
Thinks the top is in for the Stock Market and sees massive deflation ahead.
http://davidstockmanscontracorner.com/david-stockman-cnbc-interview-tops-in-next-comes-an-epochal-deflation/
Good video. Offers fundamental reasons for Gold’s decline.
Been trying to figure out the crazy movement since the end of the triangle. Since we haven’t made a new high yet, Lara’s main count is still in play. My idea is that we may be carving out a leading diagonal for Micro 1 of Subminuette 5. We need to move down from here for this idea to work. Let’s see what happens.
Anytime an (alleged) 2nd wave is this deep, a diagonal is really all that is left. I had the same thoughts, but decided not to participate just yet. Too many mixed signals; the situation is not clear.
This idea has been invalidated. Looks like the alternate is in play.
yes. Any idea where the miniscule C/submicro(A) might end?
We might be in the 4th wave of it, so a slight new high and then we should drop.
maybe still in wave 3?
That idea isn’t valid because your second wave is not a zigzag (nor a zigzag multiple).
Within a leading or ending diagonal the second and fourth waves may only be zigzag.
That one is an expanded flat.
New Rambus public post on GDX and GDXJ…still bearish
http://rambus1.com/?p=42263
Hi Lara,
Can you comment on oil? It looks like oil(uso) has made a new low, however xle didn’t. Possibly a divergent is starting between oil and oil stocks. If oil stocks are beginning to bounce could that translate to other commodities bouncing as well. Thanks.
Only when the upper edge of the trend channel I’ve drawn about US Oil is breached would I expect the downwards wave has ended. At this stage it’s not breached.
Likely alternate hourly wave count in play…. With a bullish close above $1093, Gold price is bottomy at $1091-$1088 looking to rally – stochastic and MACD are bullish….
Normally I would say that a triangle after a bigger drop should continue in that same direction. Moreover, I even lowered my immediate target for gold to 1050 or below, because I believe a larger 4th wave is in play. But, what is really confusing me at the moment is that MACD and Bollinger Band point to a bounce. Also, as of this post, gold has been taking its time moving lower. Should be dropping faster, but it is not.
I have two possible upside targets that don’t necessarily match with analysis above, namely 1107 and 1126, should gold temporarily move higher before it goes lower.
My gut tells me that something is off, so I’ll wait this one out.
It does look like a 2nd wave correction is close to completion, so trend is down.
This is not correct. What I thought was a 2nd wave has morphed.
Hi Lara, after reaching 1068 or 1038-1036, what’s next. Thanks.
Minuette 4 will then take gold back up to 1,100-1,110 or higher, up to as high as the end of Minuette 1 at around 1,160. Lara will provide a more precise target once Subminuette 5 and Minuette 3 are reached.
I’ll wait to see if this final fifth wave down unfolds as expected before I answer that question. Thank you.
Good answer!!! No speculation here. Only thoughtful EW analysis.
Thanks Lara.
Three of the 3x Miners ETF’s are reverse splitting on September 10th.
NUGT, JNUG, JDST
http://www.direxioninvestments.com/press-release/reverse-share-splits-of-six-leveraged-etfs?utm_campaign=Split%20Email%20August%202015&utm_medium=email&utm_source=Eloqua&elqTrackId=04DFB8417D93C90EF4FFB6CEF113AB2C&elq=e28d6b9d94664647bc164f12d4c6f979&elqCampaignId=1099&elqaid=1917&elqat=1