
Price continues to move lower as expected.
Summary: Fifth waves on commodities are often very swift and strong. The target for this one to end is at 21.96, and may be met in another six months time. Along the way down, corrections are very likely to find strong resistance at the upper edge of the channel.
Changes and additions to last analysis are bold.
MONTHLY ELLIOTT WAVE COUNT
Click chart to enlarge.
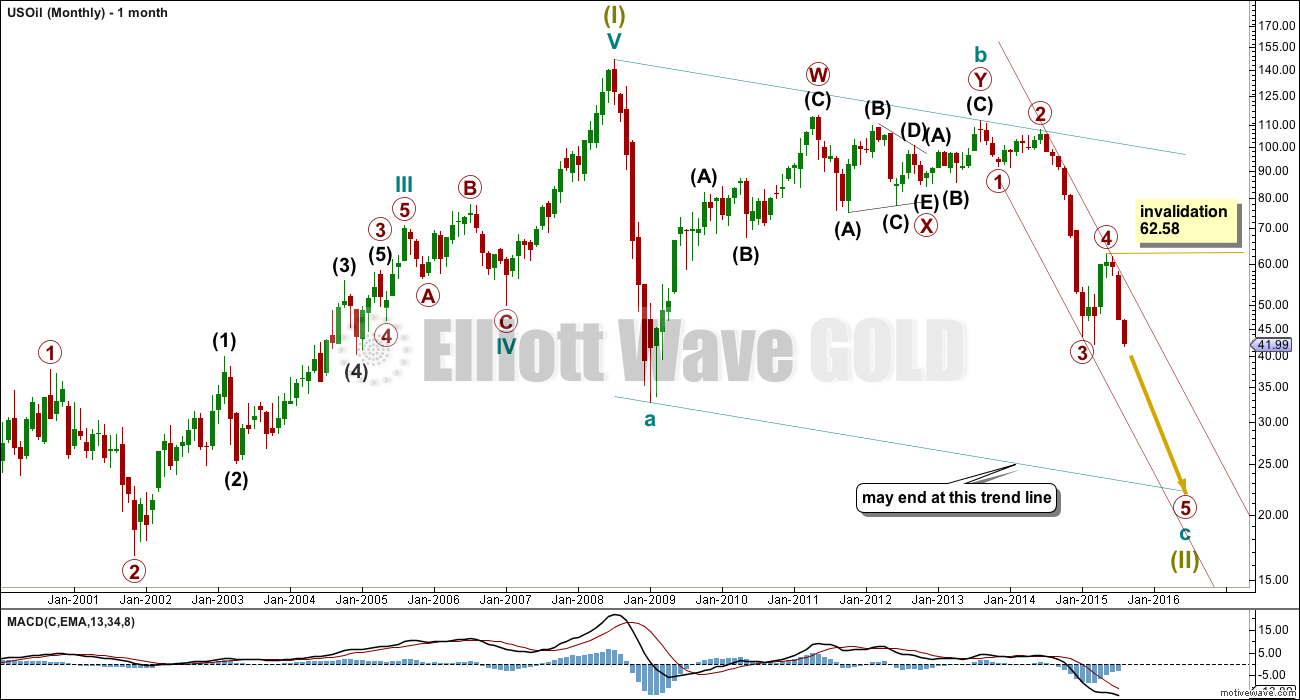
This wave count sees US Oil as within a big super cycle wave (II) zigzag. Cycle wave c is highly likely to move at least slightly below the end of cycle wave a at 32.70 to avoid a truncation. Cycle wave c may end when price touches the lower edge of the big teal channel about this zigzag.
Within cycle wave c, primary wave 5 is expected to be extended which is common for commodities.
Within primary wave 5, no second wave correction may move beyond its start above 62.58.
Draw a channel about this unfolding impulse downwards. Draw the first trend line from the lows labelled primary waves 1 and 3 then place a parallel copy on the end of primary wave 2. At the monthly chart level, this channel should provide resistance. Primary wave 5 may possibly be strong enough to overshoot the lower edge of the channel, but if it does that it should find some support there first.
DAILY ELLIOTT WAVE COUNT
Click chart to enlarge.
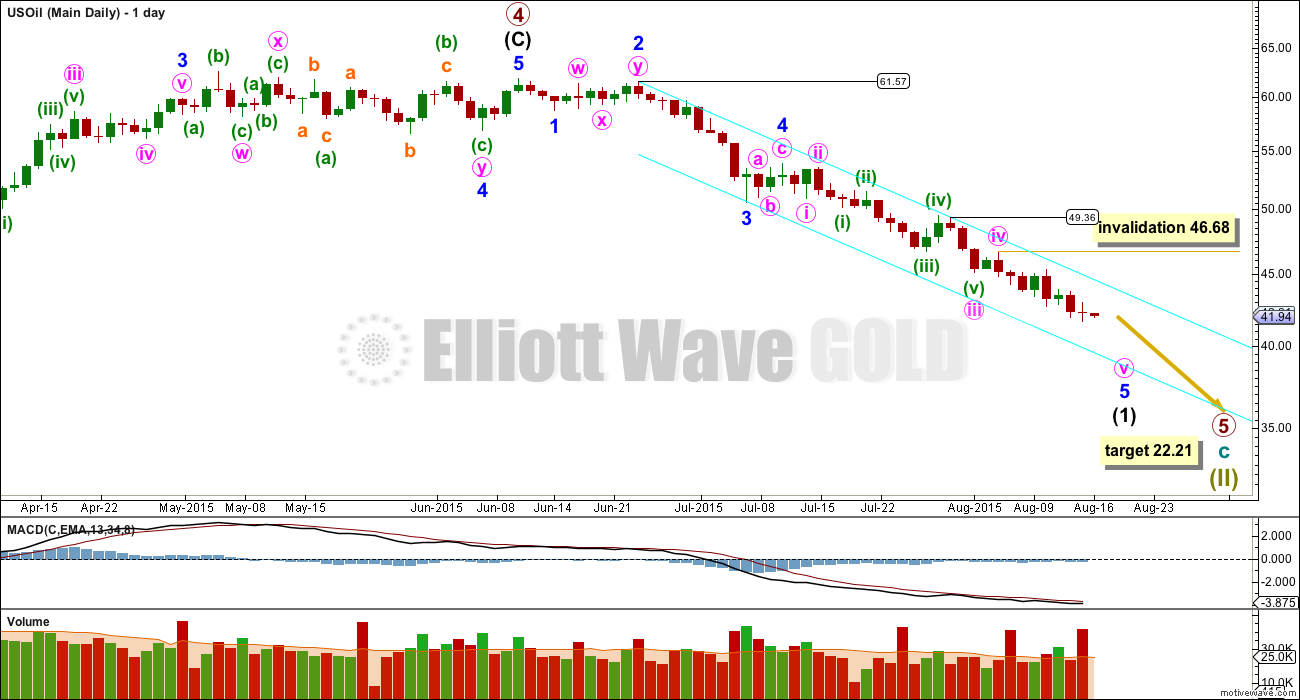
I am removing targets for intermediate wave (1); I will not calculate any again because I don’t think they’re going to be very useful.
The last wave down at primary degree for US Oil moved lower with little interruption to the trend for the entire seven months, or 162 trading days. Within primary wave 3, intermediate wave (1) lasted only four days and intermediate wave (4) (a more time consuming shallow triangle) lasted only six days. Neither of these corrections moved price above the downwards sloping channel. The channel about primary wave 3 was breached to the downside, not the upside. So providing targets for intermediate wave (1) may give a false illusion of an expectation of a big correction for intermediate wave (2) which may never come, or may have already come and gone.
Along the way down, the analysis of the waves within primary wave 5 may change as more structure unfolds.
The bright aqua blue channel is a best fit, drawn in the same way on both this daily chart and the technical analysis chart below. Draw the first trend line (on a semi log scale) from the two highs as labelled, then place a parallel copy on the low of minor wave 3 to contain all this movement. Upwards corrections are very likely to find resistance at the upper edge of the channel. The lower edge of the channel may be breached, and if it is, then expect momentum to continue to increase downwards.
Primary wave 5 is likely to be stronger in downwards momentum than primary wave 3 was. So far it has not shown an increase beyond that seen for primary wave 3 (off to the left of the chart now), and so a further increase in downwards momentum is expected.
At 22.21 primary wave 5 would reach 0.618 the length of primary wave 3.
TECHNICAL ANALYSIS
Click chart to enlarge.
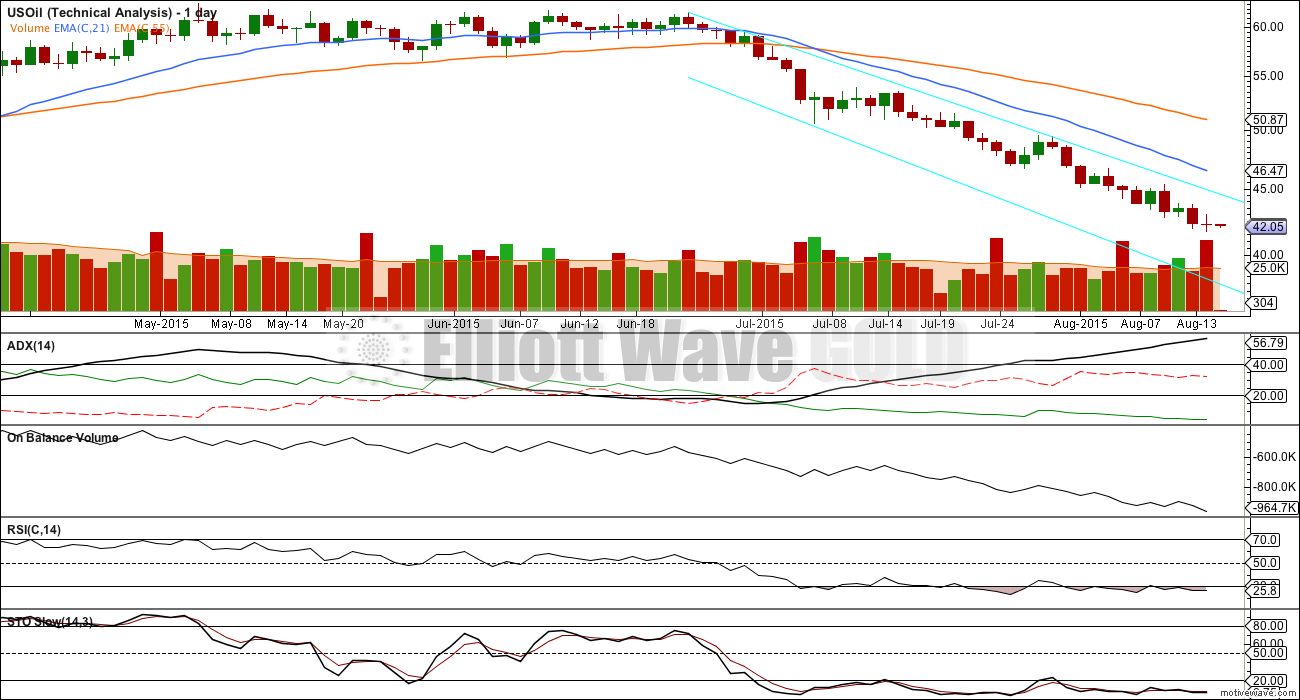
ADX is again clear; there is a trend, which is down and strengthening.
To see what we may expect for primary wave 5, we may look at US Oil behaviour for primary wave 3. That began on 13th June, 2014, and ended on 28th January, 2015.
ADX reached to over 70 during primary wave 3. RSI first reached oversold on 19th August, 2014, then dipped below oversold twice again, and the last time to remain oversold was from 27th November, 2014, to 15th January, 2015. At the end of primary wave 3, there was strong persistent divergence between RSI and price. On Balance Volume showed single divergence only right at the end of primary wave 3 in the final four days.
So far within primary wave 5, ADX is over 55. There is still room for this trend to continue to strengthen.
RSI is beginning to show oversold. This can be sustained by US Oil for long periods of time. However, in the last six days there is some positive divergence between RSI and price; while price has been moving lower RSI has been moving higher. This indicates a small correction against the trend may be due to unfold.
This positive divergence can be seen back within primary wave 3 also. There it was resolved by short corrections against the trend to bring RSI back into normal. The trend then resumed.
There is no divergence between price and On Balance Volume. While price moves lower, OBV also moves lower. OBV is not indicating an end to this downwards trend yet.
The strongest and simplest piece of technical analysis on both daily charts is the bright aqua blue trend channel. Only if the upper edge of the channel is breached would the downwards trend possibly be over. While price continues to find resistance at that trend line the downwards trend should be assumed to be intact.
Volume has increased for the last two downwards days. This fall in price is supported by volume.
The trend is your friend. The use of stops is still essential, and good money management is still required to avoid wiping out your account. Although a trending market is easier to make profits in than a range bound market, it is still possible to have a loss while trading with the trend (because price does not move in a straight line). It must be accepted that losses are possible, so management of risk is essential to ensure they are not too many or too great. Stops may be set using Elliott wave invalidation points; they may be set a little above the trend line of resistance (small overshoots are acceptable); or they may be set at the last swing high. Trading against the trend or trying to pick a low is strongly not recommended.
This analysis will only now be updated if the upper trend line showing resistance is clearly breached by a full daily candlestick above and not touching the upper trend line.
This analysis is published about 01:48 a.m. EST.
If the decline is Cycle wave c of Supercycle wave (II) rather than Cycle wave a (which is entirely possible) then the $10.35 Cycle wave IV low (I’m using the 1998-99 low as wave IV and the subsequent rise into the 2008 high as wave V of Supercycle wave (I)) would be a common level for c of (II) to test since it’s common for corrections to register their maximum retracement near the end of the previous fourth wave of one lesser degree (i.e., wave IV). What are your thoughts on this price target?
Looks like oil is out of the trendline, which implies correction. Is $48 a reasonable target to get in short?
I have US Oil still well within it’s channel. I entered a short yesterday and I plan on continuing to hold it for days / weeks while price remains within the channel. I’ll move my stop to just below my entry point today to reduce risk to zero.
As I said in the analysis, I’ll not update it while price remains in the channel because there’s nothing new to say. I’ll just ride the trend while it continues.
Strong oil comments by best selling trends analysis author Harry Dent–looking for short term bounce then down to 32. Oil comments begin at 8:00.
https://www.youtube.com/watch?v=_Ic1iD9SNog
US OIL quarterly chart attached.
US oil is at multi year support. Rambus just published WTIC quarterly chart.
Once Lara updates new wave report for US oil in near future time to entr short.
I will not be updating this US Oil analysis while price remains within the channel. There is no need. The wave count has not changed at all. The target remains exactly the same.
I have noticed that US Oil is currently showing a nice pattern: it has a down day with a volume spike and exactly two days later it has two days of upwards movement. And then the downwards trend continues.
Right now, two days ago there was a downwards day with a volume spike for 14th August. Yesterday and today it’s moving higher. That’s probably it for US Oil.
I may decide to jump in here for a short on this market.
All needs to be done for a correction in oil is for me to take a position here in SCO or DWTI bear etf.
Oil will turn up in heart beat. That has been the story of my life and why it will not happen again??????? LOL!!!
I have been waiting for correction my patience!!!!
Thanks for update.
Papudi, what you mentioned rings a familiar bell. I am sure all of us have experienced it one way or the other. But for some, it has become a habit.
It is a paradox in life. The more carefully and accurately you analyse the situation, the more likely something will throw a spanner in the works. Call it Murphy’s Law if you will. I do find it quite contradictory that those investors who are gungho and trade with reckless abandon appear to do better. Wonder whether the law of averages do catch up with them. A philosphical thought indeed.
Lara,
Thank you , nice analysis.
You’re welcome.