
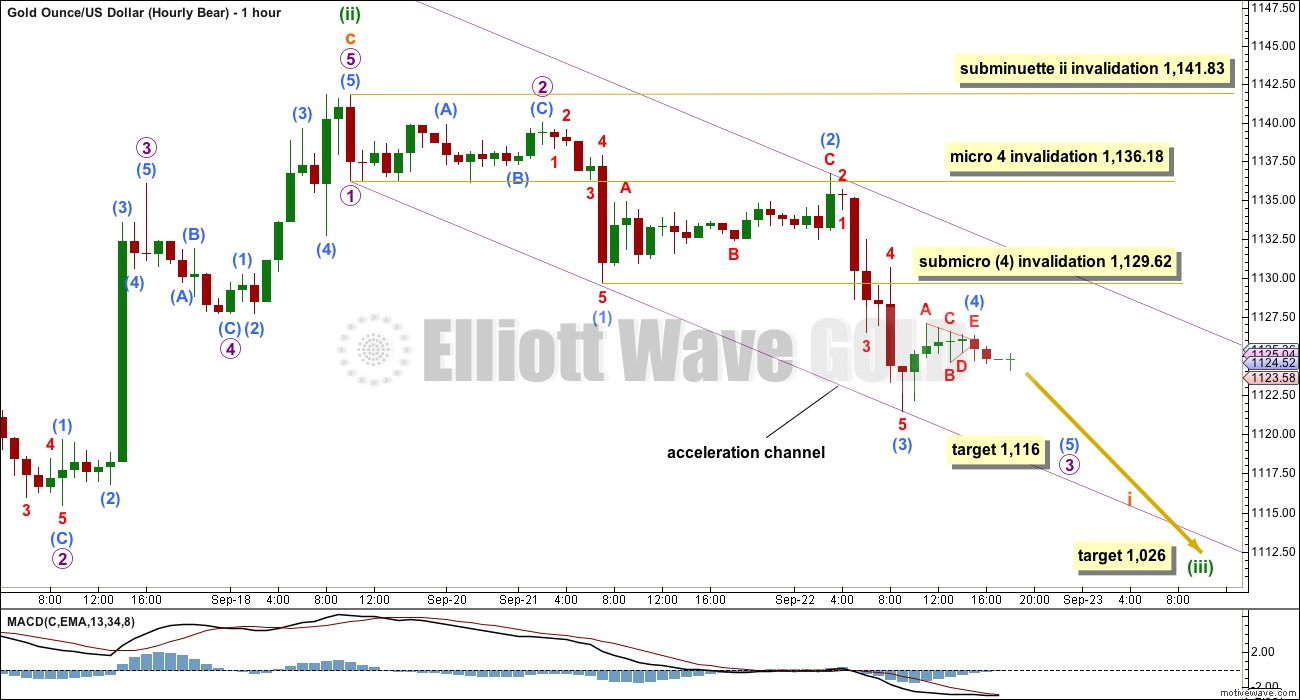
Downwards movement favours the bear wave count, but is not enough for confirmation.
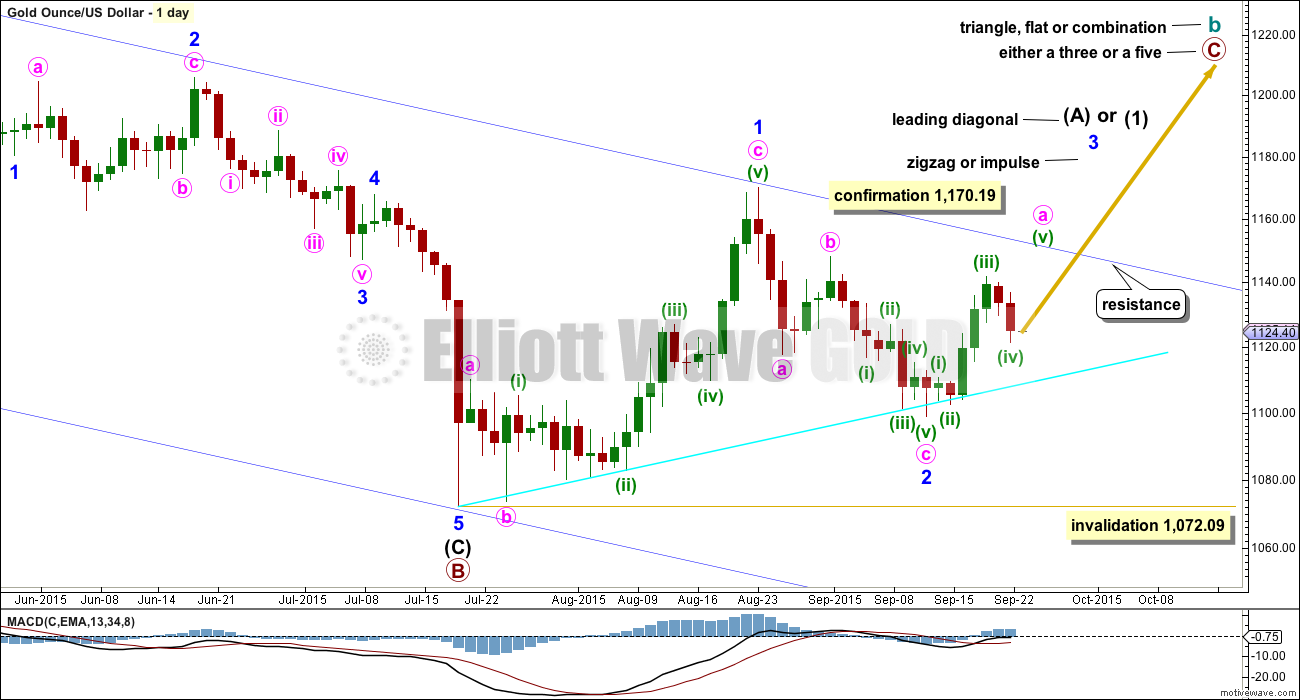
The bull wave count remains valid.
Summary: Short term both wave counts expect a little more downwards movement to 1,116. Thereafter, both expect some upwards movement: the bear for a fourth wave correction which may not move above 1,136.18 and the bull to make new highs. A new high above 1,141.83 is required for confidence in the bull, while a new low below 1,108.62 would provide some confidence in the bear at this stage.
Changes to last analysis are bold.
To see the bigger picture on weekly charts click here.
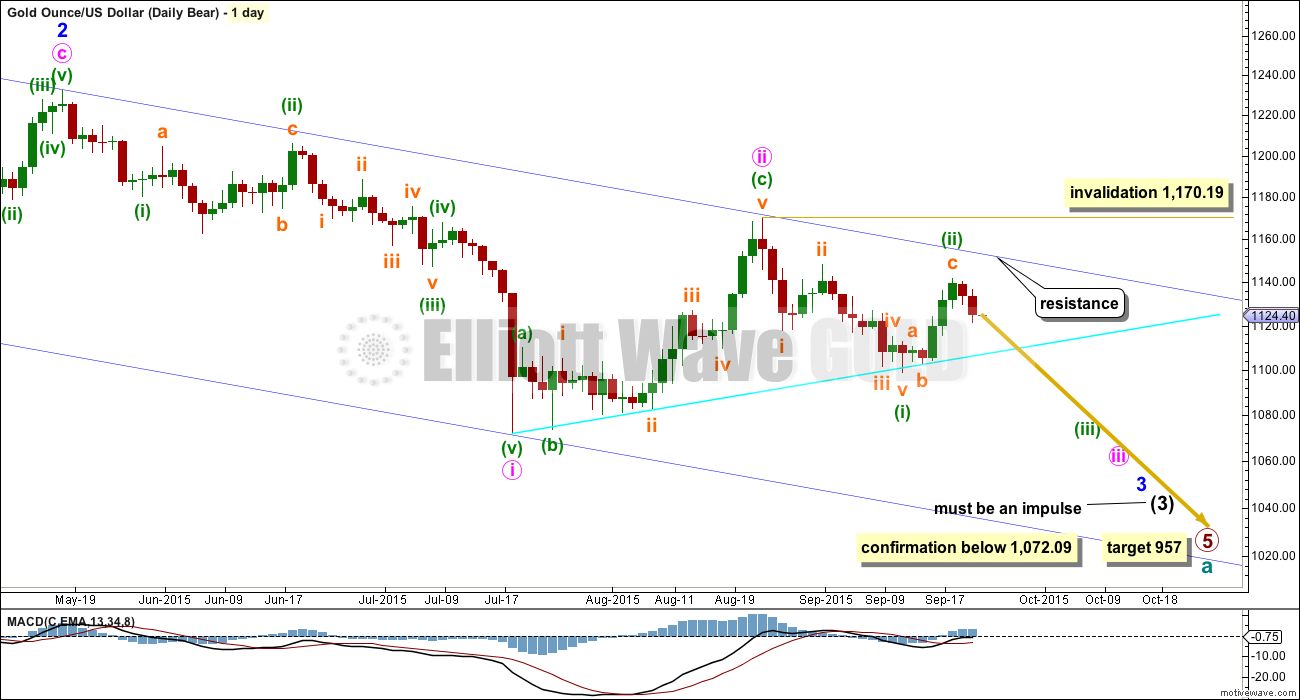
BEAR ELLIOTT WAVE COUNT
Click chart to enlarge.
Gold has been in a bear market since September 2011. There has not yet been confirmation of a change from bear to bull, and so at this stage any bull wave count would be trying to pick a low which is not advised. Price remains below the 200 day moving average and below the blue trend line (copied over from the weekly chart). The bear market should be expected to be intact until we have technical confirmation of a big trend change.
This wave count now sees a series of four overlapping first and second waves: intermediate waves (1) and (2), minor waves 1 and 2, minute waves i and ii, and now minuette waves (i) and (ii). Minute wave iii should show a strong increase in downwards momentum beyond that seen for minute wave i. If price moves higher, then it should find very strong resistance at the blue trend line. If that line is breached, then a bear wave count should be discarded.
The blue channel is drawn in the same way on both wave counts. The upper edge will be critical. Here the blue channel is a base channel drawn about minor waves 1 and 2. A lower degree second wave correction should not breach a base channel drawn about a first and second wave one or more degrees higher. If this blue line is breached by one full daily candlestick above it and not touching it, then this wave count will substantially reduce in probability.
Minuette wave (ii) may not move beyond the start of minuette wave (i) above 1,170.19. A breach of that price point should see this wave count discarded as it would also now necessitate a clear breach of the blue channel and the maroon channel from the weekly chart.
Downwards movement from 1,170.19 will subdivide as a complete five wave impulse on the hourly chart, but on the daily chart it does not have a clear five wave look. Subminuette wave iii has disproportionate second and fourth waves within it giving this movement a three wave look on the daily chart.
Full and final confirmation of this wave count would come with a new low below 1,072.09.
If primary wave 5 reaches equality with primary wave 1, then it would end at 957. With three big overlapping first and second waves, now this target may not be low enough.
Click chart to enlarge.
An impulse is unfolding downwards and the structure is incomplete. At 1,116 micro wave 3 would reach 4.236 the length of micro wave 1 and submicro wave (5) would reach equality in length with submicro wave 1. This target calculated at two wave degrees has a reasonable probability.
When micro wave 3 is a complete impulse then micro wave 4 should unfold upwards and / or sideways. Micro wave 2 was a deep 0.68 zigzag and it does not show up on the daily chart. Micro wave 4 may be a shallow flat, combination or triangle and it too should not show up on the daily chart. It should be complete lasting up to 24 hours, but not longer. It may not move into micro wave 1 price territory above 1,136.18.
Draw an acceleration channel about this downwards movement, and as price makes new lows keep redrawing the channel. Draw the first trend line from the end of micro wave 1 to the last low, then place a parallel copy on the high of submicro wave (2) so that all downwards movement is contained. Micro wave 4, when it arrives, may find resistance at the upper edge of the channel.
This bear wave count expects to see another red candlestick for Wednesday’s session.
The target for minuette wave (iii) is still at least a week and maybe up to three or four weeks away. At 1,026 it would reach 1.618 the length of minuette wave (i).
Along the way down, a new low below 1,108.62 would provide some confidence in this bear wave count. At that stage, the bull wave count would be invalidated at the hourly chart level.
BULL ELLIOTT WAVE COUNT
Click chart to enlarge.
The bull wave count sees cycle wave a complete and cycle wave b underway as either an expanded flat, running triangle or combination. This daily chart works for all three ideas at the weekly chart level.
For all three ideas, a five up should unfold at the daily chart level for a movement at primary degree. This is so far incomplete. With the first wave up being a complete zigzag the only structure left now for intermediate wave (1) or (A) would be a leading diagonal. While leading diagonals are not rare they are not very common either. This reduces the probability of this bull wave count.
A leading diagonal requires the second and fourth waves to subdivide as zigzags. The first, third and fifth waves are most commonly zigzags, the but sometimes may appear to be impulses. So far minor wave 1 fits well as a zigzag.
Minor wave 2 may not move beyond the start of minor wave 1 below 1,072.09. If this invalidation point is breached, then it would be very difficult to see how primary wave B could continue yet lower. It would still be technically possible that primary wave B could be continuing as a double zigzag, but it is already 1.88 times the length of primary wave A (longer than the maximum common length of 1.38 times), so if it were to continue to be even deeper, then that idea has a very low probability. If 1,072.09 is breached, then I may cease to publish any bullish wave count because it would be fairly clear that Gold would be in a bear market for cycle wave a to complete.
To the upside, a new high above 1,170.19 would invalidate the bear wave count and provide strong confirmation for this bull wave count.
Upwards movement is finding resistance at the upper edge of the blue channel and may continue to do so. Use that trend line for resistance, and if it is breached, then expect a throwback to find support there.
I added a bright aqua blue trend line to this chart. Price has found support there and is bouncing up.
Minor wave 2 can now be seen as a complete zigzag. It is 0.73 the depth of minor wave 1, nicely within the normal range of between 0.66 to 0.81 for a second wave within a diagonal.
Third waves within leading diagonals are most commonly zigzags, but sometimes they may be impulses. Minor wave 3 should show some increase in upwards momentum beyond that seen for minor wave 1. Minor wave 3 must move above the end of minor wave 1 above 1,170.19. That would provide price confirmation of the bull wave count and invalidation of the bear.
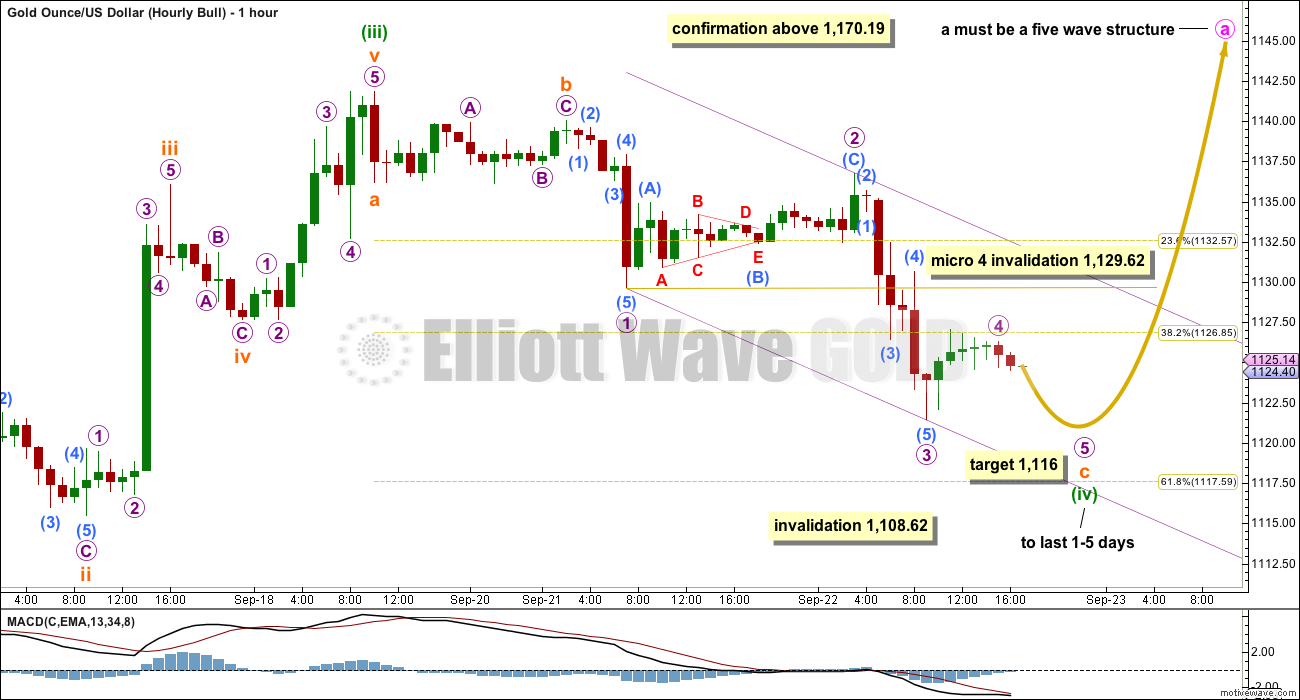
Click chart to enlarge.
Minor wave 3 is most likely to subdivide as a zigzag. Within a zigzag, minute wave a must subdivide as a five wave structure.
Minute wave a would be an incomplete five wave impulse at this stage.
Minuette wave (ii) shows up on the daily chart and lasted two days. Minuette wave (iv) is most likely to also show up on the daily chart, for the five wave impulse of minute wave a to have the right look on the daily chart, and it may last 1-5 days.
Minuette wave (ii) is seen as an expanded flat for this bull wave count.
Minuette wave (iv) is not contained within a channel drawn about minute wave a using Elliott’s first technique. Sometimes fourth waves breach the channel which is why Elliott developed a second technique to redraw the channel when they do.
Minuette wave (iv) is unfolding as a zigzag which provides structural alternation with the flat of minuette wave (ii). So far the structure of this zigzag is incomplete and needs a final fifth wave down.
At 1,116 subminuette wave c would reach 4.236 the length of subminuette wave a. Also exactly at 1,116 micro wave 5 would reach equality in length with micro wave 1. The target is the same for both wave counts because A-B-C of a zigzag and 1-2-3 of an impulse subdivide in exactly the same way.
Minuette wave (iv) may not move into minuettte wave (i) price territory below 1,108.62.
TECHNICAL ANALYSIS
Click chart to enlarge. Chart courtesy of StockCharts.com.
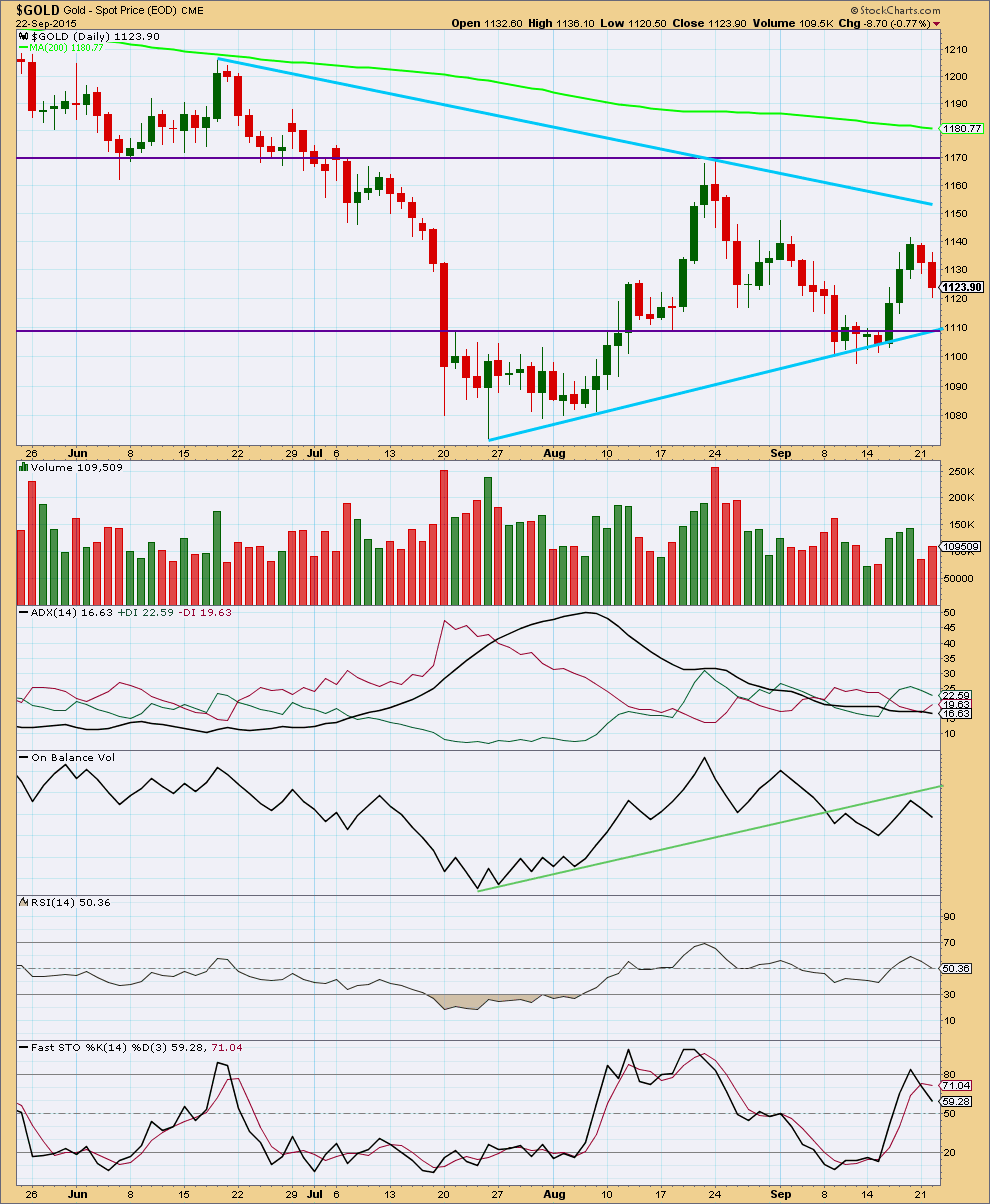
Daily: A stronger red candlestick on increased volume is bearish. The fall in price is supported by volume which favours the bear wave count.
In the last 20 days, it is four downwards days which have strongest volume and this may indicate a downwards trend is still intact. The volume profile is giving mixed signals.
Overall, from the last swing high at 1,170 on 24th August, as price falls it comes on declining volume. There is some small support for the fall in price: each wave down has increasing volume, but the whole movement from its start has overall declining volume. The picture remains unclear.
ADX is flat indicating there is no clear trend and the market is range bound. If a range bound system is used here, then it would expect an upwards swing to continue because price has reached to the lower horizontal line of support and Stochastics has reached oversold. However, trading a range bound market is more risky than trading a clearly trending market. The final swing never comes; that is when price breaks out of the range and begins a trend. An upwards swing may still possibly be continuing at this stage and would be expected to only end when price reaches resistance and Stochastics is overbought at the same time. While the Elliott wave bear count remains valid the risk that a bear market may still be intact must be acknowledged. Good money management on any bullish trades is essential.
On Balance Volume has found resistance at the green trend line and moved lower from there. The strength of that line is reinforced. OBV may yet move up again to touch the line; this would allow for more upwards movement which the bull wave count expects. Equally as likely OBV may continue lower from here as the bear wave count expects.
RSI at the daily chart level is neither overbought or oversold. There is room for the market to rise or fall.
Overall the regular technical analysis picture remains unclear.
This analysis is published about 06:57 p.m. EST.
The wave count will change on the hourly chart for both bull and bear to see a complete leading expanding diagonal, followed now by a deep second or B wave.
The focus today will be on whether or not the second or B wave can be complete. In other words, is there going to be more upwards movement or is it done here.
The problem I have right now is there is an overlap between the first and fourth waves within the C wave of this upwards zigzag. It could be an ending expanding diagonal…. but here there is a problem in that it’s fifth wave looks very much like a five wave impulse and ending diagonals require all sub waves to be zigzags.
So my conclusion so far is the correction is not quite over, we may see two more waves up for two fifth waves with a small fourth wave correction in the middle.
Second waves following first wave leading diagonals are usually very deep, deeper than the 0.618 Fibonacci ratio.
The invalidation point is at 1,141.83.
To the downside a new low below 1,128.45 would be earliest indication that this correction is over. That couldn’t be a fourth wave correction, it would be back in first wave price territory, and so I’d have to see submicro (C) as an ending diagonal.
I need to spend time on the five minute chart this morning to see if the upwards zigzag could be over, or not.
I figure the way to profit in miners is to master intra-day trading DUST until the bottom happens one day or one month or 1 year from now!!!
Amen!!!!!!
Very strange from the 9:30 open to 3:00 pm Gold down $3 and DUST up $3.
There was a $10 increase in Gold from Tuesday close to Wednesday open and heavy volume of buying this morning moved GDX up from 13.36 close to 13.64 at the open.
Also large sell off of DUST this morning moved DUST down from 28.30 close to 26.62 at the open then gold gradually moved down $3 over the day and profit taking on GDX the whole day and increased volume into DUST moved DUST up $3 while Gold dropped $3 by 3:00 pm. GDX had continued momentum out and DUST had continued momentum in. Prolonged momentum really moves miners.
DUST may have already peaked for today at $28.88 at 12:10 pm
It just dropped $1 in 10 minutes.
I got dust in a fifth of a fifth, I have set my stop at 28.80.
Apparently not as DUST just made new high of 29.13 at 3:00 pm amazing.
Any wave count anyone?
Any upper target for DUST?
My upper target for DUST is 29.52.
Bought it today after the first retrace at 27.00 and sold it 45 minutes ago at 29.00. Caught the third wave today. Most likely it will be taking its time in the fourth wave before a final thrust tomorrow. But I’m not going to dice it. It may reach the target pre-market then gap down. Better take the money while the going is good.
After reaching the final target, the path then diverges. It may either rise drastically (bear in gold) or drop significantly (bull in gold). Can’t tell yet at the moment.
Smart trading Tham. Thanks for sharing.
IMHO the 2nd wave correction, following the diagonal down, is now complete. This 2nd wave was almost a perfect .618. I believe right now is the last (best) opportunity to add to shorts.
Pretty pair of double tops at the (3) and the (5) on a 1 minute chart
Because this is a 2nd wave correction after a 1st wave diagonal, the risk remains that it can go deeper than 0.618. There is still a chance that gold has one final small 5th wave to go. Movement below 1127 would signal that this correction is over.
Unable to figure at the moment…what is the next target/fib up?
If gold moves higher for a final 5th wave, I came up with a zone of 1136-1137.50. This is based on several ratios.
I agree. For the bear the only scenario which makes sense now is a leading expanding diagonal followed by a now deep second wave.
Leading diagonals aren’t very common, and leading expanding diagonals are less common still. But that’s what it is.
For the bull wave count I’ll have to see this as a-b-c, with b now complete and c down still to come.
I have to look back over your old analysis, but didn’t gold start downward movement with expanding diagonals from the January high, as well as the May high? Those diagonals, if that’s what they were, were at larger daily levels. I am just thinking that they are not as rare as you say. Moreover, if these were not diagonals in Jan and May, they sure looked like them and were soon followed by more movement.
Here’s the hourly chart from 29th Jan. Yes, you’re right, it was a leading diagonal. But it was contracting.
The move down from the May high was an impulse.
My problem the last two days was that the diagonal would be expanding. It’s expanding leading diagonals which aren’t common. The overlapping 1-2, 1-2 is more common.
But what I should have done is present an alternate chart, and state it had a lower probability because the expanding variety of diagonal isn’t so common.
I have dust in a 4th wave with a retrace target of 26.3-25.6. Will be looking to get in there.
Out of JDST yesterday and today at about $1.60/gain. Thanks Lara!
Scalping JNUG right now.
Lara, when you get a chance, I was looking forward to your comments/analysis of Edward’s proposal from the other day. Is his labeling breaking any rules?? I thought it was an awesome perspective he had.
http://elliottwavegold.com/2015/09/gold-elliott-wave-technical-analysis-18th-september-2015/#comment-46468
Thanks for taking a look.
Wow, thanks for the complement, Awesome is a cycle degree label around here.
Let me do some of the easy work for Lara and she can concentrate on “The Right Look” aspect of my “What If”
You’re right. A leading diagonal may not have a truncated fifth wave.
If you’re entertaining a wave count which violates Elliott wave rules, then it’s not Elliott wave.
The rules are black and white (with the sole exception of the end of a D wave in relation to the B wave within a barrier triangle)
I understand and agree
I know it’s frustrating when you see an idea that’s so close and the rule is only broken by a little bit.
That rule of the overlap between first and fourth waves is the one people like to break the most I think. But I’ve learned the hardest way possible, meet the rules. All of them all the time. Otherwise the market will prove your idea wrong and you’ll regret it.
When I was learning to fly, there was a stack of books that I had to memorise. An entire book was dedicated to rules and regulations. At the back of the book was a disclaimer, In a life threatening situation, all of these rules and regulations may be violated. The right look is really threaten here
and
I agree, that fourth wave triangle doesn’t look right. Here’s a trick: often (not always) when triangles unfold MACD hovers about zero. Zoom in on the daily chart, what does MACD do for that move?
You’d really need to check the subdivisions of the middle of that third wave. It may only be an impulse. You’d have to go down to the hourly chart level to do it. I’m not sure that will work.
If there’s a simpler explanation then go with the simple explanation. Simple is better. If it has a better overall look and fit then it’s more likely to be correct. What you have here doesn’t fit well, it’s not simple.
Take another look at how you’ve labelled A and B within D of your triangle. There is an amazing nine wave triangle in there for the B wave. Look at MACD while it unfolded. Sometimes structures will jump out at you, that’s a good example. Look how MACD flattened off while it unfolded – not quite on zero but it was very flat.
the deal breaker
LOL
You’re right. It fails the “what would Lara say test”.
The wave count is invalid. When A is a three and B is a three then the structure is a flat. B must be 90% of A minimum. In that idea the B wave is well less than 90% of the A wave.
Also, within your minor wave A there is actually an overlap between minute i and minute iv. You have to put the label for minute i up on the green candlestick to the left of where you have it. Because that is where the upwards wave ended, you can see it on a lower time frame. So that means the fourth wave overlaps first wave price territory.
Even if you try to see a diagonal there it won’t work, the wave lengths don’t meet the rules for a contracting diagonal.
The thing about Elliott wave rules is they are black and white. There will only be one correct wave count. If you’re going to break the rules, you’ll never find it.
The rules must be met, and the wave count which has the highest probability will be the one which also meets the most guidelines and has the “right look”.
I’m looking at Edwards wave count he posted on the 18th. I’ll make comments there.
Thank you Lara for looking at this. I enjoyed your and Edward’s dialog. It was also informative. A side note here, on his original chart he noted something I’d never heard of before (Bradley Turn Dates) and here again I’m thankful to continue learning. 🙂
hi ds, that was certainly an exhausting conversation, i’m glad you were following it. I know my working charts are the better for it this morning.
That “what if” last weekend was a second alternate. Pretty, but dangerous and heretical. Still the ramifications of it being the true state of play in the real world are significant enough to warrant the question.
Bradley turn dates are astro stuff, plus or minus a day or 2. Basically it says what ever direction something is traveling in will reverse.
DUST and GDX combined on one chart shows both price drops and DUST decay.
https://www.dropbox.com/s/818h03vaptzthhr/DUST.png?dl=0
I’ve just been warned by a pro trader that Wednesday the markets may drop hard.
Minutes later I found this headline and Oil has already dropped.
WTI oil futures CLX5, -0.50% fell 50 cents to $46.13.
Not sure the effect this may have on gold. Be careful.
Stock futures tumble in wake of weak China data – Sept 23, 2015 12:57 a.m. ET
http://www.marketwatch.com/story/stock-futures-tumble-in-wake-of-weak-china-data-2015-09-23
Data showing a preliminary measure of Chinese factory output in September at the lowest since the financial crisis.
Matt, are you still tracking an expanding diagonal?
The diagonal, which completed earlier today, seems viable to me. However, if there is a new low within the next few hours then I will instead fully embrace the hourly bear count in today’s analysis.
If the diag works out could you please check a fib ratio
(start of 2 to end of 5) = (start of 1 to end of 3)
also the rebound might be equal
thanks
o7
These two were not equal. One was .81 of the other. Either way, looks like a C wave up may be underway. I believe this is wave 3 of 5 within C.
Just wondering if this daily from 2004 is a smaller fractal of our current bear. I’ve boosted the labels up to make the connection and I’ve clearly got the 100% thing wrong, but if some one could find the same pattern in an hourly chart with similar ratios…