
Both Elliott wave counts expected overall downwards movement to begin the new week.
Summary: The bear wave count expects downwards movement to about 1,121 to complete a five wave impulse, to be followed by a three wave correction upwards which may not move above 1,156.83. The bull wave count now expects upwards movement from here and would have some confirmation with a new high above 1,156.83.
Changes to last analysis are bold.
To see the bigger picture on weekly charts click here.
BEAR ELLIOTT WAVE COUNT
Click chart to enlarge.
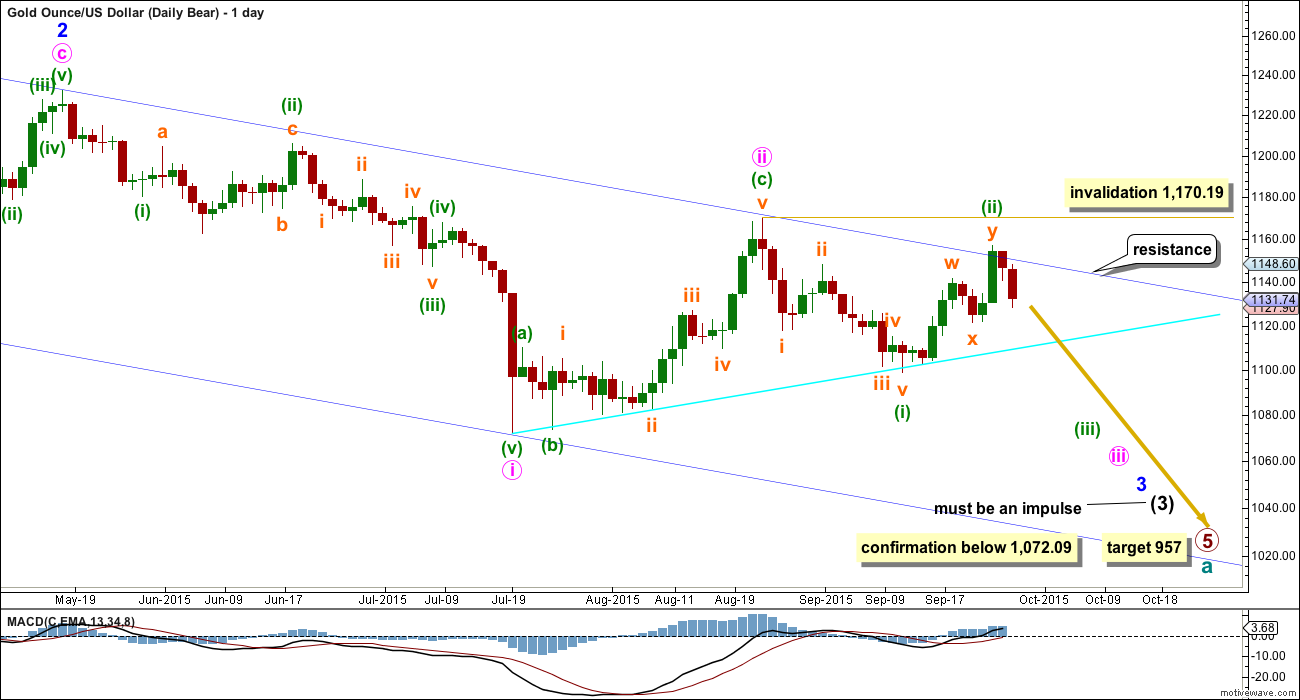
Gold has been in a bear market since September 2011. There has not yet been confirmation of a change from bear to bull, and so at this stage any bull wave count would be trying to pick a low which is not advised. Price remains below the 200 day moving average and below the blue trend line (copied over from the weekly chart). The bear market should be expected to be intact until we have technical confirmation of a big trend change.
This wave count now sees a series of four overlapping first and second waves: intermediate waves (1) and (2), minor waves 1 and 2, minute waves i and ii, and now minuette waves (i) and (ii). Minute wave iii should show a strong increase in downwards momentum beyond that seen for minute wave i. If price moves higher, then it should find very strong resistance at the blue trend line. If that line is breached, then a bear wave count should be discarded.
The blue channel is drawn in the same way on both wave counts. The upper edge will be critical. Here the blue channel is a base channel drawn about minor waves 1 and 2. A lower degree second wave correction should not breach a base channel drawn about a first and second wave one or more degrees higher. If this blue line is breached by one full daily candlestick above it and not touching it, then this wave count will substantially reduce in probability.
Minuette wave (ii) may not move beyond the start of minuette wave (i) above 1,170.19. A breach of that price point should see this wave count discarded as it would also now necessitate a clear breach of the blue channel and the maroon channel from the weekly chart.
Downwards movement from 1,170.19 will subdivide as a complete five wave impulse on the hourly chart, but on the daily chart it does not have a clear five wave look. Subminuette wave iii has disproportionate second and fourth waves within it giving this movement a three wave look on the daily chart.
Minuette wave (ii) will subdivide as a double zigzag, but it has a five wave look on the daily chart, not a three. Both the wave down labelled minuette wave (i) and the wave up labelled minuette wave (ii) have a better fit and look for the bull wave count than the bear at the daily chart level.
Gold has the most textbook looking structures and waves of all the markets I have analysed over the years, probably due to the high volume of this global market. And so I am quite concerned with the look of minuette waves (i) and (ii). Sometimes Gold has movements which don’t look perfect on the daily chart, but this is uncommon.
Sometimes Gold’s impulse waves start out slowly. There is a good example on this daily chart for minute wave i. When the fifth wave approaches that is when momentum sharply increases, and it often ends on a price shock with a volume spike. This is an even more common tendency for Gold’s third wave impulses. The strongest downwards movement is ahead, and it should be expected to arrive when subminuette wave v within minuette wave (iii) begins.
Full and final confirmation of this wave count would come with a new low below 1,072.09.
If primary wave 5 reaches equality with primary wave 1, then it would end at 957. With three big overlapping first and second waves, now this target may not be low enough.
Click chart to enlarge.
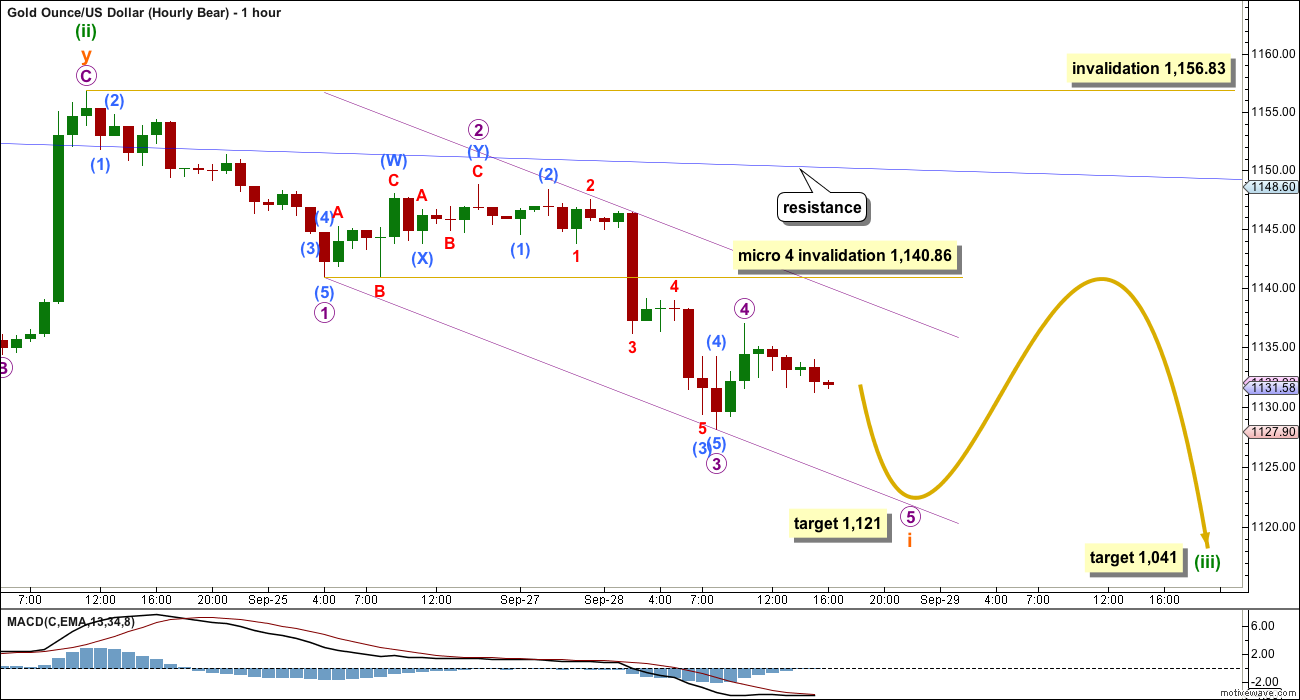
So far an incomplete five wave structure downwards has unfolded. If micro wave 4 is over as labelled as a quick zigzag, then at 1,121 micro wave 5 would reach equality in length with micro wave 1. This would complete a five down.
Micro wave 4 may be over as labelled, or it may move sideways as a triangle or flat correction. It may also move higher as a double zigzag. Micro wave 2 subdivides best as a double combination, so to exhibit alternation micro wave 4 is most likely to be a zigzag but may also be a triangle or flat. Micro wave 4 may not move into micro wave 1 price territory above 1,140.86.
When subminuette wave i is a complete impulse then subminuette wave ii should unfold upwards. It may last about one to three days and may show up on the daily chart with one or more green candlesticks or doji. Subminuette wave ii may not move beyond the start of subminuette wave i above 1,156.83.
Draw a channel about subminuette wave i: draw the first trend line from the ends of micro waves 1 to 3, then place a parallel copy higher up to contain all this movement. When that channel is breached by upwards movement that shall indicate subminuette wave i would be complete and subminuette wave ii would be underway.
BULL ELLIOTT WAVE COUNT
Click chart to enlarge.
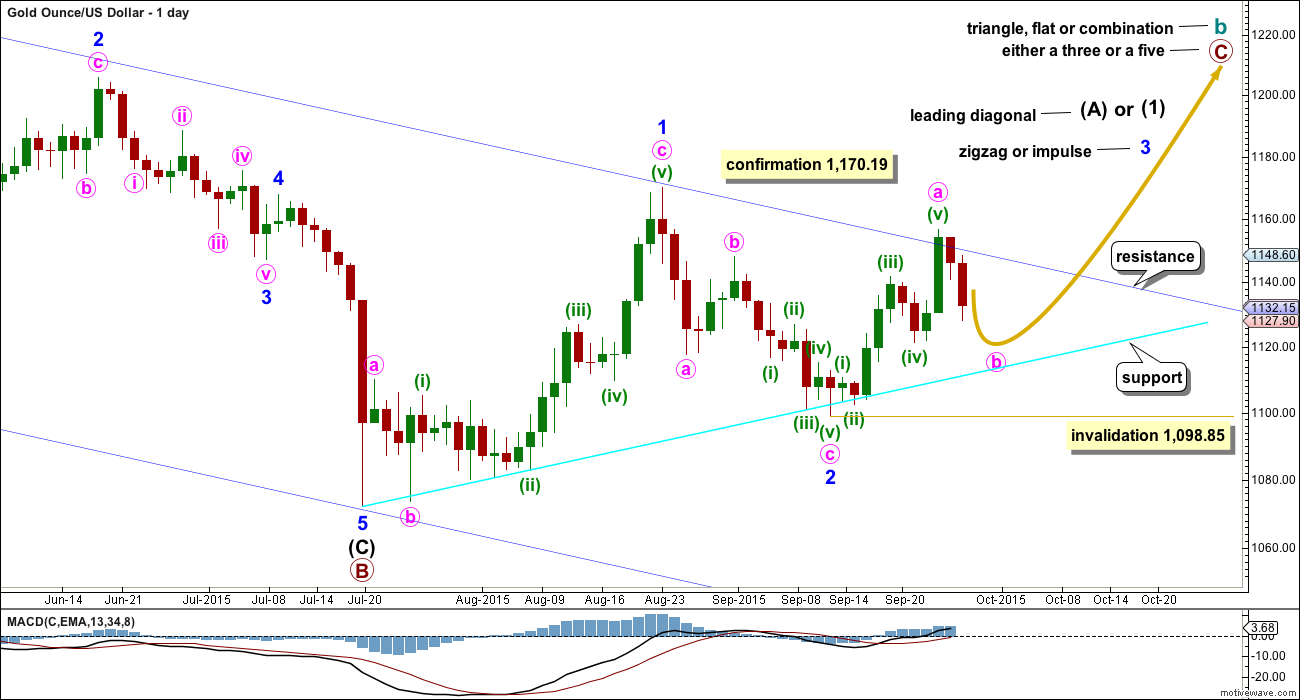
The bull wave count sees cycle wave a complete and cycle wave b underway as either an expanded flat, running triangle or combination. This daily chart works for all three ideas at the weekly chart level.
For all three ideas, a five up should unfold at the daily chart level for a movement at primary degree. This is so far incomplete. With the first wave up being a complete zigzag the only structure left now for intermediate wave (1) or (A) would be a leading diagonal. While leading diagonals are not rare they are not very common either. This reduces the probability of this bull wave count.
A leading diagonal requires the second and fourth waves to subdivide as zigzags. The first, third and fifth waves are most commonly zigzags, the but sometimes may appear to be impulses. So far minor wave 1 fits well as a zigzag.
To the upside, a new high above 1,170.19 would invalidate the bear wave count and provide strong confirmation for this bull wave count.
Upwards movement is finding resistance at the upper edge of the blue channel and may continue to do so. Use that trend line for resistance, and if it is breached, then expect a throwback to find support there.
I added a bright aqua blue trend line to this chart. Price has found support there and is bouncing up.
Minor wave 2 can now be seen as a complete zigzag. It is 0.73 the depth of minor wave 1, nicely within the normal range of between 0.66 to 0.81 for a second wave within a diagonal.
Third waves within leading diagonals are most commonly zigzags, but sometimes they may be impulses. Minor wave 3 should show some increase in upwards momentum beyond that seen for minor wave 1. Minor wave 3 must move above the end of minor wave 1 above 1,170.19. That would provide price confirmation of the bull wave count and invalidation of the bear.
There now looks like a five up on the daily chart within minor wave 3. This may be minute wave a within a zigzag, or it may also be minute wave i within an impulse. The five up may be seen as complete at this stage, so a three down would be expected for this bull wave count. Minute wave b may not move beyond the start of minute wave a below 1,098.85. Minute wave b may find support at the lower bright aqua blue trend line, if it gets down that low.
Click chart to enlarge.
There are still 23 possible corrective structures that minute wave b may unfold as.
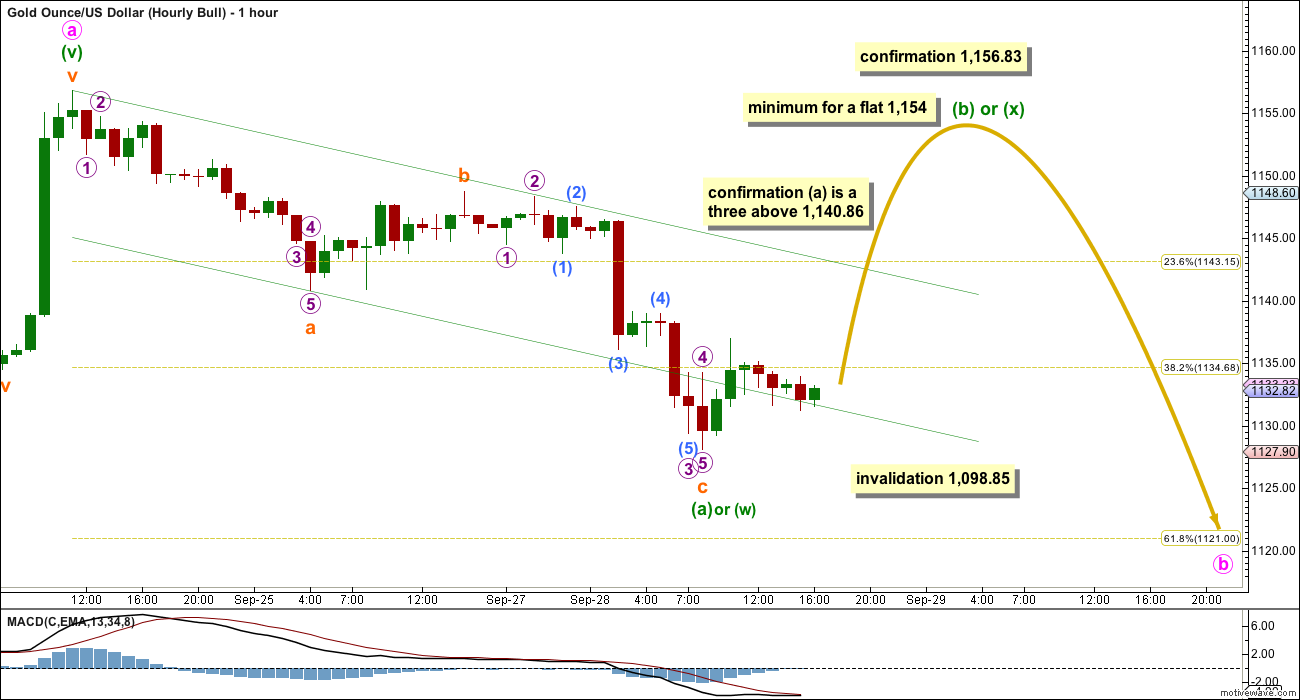
It may be a complete zigzag over at today’s low. Although this is possible, I would judge it to be unlikely because it would be shallow and very brief. It would not have a three wave look at the daily chart level.
It may be a flat correction; minuette wave (a) may be a complete zigzag. Minuette wave (b) of a flat must retrace a minimum 90% of minuette wave (a) at 1,154. Minuette wave (b) of an expanded flat may make a new price extreme beyond the start of minuette wave (a) above 1,156.83.
It may be a double combination; the first structure may be a complete zigzag labelled minuette wave (w). There is no minimum requirement for an X wave within a combination, and it too may make a new high above the start of minuette wave (w) at 1,156.83. The second structure in a combination may be either a flat or a triangle.
It may be a double zigzag; minuette wave (w) may be complete as the first zigzag. Minuette wave (x) would most likely be a brief shallow zigzag and the second zigzag may unfold to move price lower towards the 0.618 Fibonacci ratio.
It may be a single zigzag; minuette wave (a) may yet make a new low to complete as a five wave impulse.
It may be a triangle; minuette wave (a) may be a complete zigzag and minuette wave (b) has no minimum requirement apart from needing to be a three. Minuette wave (b) may make a new high above the start of minuette wave (a) at 1,156.83 if a running triangle unfolds.
It is impossible to tell which pathway price may take during this B wave. It is only possible today to say that it is most likely incomplete at this stage.
In the short term, a new high above 1,140.86 (without a new low first) would indicate that the wave down labelled minuette wave (a) or (w) is a three wave structure most likely. This would slightly favour the bull wave count short term. It would eliminate only the possibility of a single or multiple zigzag for minute wave b, and leave several other structures still possible.
TECHNICAL ANALYSIS
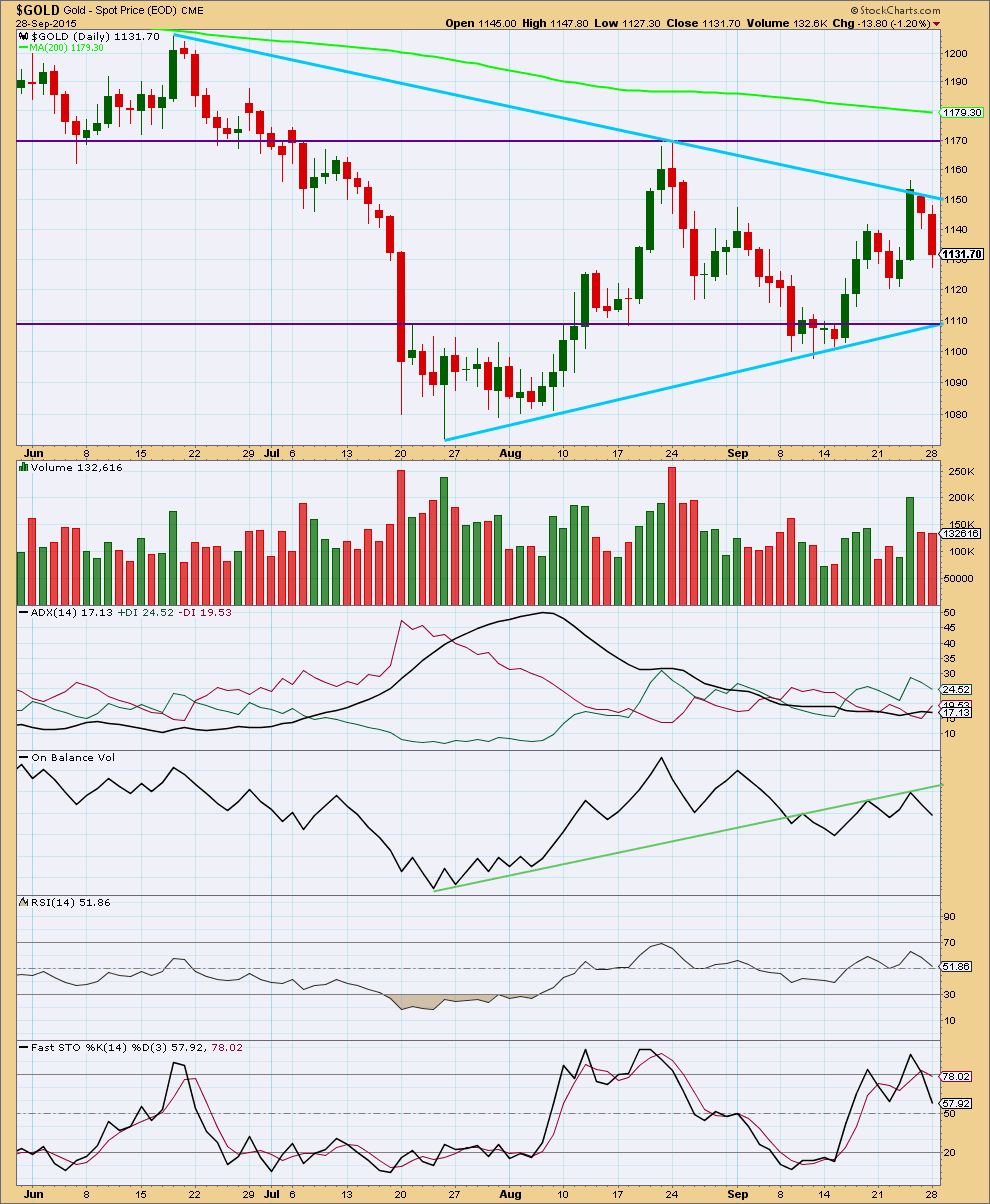
Click chart to enlarge. Chart courtesy of StockCharts.com.
Daily: Monday’s stronger downwards day comes on slightly lighter volume. The fall in price is not properly supported by volume. However, the market may fall of its own weight and so a fall in price does not necessarily have to come on a rise in volume. This chart was prepared at 4:49 EST. Volume data may be updated from StockCharts about 6:30pm EST and so may change. If the change is material to this analysis then it will be edited to show updated data.
ADX is again flat indicating there is no clear trend. During the last 36 days, while ADX has overall indicated the market is consolidating, it is still a downwards day which has strongest volume. This indicates that a downwards breakout may be more likely than upwards.
Price is being squeezed between the two blue sloping lines of resistance and support. The breakout comes closer as the consolidation matures and those lines converge. The market will begin to trend again, of that we may be sure.
A range bound system is outlined here using lines on price for resistance and support in conjunction with Stochastics to indicate overbought / oversold. Price reached resistance on Thursday and Stochastics reached overbought. This approach now expects a downwards swing to continue until price reaches support and Stochastics reaches oversold. During range bound markets, price does not move from resistance to support in straight lines but most often moves in a choppy and overlapping manner. Price may also overshoot resistance and support before one swing ends and the next begins. This is why trading a range bound market is very risky and best left to the most experienced traders. Stops and good money management are essential to ensure that losses are minimized because of whipsaws during a range bound market.
RSI at the daily chart level is neither overbought or oversold. There is room for the market to rise or fall.
Overall, at this stage, volume analysis indicates the bear wave count may be more likely than the bull.
This analysis is published about 05:27 p.m. EST.
Lara, for the bear count…. How are you going to fit sub-waves green 3, pink 3, blue 3, black 3, et-all.. so that they fit without overlapping each respective wave 4 into wave 1 territory and squeeze this all in before your primary target of $957? Is this even possible?
Dust will be before close higher than Monday’s 27.38 and then GDX will be at it’s low for today.
Gold is still lower than yesterday but DUST dropped early today when gold went up.
Then gold went down and stayed down lower than yesterday but DUST stalled.
Since 2:30 PM DUST got bullish in multiple time frames and flying up as gold is lower than Monday so DUST will rise above Monday DUST before close.
However may drop before the close.
Is 1124.42 low at 5:35 am today the end of micro wave 5 the bottom of subminuette wave i on the way down?
1126.28 at 1:53 pm looks like an important low may be the bottom of 2nd wave down in subminuette way ii on the way up?
Any wave count or comment anyone?
Yes, the fifth wave now looks complete. It subdivides nicely as a five wave impulse.
I would now expect choppy overlapping upwards movement for a correction for about 1-3 days.
Subminuette degree second waves normally show up on the daily chart when they’re within an extension.
That’s for both bull and bear.
The bull now would expect minute b is a zigzag, and the upwards movement expected for that idea is now a B wave within a B wave. Which is probably about the worst trading opportunity possible, no clear direction and a choppy consolidation for 1-3 days.
Pretty quiet here today. Anyway looks to me like the USD could be headed for another move lower, along with the stock market. Not sure where that leaves gold but it could make a nice move to the upside very soon. I’m building a little long position here and see what happens. Looks promising, at least very short term like next day or two. I”m thinking another couple of dollars to the downside at most and then a nice move up. Thoughts?
hmmm. maybe not so fast lol
Scary stuff. Low commodity prices could affect world markets.
“You’re going to be hearing more stories of companies getting into credit trouble before you can mark the bottom in the commodities market.”
http://www.cnbc.com/2015/09/28/glencore-may-spark-a-lehman-moment-for-miners.html
Hmmmmnnnn. Miners might be near strong support here
Excellent, I’ll be keeping my eye out for a shorting opportunity this week.