
Both Elliott wave counts will expect the same movement next.
Summary: A small consolidation should unfold over the next one to three days. The bear wave count sees it as a second wave correction, the bull as a B wave within a B wave. When it is done the breakout should be downwards. The consolidation should remain below 1,156.83.
Changes to last analysis are bold.
To see the bigger picture on weekly charts click here.
BEAR ELLIOTT WAVE COUNT
Click chart to enlarge.
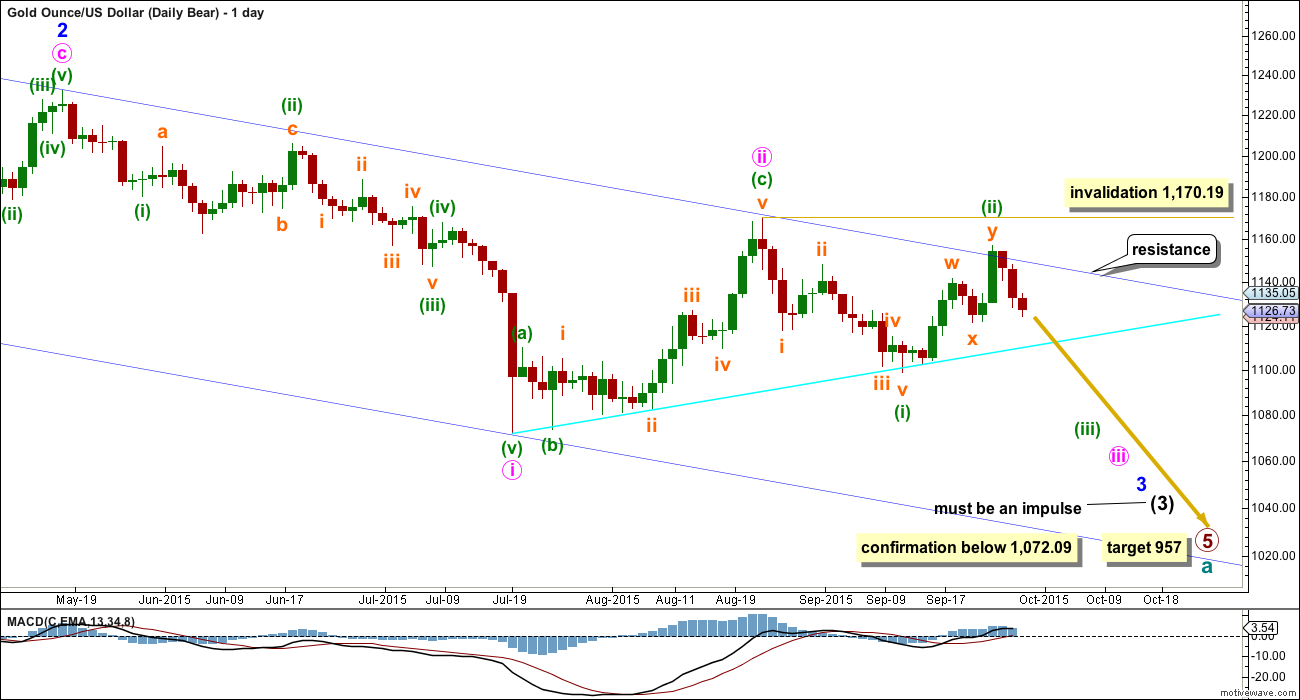
Gold has been in a bear market since September 2011. There has not yet been confirmation of a change from bear to bull, and so at this stage any bull wave count would be trying to pick a low which is not advised. Price remains below the 200 day moving average and below the blue trend line (copied over from the weekly chart). The bear market should be expected to be intact until we have technical confirmation of a big trend change.
This wave count now sees a series of four overlapping first and second waves: intermediate waves (1) and (2), minor waves 1 and 2, minute waves i and ii, and now minuette waves (i) and (ii). Minute wave iii should show a strong increase in downwards momentum beyond that seen for minute wave i. If price moves higher, then it should find very strong resistance at the blue trend line. If that line is breached, then a bear wave count should be discarded.
The blue channel is drawn in the same way on both wave counts. The upper edge will be critical. Here the blue channel is a base channel drawn about minor waves 1 and 2. A lower degree second wave correction should not breach a base channel drawn about a first and second wave one or more degrees higher. If this blue line is breached by one full daily candlestick above it and not touching it, then this wave count will substantially reduce in probability.
Minuette wave (ii) may not move beyond the start of minuette wave (i) above 1,170.19. A breach of that price point should see this wave count discarded as it would also now necessitate a clear breach of the blue channel and the maroon channel from the weekly chart.
Downwards movement from 1,170.19 will subdivide as a complete five wave impulse on the hourly chart, but on the daily chart it does not have a clear five wave look. Subminuette wave iii has disproportionate second and fourth waves within it giving this movement a three wave look on the daily chart.
Minuette wave (ii) will subdivide as a double zigzag, but it has a five wave look on the daily chart, not a three. Both the wave down labelled minuette wave (i) and the wave up labelled minuette wave (ii) have a better fit and look for the bull wave count than the bear at the daily chart level.
Gold has the most textbook looking structures and waves of all the markets I have analysed over the years, probably due to the high volume of this global market. And so I am quite concerned with the look of minuette waves (i) and (ii). Sometimes Gold has movements which don’t look perfect on the daily chart, but this is uncommon.
Sometimes Gold’s impulse waves start out slowly. There is a good example on this daily chart for minute wave i. When the fifth wave approaches that is when momentum sharply increases, and it often ends on a price shock with a volume spike. This is an even more common tendency for Gold’s third wave impulses. The strongest downwards movement is ahead, and it should be expected to arrive when subminuette wave v within minuette wave (iii) begins.
Full and final confirmation of this wave count would come with a new low below 1,072.09.
If primary wave 5 reaches equality with primary wave 1, then it would end at 957. With three big overlapping first and second waves, now this target may not be low enough.
Click chart to enlarge.
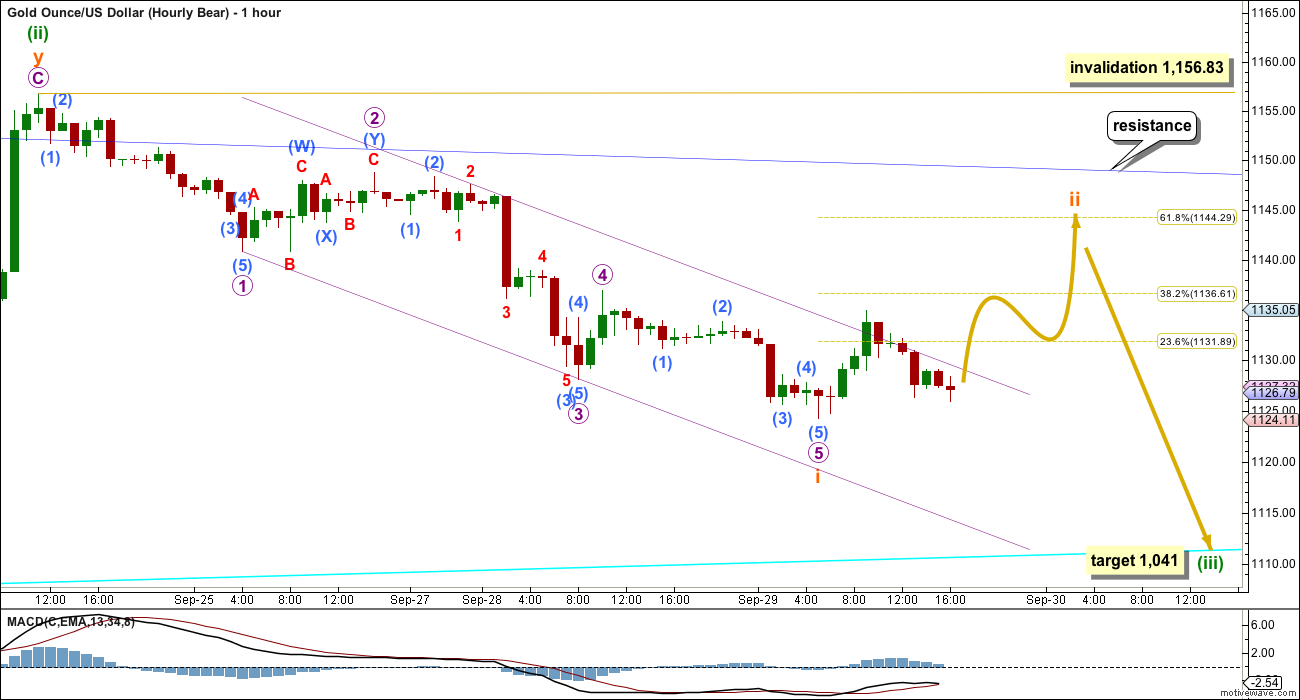
Subminuette wave i completed as a five wave impulse downwards. There is no Fibonacci ratio between micro waves 3 and 1, and micro wave 5 is just 0.08 longer than 0.618 the length of micro wave 3.
The best fit channel drawn about subminuette wave i is somewhat showing where upwards movement is finding resistance. When price breaks above the upper edge it should then find support there.
Subminuette wave ii may be any corrective structure except a triangle. If it unfolds as an expanded flat or combination, it may include a new low below its start at 1,124.29.
Within Gold’s extended impulses, the subminuette degree corrections often show up at the daily chart level. Subminuette wave ii may last 1-3 days. It may end about the 0.618 Fibonacci ratio of subminuette wave i at 1,144.
Subminuette wave ii may not move beyond the start of subminuette wave i above 1,156.83.
BULL ELLIOTT WAVE COUNT
Click chart to enlarge.
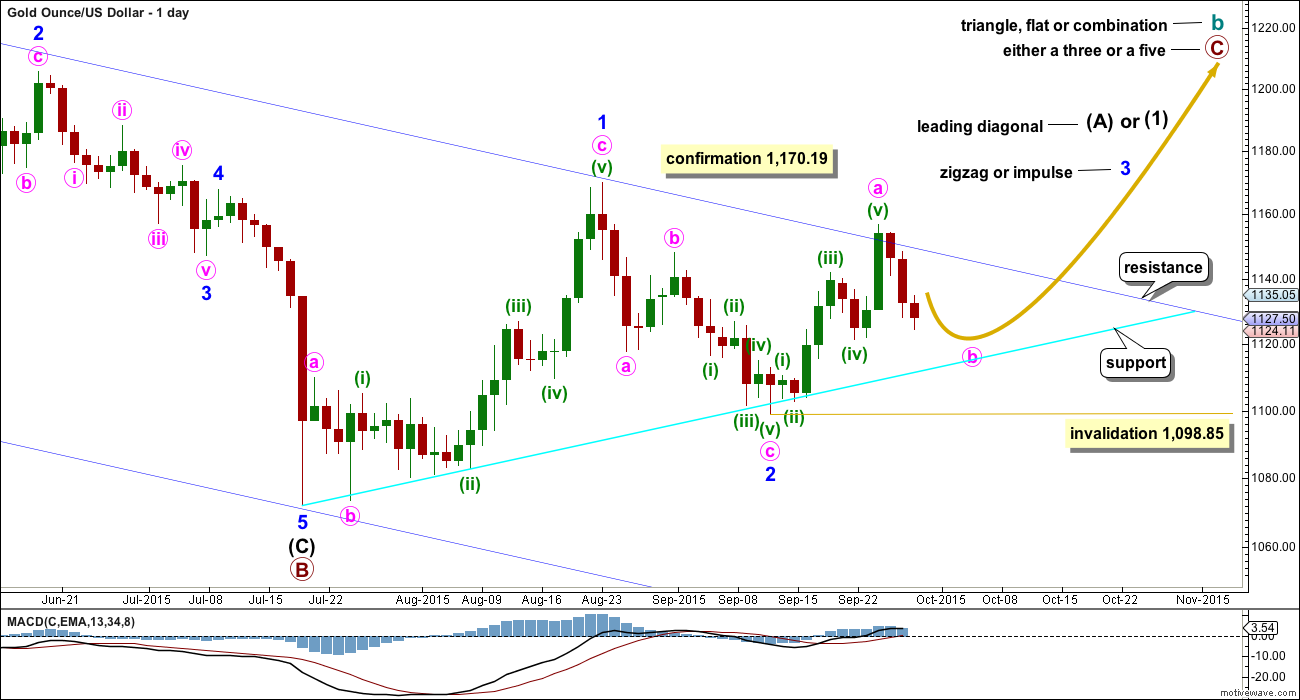
The bull wave count sees cycle wave a complete and cycle wave b underway as either an expanded flat, running triangle or combination. This daily chart works for all three ideas at the weekly chart level.
For all three ideas, a five up should unfold at the daily chart level for a movement at primary degree. This is so far incomplete. With the first wave up being a complete zigzag the only structure left now for intermediate wave (1) or (A) would be a leading diagonal. While leading diagonals are not rare they are not very common either. This reduces the probability of this bull wave count.
A leading diagonal requires the second and fourth waves to subdivide as zigzags. The first, third and fifth waves are most commonly zigzags, the but sometimes may appear to be impulses. So far minor wave 1 fits well as a zigzag.
To the upside, a new high above 1,170.19 would invalidate the bear wave count and provide strong confirmation for this bull wave count.
Upwards movement is finding resistance at the upper edge of the blue channel and may continue to do so. Use that trend line for resistance, and if it is breached, then expect a throwback to find support there.
I added a bright aqua blue trend line to this chart. Price has found support there and is bouncing up.
Minor wave 2 can now be seen as a complete zigzag. It is 0.73 the depth of minor wave 1, nicely within the normal range of between 0.66 to 0.81 for a second wave within a diagonal.
Third waves within leading diagonals are most commonly zigzags, but sometimes they may be impulses. Minor wave 3 should show some increase in upwards momentum beyond that seen for minor wave 1. Minor wave 3 must move above the end of minor wave 1 above 1,170.19. That would provide price confirmation of the bull wave count and invalidation of the bear.
There now looks like a five up on the daily chart within minor wave 3. This may be minute wave a within a zigzag, or it may also be minute wave i within an impulse. The five up may be seen as complete at this stage, so a three down would be expected for this bull wave count. Minute wave b may not move beyond the start of minute wave a below 1,098.85. Minute wave b may find support at the lower bright aqua blue trend line, if it gets down that low.
Click chart to enlarge.
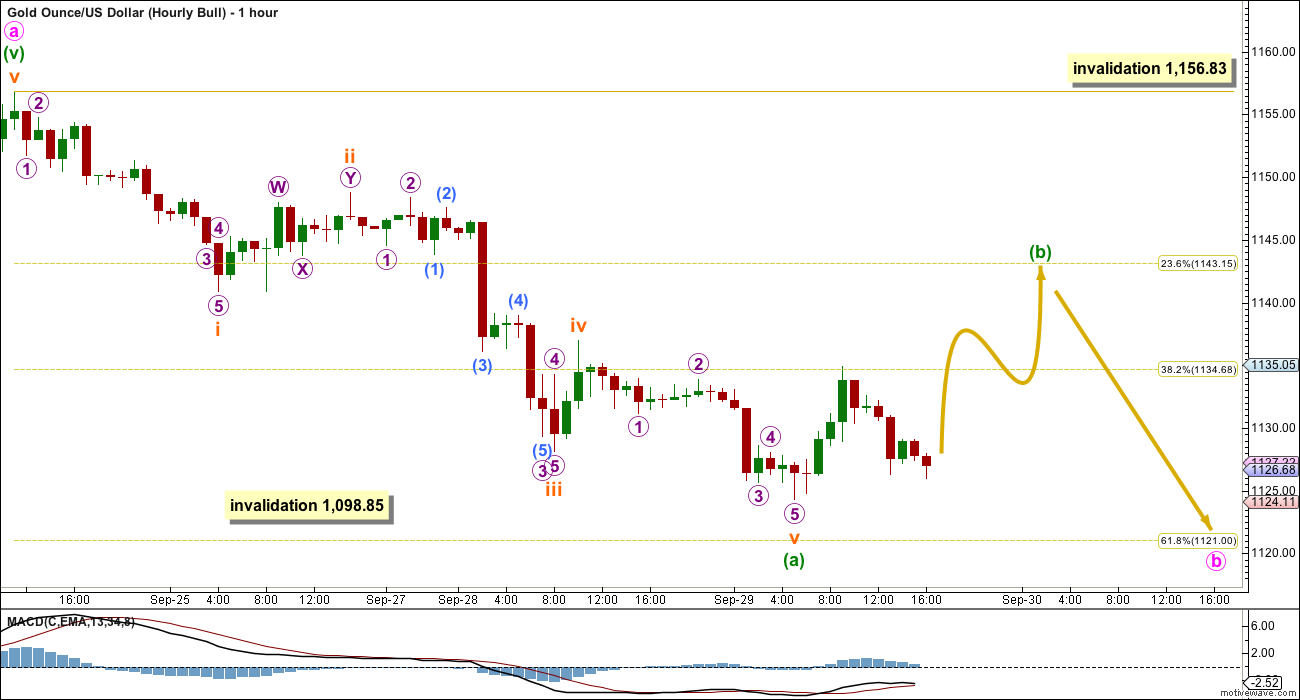
Minuette wave (a) subdivides as a five wave impulse. This now narrows the possible structures for minute wave b to a single or multiple zigzag. Within a zigzag, minuette wave (b) may not move beyond the start of minuette wave (a) above 1,156.83.
Minuette wave (b) may be any one of 23 possible structure including a triangle. If it unfolds as a running triangle, expanded flat or combination, then it may include a new low below its start at 1,124.29.
For minute wave b to have a clear three wave look at the daily chart level, minuette wave (b) within it should show up with one to three green candlesticks or doji.
There is no divergence between the two wave counts at the hourly chart level in terms of expected direction at this point, because A-B-C of a zigzag and 1-2-3 of an impulse have exactly the same subdivisions, 5-3-5. The only difference is here a triangle is allowed and it is not for the bear wave count.
When the correction for minuette wave (b) is complete the breakout should be downwards. Minute wave b may not move beyond the start of minute wave a below 1,098.85 for this bull wave count. How low the next wave goes may indicate which wave count is correct.
TECHNICAL ANALYSIS
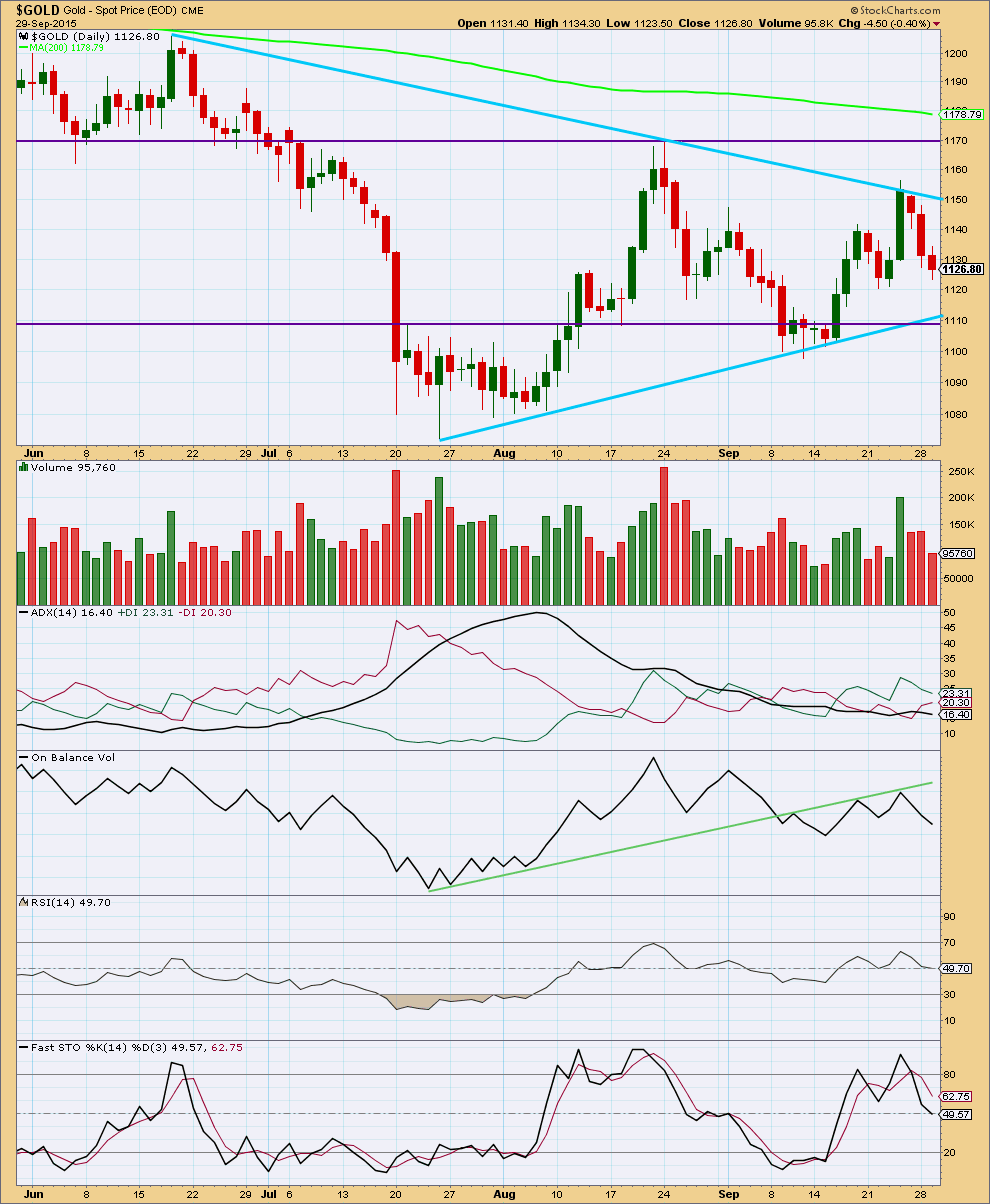
Click chart to enlarge. Chart courtesy of StockCharts.com.
Daily: Monday’s downwards day came on stronger volume when data was finalised for the session. The fall in price was supported by volume.
Tuesday comes on lighter volume, but again this may change after 6:30 p.m. EST when data for the session is finalised and available from StockCharts.
At this stage, volume for Tuesday looks to be lighter. This may indicate a correction may begin to move price higher at this point. The fall in price was not supported by volume.
ADX is pointing lower indicating there is no clear trend. During the last 37 days, while ADX has overall indicated the market is consolidating, it is still a downwards day which has strongest volume. This indicates that a downwards breakout may be more likely than upwards.
Price is being squeezed between the two blue sloping lines of resistance and support. The breakout comes closer as the consolidation matures and those lines converge. The market will begin to trend again, of that we may be sure.
A range bound system is outlined here using lines on price for resistance and support in conjunction with Stochastics to indicate overbought / oversold. Price reached resistance on Thursday and Stochastics reached overbought. This approach now expects a downwards swing to continue until price reaches support and Stochastics reaches oversold. During range bound markets, price does not move from resistance to support in straight lines but most often moves in a choppy and overlapping manner. Price may also overshoot resistance and support before one swing ends and the next begins. This is why trading a range bound market is very risky and best left to the most experienced traders. Stops and good money management are essential to ensure that losses are minimized because of whipsaws during a range bound market.
RSI at the daily chart level is neither overbought or oversold. There is room for the market to rise or fall.
Overall, at this stage, volume analysis indicates the bear wave count may be more likely than the bull.
This analysis is published about 06:35 p.m. EST.
Hi Lara,
The bear count below has:
1 – 50 days for Waves 1 to 5 and
2 – 49 days for waves A-B-C
3 – close to 50% retracement to end of Wave C
Has it already been considered and rejected?
That’s not Gold spot price. Its SPDR.
Its not the same market and will have a slightly different wave count.
The fourth wave would be huge in proportion to the second wave.
For Gold spot that idea would see the third wave have only slightly stronger momentum than the first. It should be substantially and clearly stronger. For that reason I don’t think the middle of this third wave is yet over.
No green daily candlestick has turned up.
For the bear subminuette wave ii was over already. I’m struggling to see how this downwards move is a continuation of subminuette wave i but I’m looking to see if that could fit on the five minute chart.
For the bull this has to be minute b over now.
Price is finding support at the aqua blue trend line, which would suggest a bounce up from here and a green candlestick or doji to Thursday’s session.
I need to spend more time looking at alternate possibilities on the five minute chart this morning.
Analysis will take longer than usual. I’m not going to rush it out, I want to have confidence in it.
Lara, for the bear count…. How are you going to fit sub-waves green 3, pink 3, blue 3, black 3, et-all.. so that they fit without overlapping each respective wave 4 into wave 1 territory and squeeze this all in before your primary target of $957? Is this even possible?
That’s why I say the target is probably not low enough now.
At this stage I can only calculate the target at primary degree. I will be able to calculate it at intermediate degree when intermediate waves (3) and (4) are complete. At that point the target will probably change.
I can’t do that yet.
And so for that reason I think I’ll remove that target now. It may just be too confusing. And I don’t think it’s right anyway.
SLV and GDX have seemed to follow very predictable 19 and 25 week cycle lows over the last two or more years which correspond with 19 week peaks in DUST. 25 week lows scheduled in about 2 weeks and 19 week low in about 8 weeks, we will see.
Lara, nice visuals for possible waves, targets, re-tracements. I realize charts show just one of multiple possibilities but great to visually see possible wave form.
Your probable possibilities always better than my probable possibilities.
LOL
Yes, members seem to prefer it if I leave more space on the RHS and have wiggly arrows.
This is a more long term look.
GLD to GOLD ratio is 0.096 these days.
The blue lines on the chart are:
TOP – GLD = 110 GOLD equiv = $1146 = resistance
2nd – GLD = 104 GOLD equiv = $1083 = support
3rd – GLD = 93 GOLD equiv = $969
4th – GLD = 90 GOLD equiv = $937
So the whole point is that the VOLUME AT PRICE bars at the left side of the chart act as a magnet for price action.
When there is a vacuum of volume (such as indicated by the two yellow arrows), price will jump or gap or run quickly through that price zone to the next area of volume support.
The recent GOLD low of 1078 and the 104 (GLD)=1083 (GOLD) levels suggest a waterfall drop if broken. This may be why GDX is trying to make a stand at these levels. I don’t currently have data before 2006 for GDX…so below here is…. there….and …..there is no there there….hehehe.
The other interesting point is that the target for volume support between 969 and 937 lines up nicely, or rather supports nicely, Lara’s bear target of 957.
Lastly the trendlines/channels have captured this entire correction fairly neatly. If it is to continue the 957 target projects out to the end of 2017. Since I have a small bear position I don’t want to wait that long so I’m voting for a breakdown from the channel like we saw in 2013. If there are any cycle dudes or dudettes tracking GOLD a time cycle target for a bottom would be most welcome..
Nice chart. Thanks for sharing.
Gold price plunged to as low as 1113.08 pre-market.
Now, this cannot be the B within a B for the bull, or SM2 for the bear because the drop is a retrace of more than 200% violating the norm for an extended flat. (It was 1124.42 – 1134.85 – 1113.08 if the drop is completed, lower if it hasn’t).
There are a lot of ways to look at what alternative wave count is now possible. The least damaging one I can think of is that the whole drop from 1156.77 to 1113.08 is subminuete 1 for the bear (Lara had it as 1124.42 which started the SM2 count given above). It would also be Minute B for the bull. If this is correct, the next movement will be upwards to 1140 for the bear @ 0.618 retrace, or 1264 for the bull.
Any other wave counts?
Your count sounds good to me Tham.
I am very surprised that gold is down and miners are stronger than yesterday when gold was higher. If gold hangs around this lower price of 1114 than miners would drop especially if it stays here until day end.
I don’t see any invalidations.
Low was 1111.76 at 10:33 am EST and likely was the end of subminuette wave i down and subminuette wave ii up begins.
Possibly miners as hybrids are influenced by today’s strong move up in SP 500.
I could be wave C of a big expanding flat. Remote possibility i would say though.
Drop is now down to 1111.76, and may not be over yet.
Scrap the preliminary analysis above.
A more accurate count would be:
Minute B for the bull @ 1111.76 (?). Minute B could be 1156.77 – 1124.42 – 1134.85 – 1111.76 (?). Bull would still target 1264.
Micro 1 of subminuette 3 for the bear @ 1111.76 (?). Minuette 3 would be 1156.77 – 1124.42 – 1134.85 -ongoing.
Subminuette 3 could be targeting 1082.51, which is 1.618 of subminuette 1.
Tham sounds like Lara’s target of 1144.29 for subminuette wave ii may not happen and no green daily candlesticks?
subminuette wave i at 1124.42 at 5:35 am Sept 29
Subminuette wave ii at 1134.85 at 9:49 am Sept 29
Subminuette wave iii, micro 1 at 1111.76 at 11:33 am Sept 30
Subminuette wave iii end target 1082.51
If I revert to the initial thought that the drop from 1156.77 to today’s low of 1111.76 can be labelled as subminuette 1 of minuette 3 for the bear, then I would arrive at 1041 for minuette 3 which would tie in with Lara’s count. Subminuette 2 could rise to 1140 @ 0.618 and would yield a green candlestick. For now, this might be a better count. I looked at the drop again on a 4-hour time frame and can clearly make out five waves down for the 1156.77 to 1111.76 drop.
The bull count will see a strong rise towards 1264, and that would be plenty of green candlesticks.
We’ll wait for Lara’s more detailed analysis to form a final judgement.
looks like we need one intra day low below current level
to complete this wave 1 down
thoughts?
GOLD and COT data relationship on watch!!
On 9/25 COT report was bearish and Gold closed at 1146.30.
It will be interesting to see Friday’s report!!!
The aqua blue trend line on the daily charts should provide initial support.
Just chart only Gold weekly!!!
With the new low below 1121, I believe that the bears have sealed the deal in a way – the higher low idea has been partially neutralized for the bulls.
Since a powerful 3rd wave is coming soon, I would expect any unfolding correction to not exceed .618. In fact, it may be slightly less. 1142 would be the maximum here.
I honestly do not believe that gold will reach the 1140s again for quite some time. 1130s will be the last opportunity to add to short positions.
Quite on all Front!!! Looking at the number of posts , gold is still in sideway trend.
Patiently waiting for this correction to end.
M