
Overall downwards movement was expected mid term for both Elliott wave counts.
The short term structure favours the idea presented on the hourly bear Elliott wave count.
Summary: Both wave counts still expect overall downwards movement this week. Short term it is most likely we shall see some upwards movement to complete a small second wave correction to 1,128 – 1,129. Thereafter, a third wave down should unfold. Short term a new low below 1,116.02 would confirm a third wave down is most likely underway.
Changes to last analysis are bold.
To see weekly charts and the three different options for cycle wave b (bull wave count) click here.
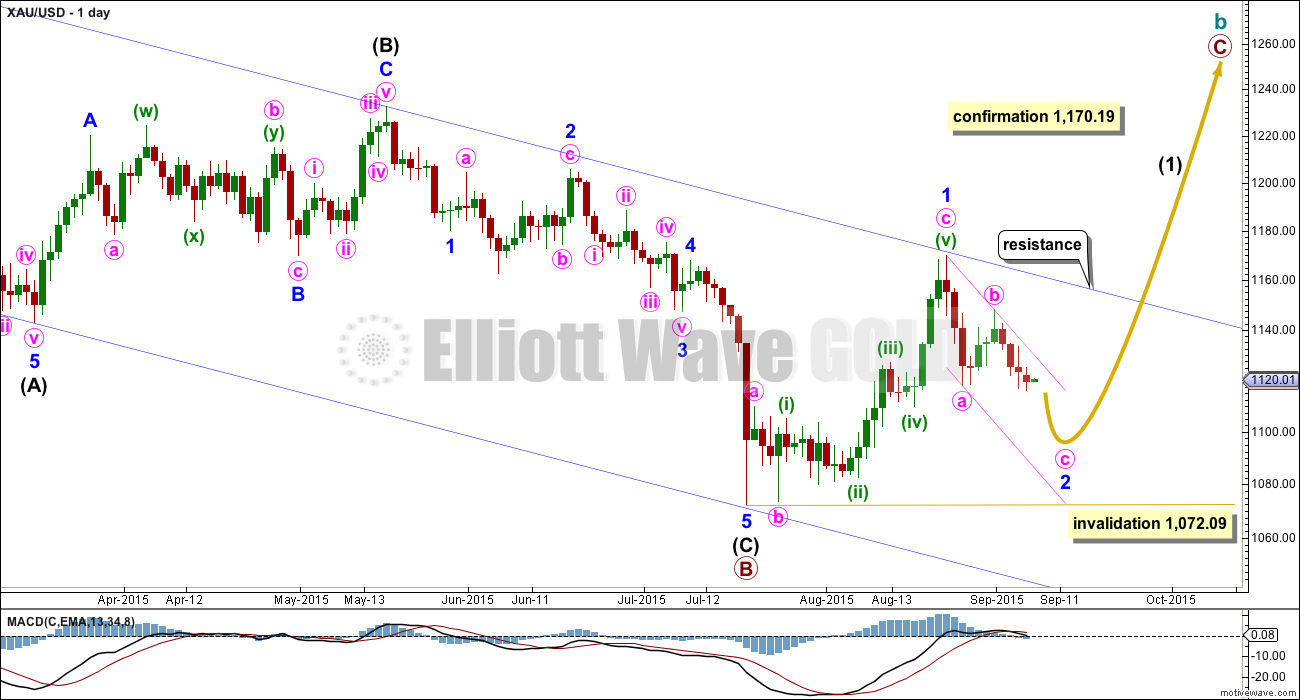
BULL WAVE COUNT – DAILY
Click chart to enlarge.
The bigger picture at super cycle degree is still bearish. A large zigzag is unfolding downwards. Along the way down, within the zigzag, cycle wave b must unfold as a corrective structure.
At this stage, there are three possible structures for cycle wave b: an expanded flat, a running triangle, or a combination.
This daily chart works for all three ideas at the weekly chart level.
For all three ideas, a five up should unfold at the daily chart level. This is so far incomplete. With the first wave up being a complete zigzag the only structure left now for intermediate wave (1) would be a leading diagonal. While leading diagonals are not rare they are not very common either. This reduces the probability of this bull wave count now to about even with the bear wave count.
A leading diagonal requires the second and fourth waves to subdivide as zigzags. The first, third and fifth waves are most commonly zigzags, the but sometimes may appear to be impulses. So far minor wave 1 fits well as a zigzag.
Minor wave 2 may not move beyond the start of minor wave 1 below 1,072.09. If this invalidation point is breached, then it would be very difficult to see how primary wave B could continue yet lower. It would still be technically possible that primary wave B could be continuing as a double zigzag, but it is already 1.88 times the length of primary wave A (longer than the maximum common length of 1.38 times), so if it were to continue to be even deeper, then that idea has a very low probability. If 1,072.09 is breached, then I may cease to publish any bullish wave count because it would be fairly clear that Gold would be in a bear market for cycle wave a to complete.
To the upside, a new high above 1,170.19 would invalidate the bear wave count below and provide strong confirmation for this bull wave count.
Upwards movement is finding resistance at the upper edge of the blue channel and may continue to do so. Use that trend line for resistance, and if it is breached, then expect a throwback to find support there.
In the short term, use the smaller pink channel drawn about the zigzag of minor wave 2 using Elliott’s technique for a correction as shown. Copy this channel over to the hourly chart. This channel is also drawn in the same way for the bear wave count, and there it is correctly termed a base channel. Both wave counts should expect upwards corrections for the short term to find resistance at the upper edge of this smaller channel.
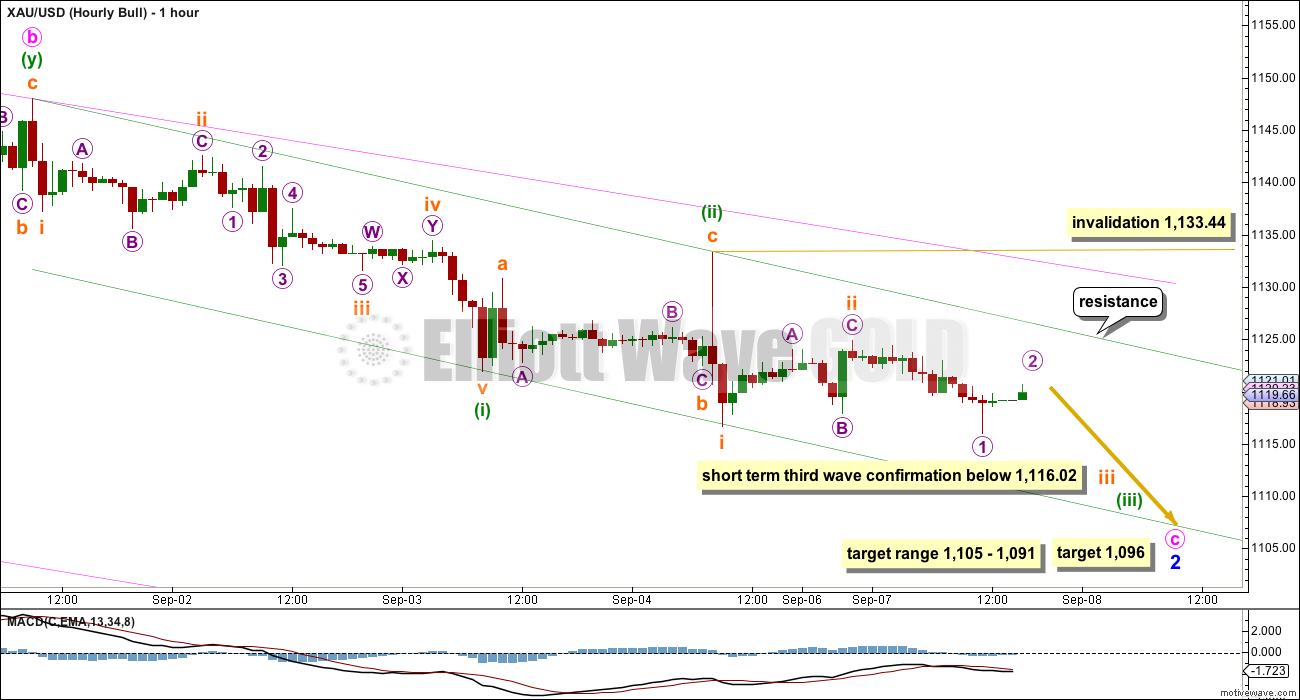
Click chart to enlarge.
There is more than one way to see this downwards movement from the end of minute wave b. The two hourly charts will look at this wave down in two different ways, and both will work exactly the same for bull and bear wave counts.
A five down and a following three up for a first and second wave may already be over. This means Gold may be ready to move into the middle of a third wave down.
Ratios within minuette wave (i) are: subminuette wave iii is 0.16 longer than equality in length with subminuette wave i, and subminuette wave v has no Fibonacci ratio to either of submineutte waves i or iii. Subminuette wave ii was a 0.49 expanded flat and subminuette wave iv a 0.26 double combination. There is some alternation in depth and a little in structure, but the alternation particularly in structure is inadequate (flats and combinations are very similar in structure and have the same purpose).
Ratios within subminuette wave iii are: there is no Fibonacci ratio between micro waves 1 and 3, and micro wave 5 is 0.18 short of 0.618 the length of micro wave 3. Micro wave 2 is a deep 0.79 expanded flat and micro wave 4 is a less deep 0.58 zigzag. There is a little alternation in depth and good alternation in structure.
Minuette wave (ii) would be most likely over in this scenario as a zigzag.
The target for minute wave c to end remains the same at 1,096 where it would reach equality in length with minute wave a. This would see minor wave 2 reach down to within the normal depth for a second wave correction within a diagonal, between 0.66 to 0.81 of minor wave 1, which is between 1,105 to 1,091.
Draw a smaller base channel about minuette waves (i) and (ii). Draw the first trend line from the start of minuette wave (i) to the end of minuette wave (ii), then place a parallel copy on the end of minuette wave (i). Along the way down, for this scenario, corrections should find resistance at the upper edge of this smaller green channel. If the upper edge is breached on Monday, then that would be the earliest indication that this first scenario may be wrong and the second scenario may be correct.
No second wave correction may move beyond its start above 1,133.44 within minuette wave (iii). If this first scenario is invalidated, then the second scenario will be expected.
Today there may be two overlapping first and second waves to begin minuette wave (iii). This idea is further reduced in probability today because it is very difficult to see the downwards wave labelled micro wave 1 as a five wave structure on the five minute chart. This wave down fits neatly as a double zigzag which is how the second scenario presented for the hourly bear sees it. Short term a new low below 1,116.02 would indicate a third wave down is underway.
BEAR ELLIOTT WAVE COUNT
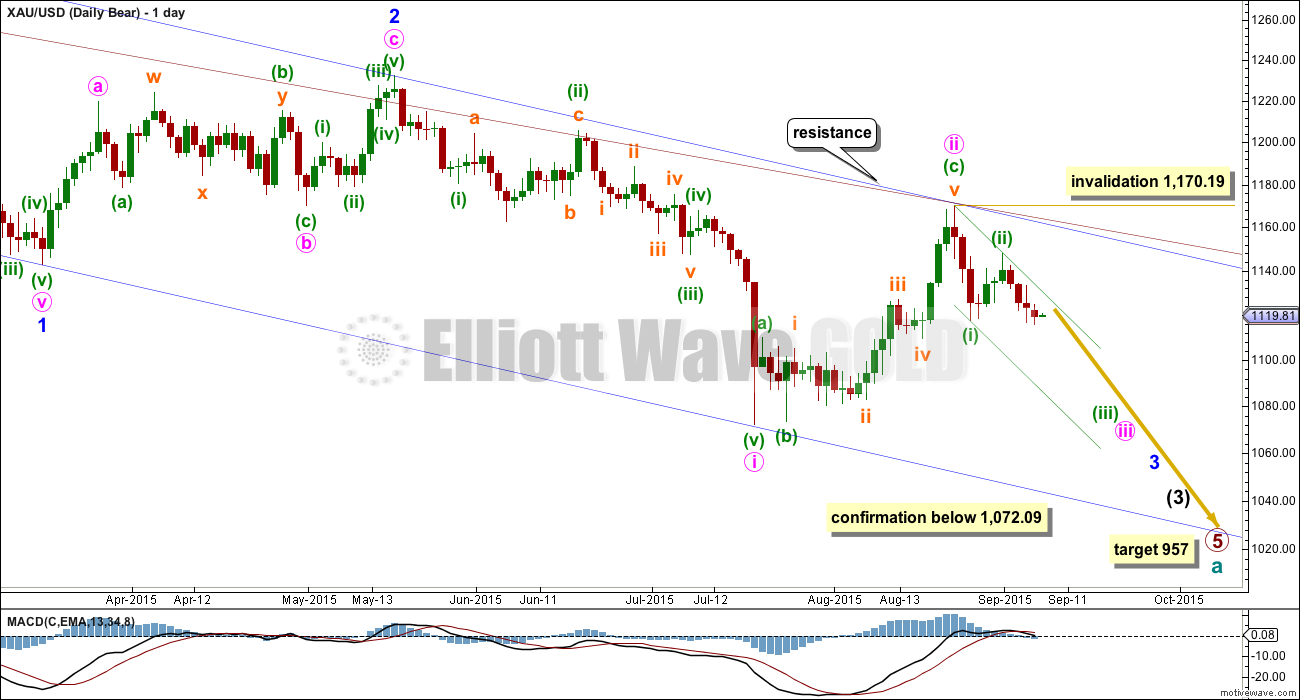
Click chart to enlarge.
At this stage, the reduction of probability for the bull wave count sees this bear wave count about even now in probability.
This wave count now sees a series of four overlapping first and second waves: intermediate waves (1) and (2), minor waves 1 and 2, minute waves i and ii, and now minuette waves (i) and (ii). Minute wave iii should show a strong increase in downwards momentum beyond that seen for minute wave i. If price moves higher, then it should find very strong resistance at the blue trend line. If that line is breached, then a bear wave count should be discarded.
The blue channel is drawn in the same way on both wave counts. The upper edge will be critical. Here the blue channel is a base channel drawn about minor waves 1 and 2. A lower degree second wave correction for minute wave ii should not breach a base channel drawn about a first and second wave one or more degrees higher. If this blue line is breached by one full daily candlestick above it and not touching it, then this wave count will substantially reduce in probability.
Minuette wave (ii), if it were to continue, may not move beyond the start of minuette wave (i) above 1,170.19. A breach of that price point should see this wave count discarded as it would also now necessitate a clear breach of the blue channel and the maroon channel from the weekly chart.
Full and final confirmation of this wave count would come with a new low below 1,072.09.
If primary wave 5 reaches equality with primary wave 1, then it would end at 957. With three big overlapping first and second waves, now this target may not be low enough.
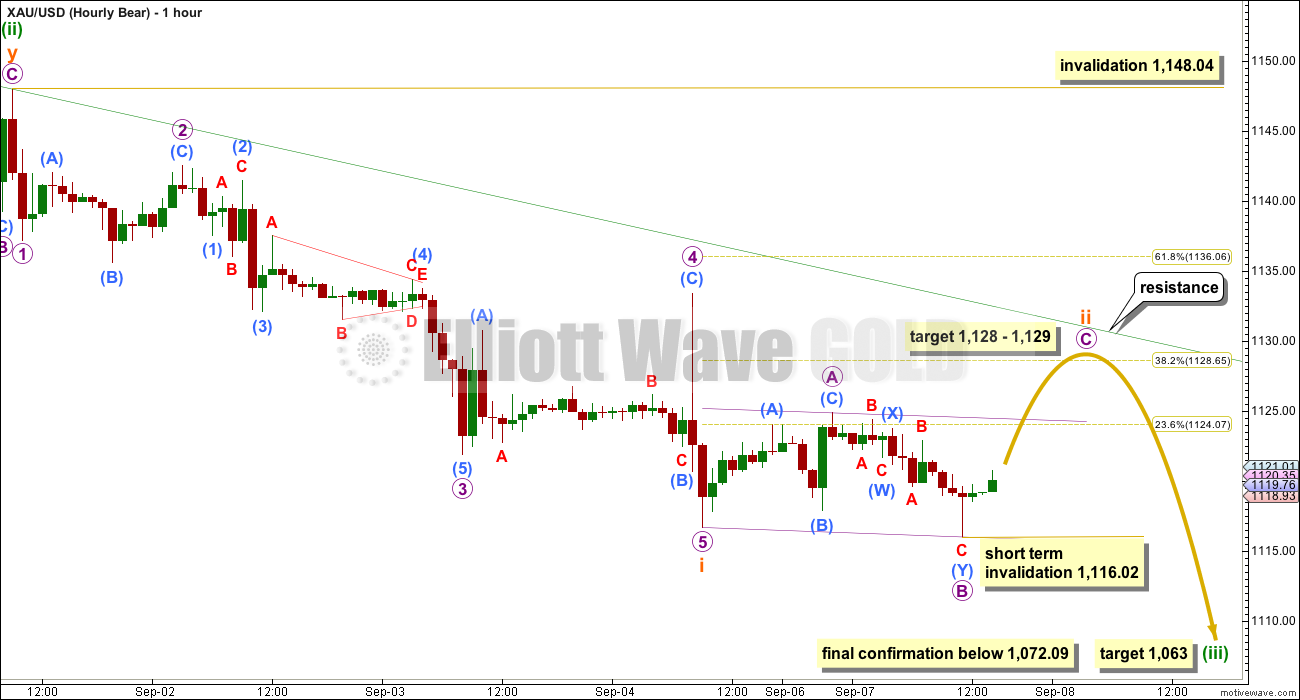
Click chart to enlarge.
This wave count expects an impulse to be beginning downwards. An impulse subdivides 5-3-5-3-5. So far the first 5 down is complete.
The beginning of an impulse and the whole of a zigzag have exactly the same subdivisions.
On this hourly chart, again, I am looking at another way to see this recent downwards movement which may have completed a five wave impulse at Friday’s low.
Ratios within subminuette wave i are: there is no Fibonacci ratio between micro waves 1 and 3, and micro wave 5 is 0.72 short of 1.618 the length of micro wave 1. Micro wave 1 is a 0.49 expanded flat and micro wave 4 is a deeper 0.56 zigzag. There is a slight but inadequate alternation in depth, but very good alternation in structure.
There is no Fibonacci ratio between submicro waves (1), (3), and (5) within micro wave 3. But there is perfect alternation in structure and depth between the deep 0.79 expanded flat of submicro wave (2) and the shallow 0.18 triangle of submicro wave (4).
While the Fibonacci ratios for this idea are not quite as good as for the first idea, the alternation is better. On balance I think this second idea is more likely.
Subminuette wave ii may be unfolding as a regular flat correction. Within subminuette wave ii, micro wave A is a three and micro wave B is a double zigzag which is termed a three and is 108% the length of micro wave A. Micro wave C would reach 1.618 the length of micro wave A at 1,129, and subminuette wave ii would reach the 0.382 Fibonacci ratio of subminuette wave i at 1,128. This gives a $1 target zone for a little upwards movement. Micro wave C would be highly likely to make at least a slight new high above the end of micro wave A at 1,124.91 to avoid a truncation and a very rare running flat. This upwards movement may not show up on the daily chart and is more likely to be over within the next 24 hours.
If it gets that high, then subminuette wave ii should find strong resistance and not break above the upper edge of the green channel copied over here from the daily chart.
Short term, while micro wave C unfolds, no second wave correction within it may move beyond its start below 1,116.02. As soon as there is a new high for micro wave C above the end of micro wave A at 1,124.91, then this invalidation point no longer applies and at that point micro wave C may end at any time whether or not the target is reached.
Subminuette wave ii may not move beyond the start of suminuette wave i above 1,148.04.
The target for minuette wave (iii) remains the same. At 1,063 it would reach 1.618 the length of minuette wave (i).
TECHNICAL ANALYSIS
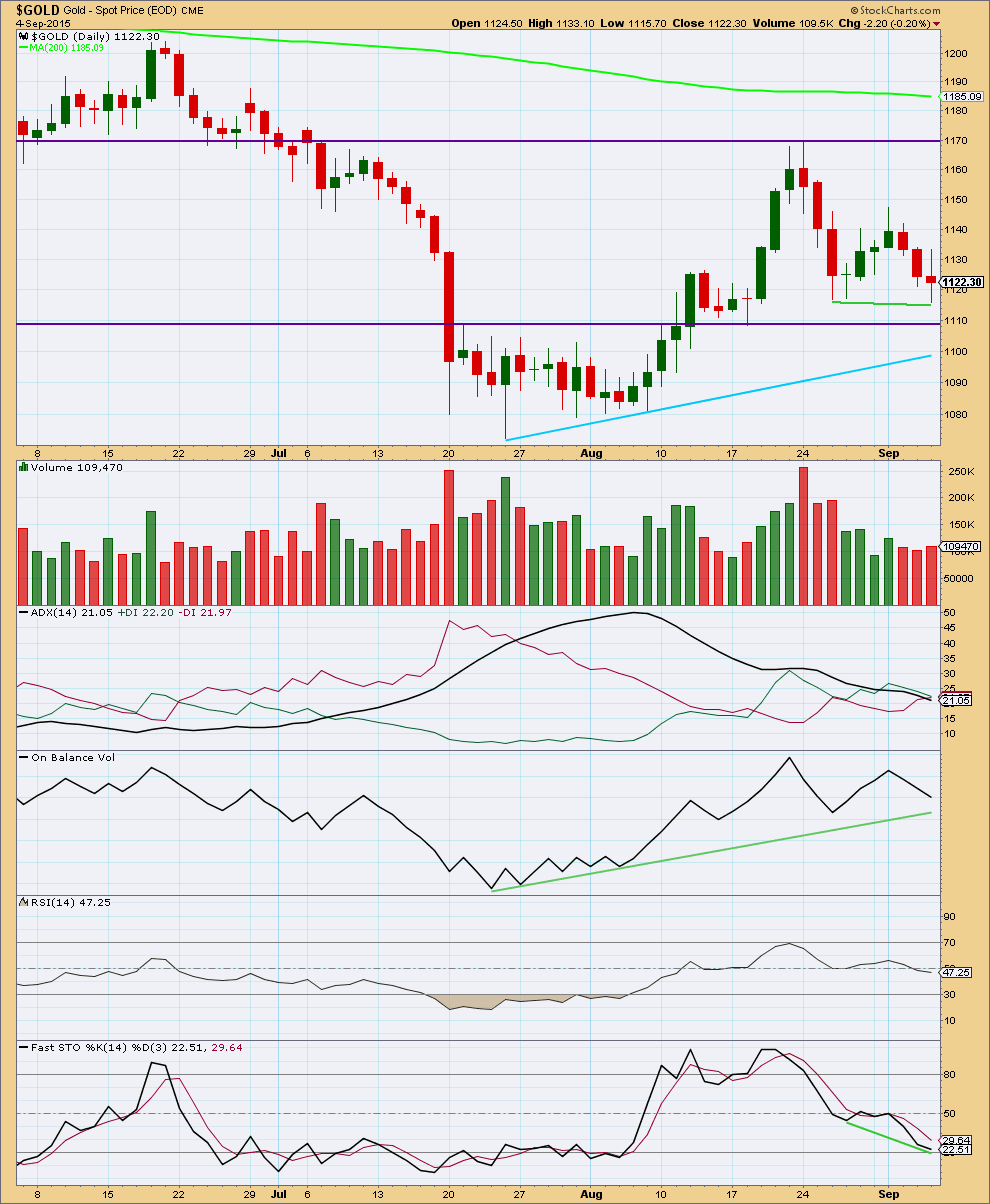
Click chart to enlarge. Chart courtesy of StockCharts.com.
Another slight increase in volume for a downwards day supports the idea that Gold is likely to move lower because downwards movement is supported by volume. Today’s candlestick has a small body with long shadows which indicates a balance between bulls and bears with the bears slightly favoured. This candlestick looks like a typical correction within a downwards trend. Volume slightly favours the scenario presented on the hourly bull count, but the candlestick better favours the scenario presented for the hourly bear count. On balance I still prefer the scenario presented for the hourly bear count.
The one thing that is clear from volume is the strongest day most recently was the strong downwards day of 24th August. This may be an indication that Gold should move lower.
ADX continues to indicate the market is not yet in a clear trend while the black ADX line points down.
A shorter held trend line on On Balance Volume has not yet been reached at the daily chart level. When On Balance Volume reaches that line then it may find some support. If it breaks through, then that would be strong bearish indication. OBV is pointing lower today which does provide some support to the fall in price. There is no divergence. OBV agrees with the price direction.
Stochastics has not yet reached oversold territory, so a further fall in price may be expected to be seen at least in the short term until Stochastics reaches oversold territory.
The picture at the daily chart level is mixed and unclear, but very slightly favours the bear wave count over the bull.
This analysis is published about 07:33 p.m. EST.
Not sure what time Lara looks in. Sure would appreciate knowing if the bear hourly would consider micro C over.
Anybody got a current EW count going?
Good morning, I’m here 🙂
I think my preferred scenario on the hourly bear is playing out nicely. But I’m tying right now to figure out on the five minute chart if micro C is a complete five.
So far I can’t see it…
Still working on it.
On the five minute chart it just doesn’t fit as a five, either an ending diagonal or an impulse. Current downwards movement is too deep for a fourth wave correction, trying to fit a diagonal in there would see the third wave the shortest violating a rule.
I am considering what if this is not a flat but a double zigzag? This wave up does subdivide perfectly as a 5-3-5 zigzag.
If thats the case it may be over.
But there is zero confirmation of this so far. I can see a short term very small trend line on the hourly chart showing where price is finding support for the last few hours, it’s coming down again to test that line. If that line is breached clearly but a full hourly candlestick then it would be likely the whole correction is over.
A new low now below 1,116.02 would provide price confirmation that the correction is over and a third wave down would then be highly likely.
Thank you very much for commenting. As always, your analysis is appreciated. 🙂
A break below 1116-1115 is beginning to look more distant. A break above 1128-29 (10dma) would likely look to seek to take out 20dma and Friday H 1133.10 for target 1135-45+…. Seems like a repeat of when Gold price was expected to break below 1079-78 and never did, instead moved on up through 1095-1099 etc. for 1169…. Tough to see a break below 1120-18 at this stage….. Come on bears…..~! //// Gold price is having an inside month so far with the H 1169 / L 1080…..
Subminuette ii needs a 5 wave up from Monday low at 1,116.23 at 11:20 am.
Perhaps the top of the 3rd wave may have been at 1,124.26 at 8:42 then the 4th wave began.
Perhaps gold may now in the 5th wave up to exceed 1,124.26 at least slightly and may or may not reach the 1,128-1,129 target before turning down fast.
“Micro wave C would be highly likely to make at least a slight new high above the end of micro wave A at 1,124.91 to avoid a truncation and a very rare running flat. This upwards movement may not show up on the daily chart and is more likely to be over within the next 24 hours.”
Once slightly above 1,124.91 it may end at any time below the 1,128-1,129 target. More likely upward movement would be over within 24 hours.
I got dust in a 3rd of a fifth down, heading toward Tham’s target of 27.02, might get into the 26’s, where I will load up!
Tham mentioned this morning.
“My DUST entry point will be 28.86 (for gold bull count) or 27.08 (for bear count).”
The current gold price movement favours the bear.
I see the bear at subminuette 2 micro c, submicro 3. Now at miniscule 4. So, the target of 1129 may even be exceeded slightly.
In the light of this development, I could consider my next lower target for DUST at 26.53.
Thank you Tham for keeping us updated. (Was just going to ask if you see a 5 up from the 1116.08 on 9/7.) My prior work autotriggered Dust at 27.93 which I totally forgot about, while I was watching for an entry. My gosh, Newbies!
With your assessment of micro C wave favouring the bear I will now be patient.
I think you’ve given great news.
Alan: “Bull is in micro 2 and must rise in 3 waves.
Bear is in micro c of subminuette 2 and must rise in 5 waves.”
So this rise is now 5 waves up!!! Wait for 1129!!!.
Thanks.
There is still a slim chance for the bull.
For this to happen, gold price MUST NOW break below 1116.23 in a third wave, micro 3, down.
Ya, I got a buy signal on DUST at $27.50 so I entered at $27.60. I have to leave in 30 minutes so I’m trying to decide If I should take profits or let it ride while I’m gone for an hour. What would you do?
Morning Tham, I also don’t attempt to count waves, I was just curious if there was no way there was 5 up at 1126.83 today.
Thanks, Rob
Good morning, Robert.
I too find it difficult to count 5 waves up. 3 was easy to see. Maybe we have to wait for Lara to give a clearer picture. It might require going down to 1-minute level to flush it out. Like Papudi, I just use price figures based on Fib ratios.
Lara, fyi, your StockCharts chart for technical analysis is only updated through the 4th. I checked just now, and it’s still not updated through the 7th. Must be a holiday thing…..
It is a holiday thing.
Actually, no. I still can’t get it!
Anyone else here using Stockcharts? Can anyone else see the candlesticks for today and yesterday for $GOLD there?
I’ve updated and changed the amount of data shown… and I just can’t get it to give me the last two daily candlesticks.
The description line above the chart says “Spot Price (EOD) CME”.
The CME would have been closed yesterday (the 7-th).
Yes. Thanks, that’s it.
Lara, gold candlesticks for stockcharts only appear about 15 minutes after 4:00 pm EST daily close. They still show September 4th last close now 3:11pm EST.
http://stockcharts.com/h-sc/ui?s=%24gold
Thank you.
No candlestick for yesterday from Stockcharts because NY was closed.
Alan: Great report by Lara on gold’s pathway to wave 3 target.
If gold has been to 1128-1129 already before NY opens, is it safe to buy DUST on the opening??
Thanks.
Papudi good question thank you. I’m looking to do the same thing.
Hi Papudi. Definitely so.
My DUST entry point will be 28.86 (for gold bull count) or 27.08 (for bear count).
Odds now favours the gold bear count though.
There is a simple way to distinguish between gold and bear.
Bull is in micro 2 and must rise in 3 waves.
Bear is in micro c of subminuette 2 and must rise in 5 waves.
It will be a simple matter to count 3 or 5.
Thanks Alan. May be it is simple for EW analyst but not me. I still can not count the simple wave.
Price will tell me tho.
Hi Alan,
do you have any thoughts where we could be actually within subminuette ii?
or do you think it could be already over?
Hi Raphael.
In my opinion, both scenarios are still valid.
SM2 could have been over if it is the bull.
If it is the bear, then probably only the first subwave of SM2 was over.
I am using 1116.23 (based on pmbull chart) as the decision point. If price goes below that, then it’s the bull. Otherwise, I’m still rooting for the bear.
thank you,
i have a problems to count 5 waves either way