
The scenario on the hourly bear Elliott wave count was preferred, which expected a little upwards movement to a short term target at 1,128 – 1,129.
Price moved higher to 1,127.96.
Summary: Both wave counts still expect overall downwards movement this week. In the short term, another second wave correction may have just ended; confirmation would come first with a break below the short term trend line on the hourly chart and then a new low below 1,116.02. At that stage, a third wave down would most likely be in the early stages. The bull wave count has a target for downwards movement to end at 1,096. The bear target is 1,063.
Changes to last analysis are bold.
To see weekly charts and the three different options for cycle wave b (bull wave count) click here.
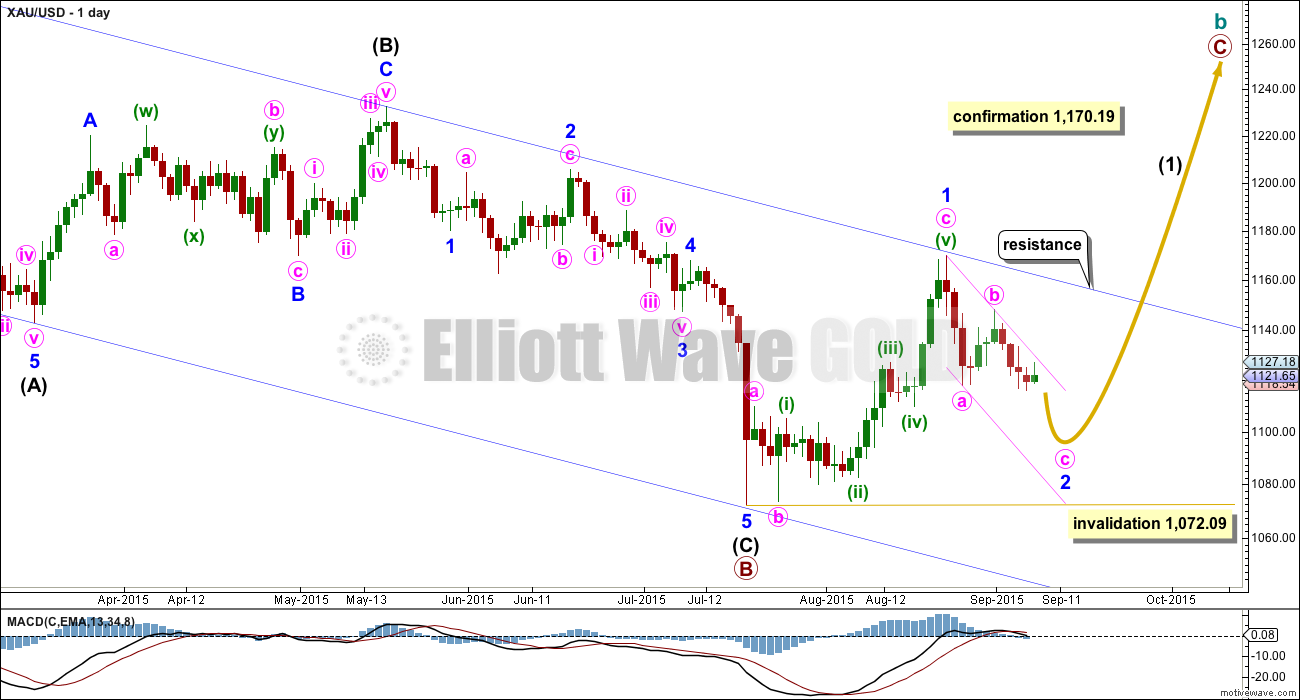
BULL WAVE COUNT – DAILY
Click chart to enlarge.
The bigger picture at super cycle degree is still bearish. A large zigzag is unfolding downwards. Along the way down, within the zigzag, cycle wave b must unfold as a corrective structure.
At this stage, there are three possible structures for cycle wave b: an expanded flat, a running triangle, or a combination.
This daily chart works for all three ideas at the weekly chart level.
For all three ideas, a five up should unfold at the daily chart level. This is so far incomplete. With the first wave up being a complete zigzag the only structure left now for intermediate wave (1) would be a leading diagonal. While leading diagonals are not rare they are not very common either. This reduces the probability of this bull wave count now to about even with the bear wave count.
A leading diagonal requires the second and fourth waves to subdivide as zigzags. The first, third and fifth waves are most commonly zigzags, the but sometimes may appear to be impulses. So far minor wave 1 fits well as a zigzag.
Minor wave 2 may not move beyond the start of minor wave 1 below 1,072.09. If this invalidation point is breached, then it would be very difficult to see how primary wave B could continue yet lower. It would still be technically possible that primary wave B could be continuing as a double zigzag, but it is already 1.88 times the length of primary wave A (longer than the maximum common length of 1.38 times), so if it were to continue to be even deeper, then that idea has a very low probability. If 1,072.09 is breached, then I may cease to publish any bullish wave count because it would be fairly clear that Gold would be in a bear market for cycle wave a to complete.
To the upside, a new high above 1,170.19 would invalidate the bear wave count below and provide strong confirmation for this bull wave count.
Upwards movement is finding resistance at the upper edge of the blue channel and may continue to do so. Use that trend line for resistance, and if it is breached, then expect a throwback to find support there.
In the short term, use the smaller pink channel drawn about the zigzag of minor wave 2 using Elliott’s technique for a correction as shown. Copy this channel over to the hourly chart. This channel is also drawn in the same way for the bear wave count, and there it is correctly termed a base channel. Both wave counts should expect upwards corrections for the short term to find resistance at the upper edge of this smaller channel.
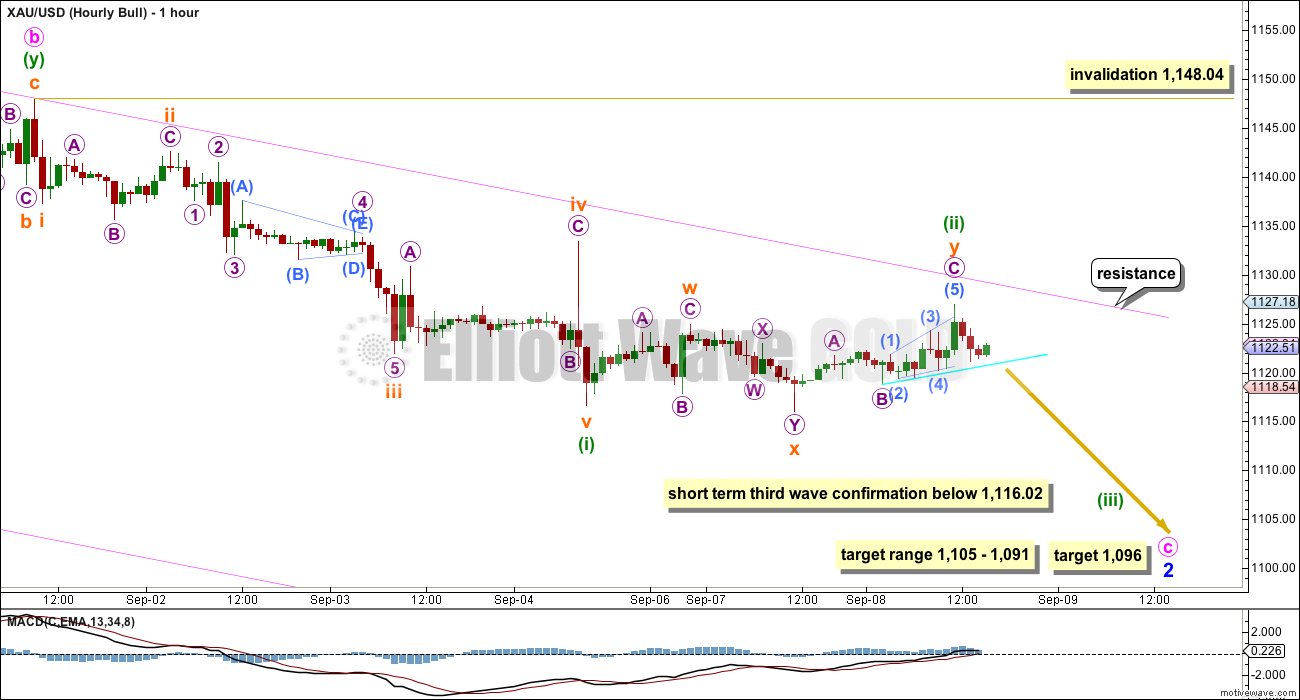
Click chart to enlarge.
I am changing the labelling within downwards movement to be the same as that on the hourly chart for the bear wave count. It looks like a first wave is complete, and now a second wave correction is either over or should be over soon.
Minuette wave (ii) subdivides as a double zigzag. The upwards wave labelled subminuette wave y will not subdivide on the five minute chart as a five wave structure, but it does fit perfectly as a three. It is entirely possible that we could yet see one more high before it is over; the final fifth wave of the ending diagonal for micro wave C may still be incomplete. In the very short term, a new low below the small bright aqua blue trend line would indicate a likely end to minuette wave (ii).
A new low below 1,120.23 would increase probability that minuette wave (ii) is over. 1,120.23 is the start of submicro wave (5) within the ending diagonal of micro wave C, and a new low below the start of the fifth wave may not be a correction within that fifth wave, so at that stage there is confirmation the fifth wave must be over.
Finally a new low below 1,116.02 would provide stronger confirmation. 1,116.02 is the start of subminuette wave y and I would not expect subminuette wave y to continue further sideways as a flat correction because that would mean a breach of the pink trend line, and this second wave correction should remain contained within this channel.
To the upside, if minuette wave (ii) is not quite complete and price comes up to touch the upper edge of the pink channel, then that should provide strong resistance. That channel should not be breached. I would expect Gold to be in the early stages of a third wave down at that stage.
When the small bright aqua blue trend line is breached price may then throwback to that line, to find resistance. If that is how price behaves, then that may offer a good entry point.
At 1,096 minute wave c would reach equality in length with minute wave a. This would see minor wave 2 reach down to the normal range for a second wave within a diagonal, between 0.66 to 0.81 the length of the first wave which here is 1,105 – 1,091.
Minuette wave (ii) may not move beyond the start of minuette wave (i) above 1,148.04.
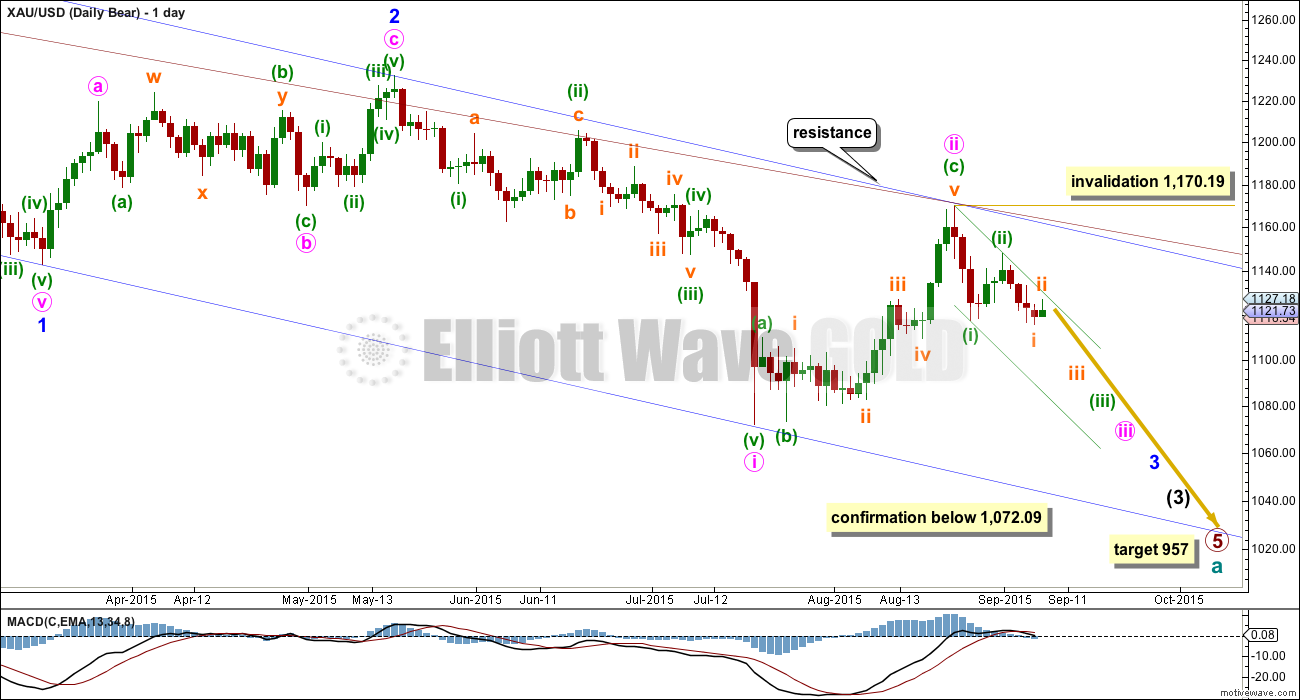
BEAR ELLIOTT WAVE COUNT
Click chart to enlarge.
At this stage, the reduction of probability for the bull wave count sees this bear wave count about even now in probability.
This wave count now sees a series of four overlapping first and second waves: intermediate waves (1) and (2), minor waves 1 and 2, minute waves i and ii, and now minuette waves (i) and (ii). Minute wave iii should show a strong increase in downwards momentum beyond that seen for minute wave i. If price moves higher, then it should find very strong resistance at the blue trend line. If that line is breached, then a bear wave count should be discarded.
The blue channel is drawn in the same way on both wave counts. The upper edge will be critical. Here the blue channel is a base channel drawn about minor waves 1 and 2. A lower degree second wave correction for minute wave ii should not breach a base channel drawn about a first and second wave one or more degrees higher. If this blue line is breached by one full daily candlestick above it and not touching it, then this wave count will substantially reduce in probability.
Minuette wave (ii), if it were to continue, may not move beyond the start of minuette wave (i) above 1,170.19. A breach of that price point should see this wave count discarded as it would also now necessitate a clear breach of the blue channel and the maroon channel from the weekly chart.
Full and final confirmation of this wave count would come with a new low below 1,072.09.
If primary wave 5 reaches equality with primary wave 1, then it would end at 957. With three big overlapping first and second waves, now this target may not be low enough.
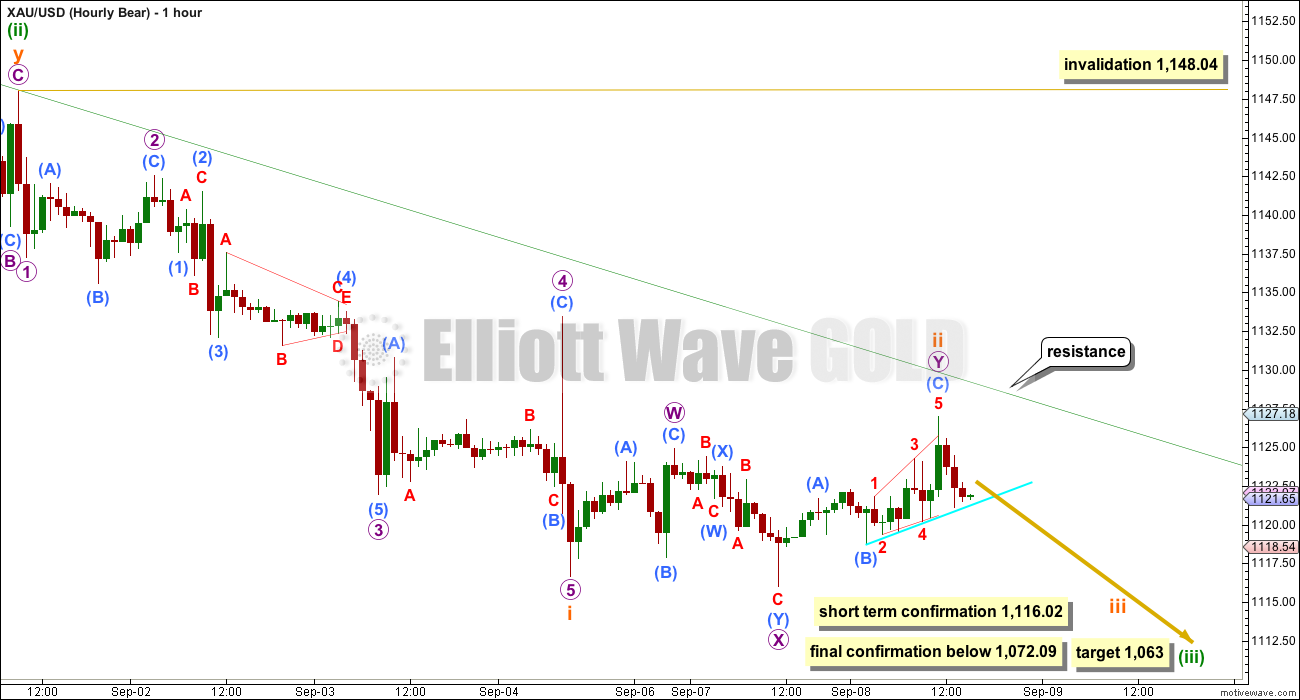
Click chart to enlarge.
This wave count expects an impulse to be beginning downwards. An impulse subdivides 5-3-5-3-5. So far the first 5 down is complete.
The beginning of an impulse and the whole of a zigzag have exactly the same subdivisions.
In the short term, the structure for this downwards movement is seen in exactly the same way as that for the hourly bull wave count. The big difference to note for the bear wave count is Gold may now be entering the middle of a third wave at five wave degrees. This bear wave count expects to see a strong increase in downwards momentum. If the target at 1,063 is wrong, then it may not be low enough. Expect any surprises to be to the downside.
When price moves towards the fifth wave at the end of minuette wave (iii) that is when I would expect to see very swift strong downwards movement. We may see another price shock to move price swiftly lower at the end of this wave like that seen for the end of minute wave i (see this on the daily chart) which ended on 20th July.
Subminuette wave ii may not move beyond the start of suminuette wave i above 1,148.04.
The target for minuette wave (iii) remains the same. At 1,063 it would reach 1.618 the length of minuette wave (i).
TECHNICAL ANALYSIS
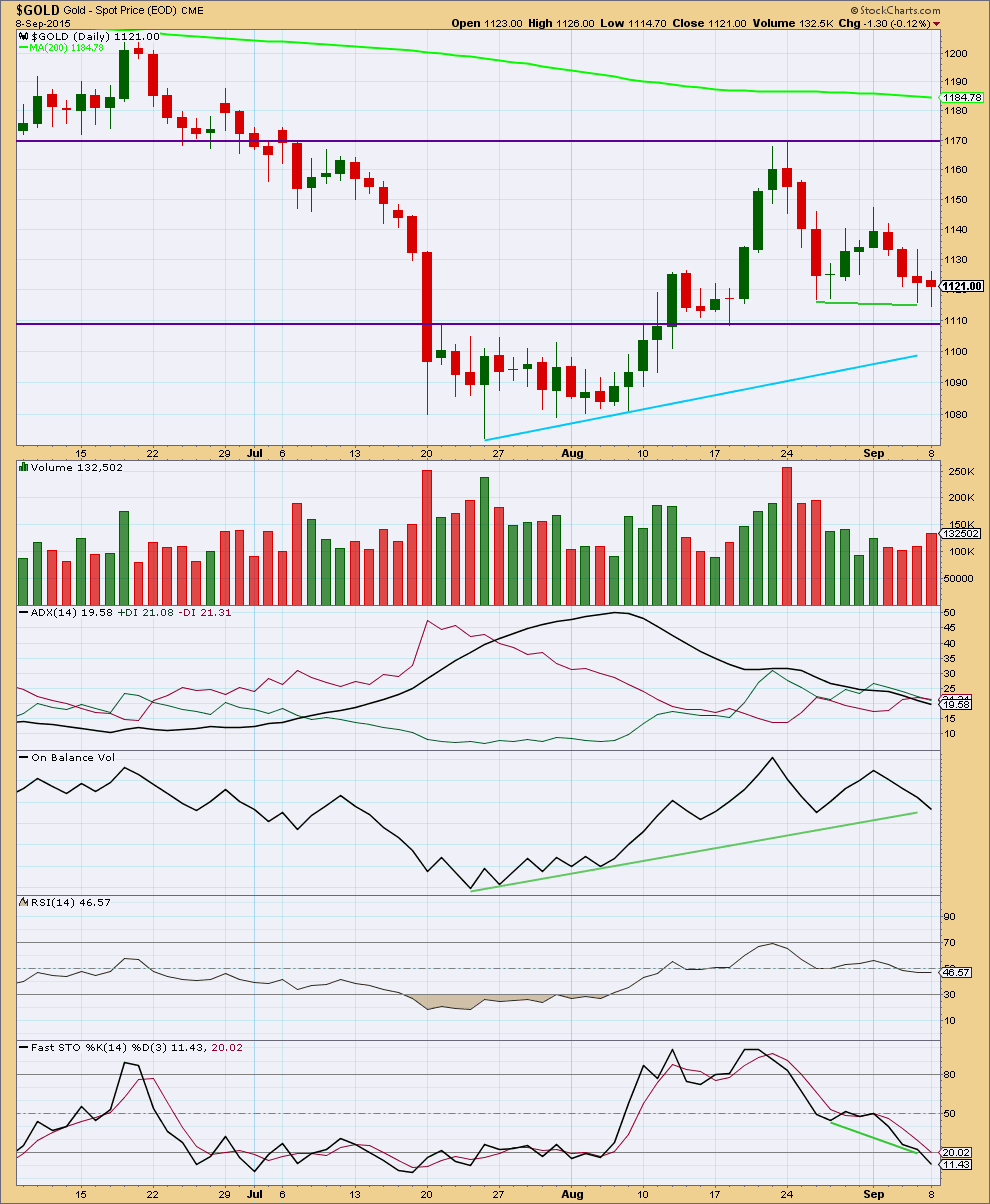
Click chart to enlarge. Chart courtesy of StockCharts.com.
Now there are red candlesticks on increasing volume for two days in a row. This supports both Elliott wave counts, so more downwards movement is likely.
The one thing that is clear from volume is the strongest day most recently was the strong downwards day of 24th August. This may be an indication that Gold should move lower.
ADX continues to indicate the market is not yet in a clear trend while the black ADX line points down.
A shorter held trend line on On Balance Volume has not yet been reached at the daily chart level. When On Balance Volume reaches that line then it may find some support. If it breaks through, then that would be strong bearish indication. OBV is pointing lower today which does provide some support to the fall in price. There is no divergence. OBV agrees with the price direction.
Stochastics has not yet reached oversold territory, so a further fall in price may be expected to be seen at least in the short term until Stochastics reaches oversold territory.
The picture at the daily chart level is mixed and unclear, but very slightly favours the bear wave count over the bull.
This analysis is published about 04:58 p.m. EST.
I don’t think a five down is quite yet complete. It may be in a small fourth wave correction then one final fifth wave down.
Either way, if the five down is over or not quite over it will be followed by a larger correction. For the bull this will be minuette (iv) which can’t move back up into minuette (i) territory above 1,116.67.
For the bear it is more likely another second wave correction to come. It may be more brief and shallow than second waves normally are because we’re getting close now to the middle of a big third wave. But it may still be deep. It’s invalidation point is at 1,126.96.
For both bull and bear the correction to come may show up on the daily chart. More likely for the bull so that minute c has a five wave look. For the bear it may not.
The trend is down. Volume on FXCM data is increased today which supports this downwards move. I won’t have access to Stockcharts volume data for a while.
Stockcharts data has very strong volume, huge, for today.
I wonder if this will disappear? I’ve seen that happen with Stockcharts volume data once before.
If this can be trusted it’s very bearish indeed!
On Balance Volume has broken it’s trend line. The picture today looks extremely bearish.
Look out for any surprises to be to the downside!
I’m not expecting the current correction to get past 1111. That would complete a small .382.
Matt, on daily bull or daily bear?
I was thinking in terms of the hourly bear.
For the record, I will remain a bear until gold at least breaks 1000. Just can’t take a bull count seriously until then.
Lara, congratulations on your EW analysis! Gold showed itself today.
Do you think we are entering a subminuette (orange) correction or Minuette (green) correction?
I don’t think it’s a minuette correction yet. See my comment above.
I am out of DWTI with a $19/share gain. Added some JDST today, looking for Lara’s update. Miner volume isn’t very heavy today yet.
Looks like an all day sentiment swing, movement of the herd out of miners.
Gold if my wave count is correct looks to have had a 7 hour $21 fifth wave down today to low of $1,101.36 at 12:47 pm.
One of the fast, strong and curved 5th waves Lara advised us of.
Any chance this bearish gold run could continue down to $1,096 target or is a retrace due now and how high?
Hi Richard. It was worth the wait for Gold price to eventually break below 1116-15…. whew…. Not sure how far up this will go with Gold price getting rejected at 1108 but anything under 1115 would be good with 1121-22 on the outside. Lara’s update should be interesting to wait for…. 🙂
Not sure if there is a fundamental reason for this but it seems (probably just perception) that during a bear decline selling happens before the open (London?) and trades flat during US hours.
Gold is down on mediocre volume, while miners are firm and some opened up. This is not what I would expect for a third wave in the bear scenario.
that’s what threw me off and caused me to set my stop too high. Got stopped out of my puts too early. Very nice follow through came afterwards
I think that gold may have just completed a five wave down at 9:36 am and may bounce up now?
Will it be a 3 wave count retrace back up from today’s low of 1,109.47 at 10:08 am?
1126.83 high at 11:18 am Tuesday
-1,109.47 low at 10:08 am today
= 17.36 x .618 = 10.73 + 1109.47 = 1,120.20 gold retrace high possible target.
Any comments for retrace gold next high and DUST next low target?
Darn, was hoping this would hold up until the open. Now bull target is not that far away and would take on added risk to add here (unless it is the bear count)
Now gold trading below 1120.23. Wave ii c must be done!!!!!
Hard to see as yet Gold price break below 61.8% of monthly H 1169 / L 1080 coming in at around 1114 holding subject to a break below 1118-1116…. Upside 1125-26 may be restraining for now but with 1120-1118 holding, looks like a break above here will eventually likely seek a break above 1128 (10dma) and 1130-31 (20dma)…..
Syed, I didn’t buy DUST today perhaps it may be cheaper Wednesday. Thank you.
Hello Richard. One will probably have to be patient and wait and see how Gold price plays out over the next few days. It is becoming a little irksome though Gold price inability to break below 1116-15…. I wouldn’t know about DUST or any other….. Good luck~!
Syed thanks. I’ve been patient beyond belief. I want gold to be up at the open so DUST is cheap. Looking to buy a little DUST Wednesday to hold and then day trade a little DUST daily buy low, sell high using indicators. I’ll take whatever comes daily. Hopefully the grizzly bears will toss the bulls out of the way on the way down.
Richard. Me too.
I was still holding out for the 5th wave of micro c since DUST had not reached my target yesterday (now slightly adjusted to 26.54).
DUST closed at 28.81. If it breaks below 28.58 today,
then it will head for 26.54 next. If not, then gold SM2 had ended, and I would have no choice but to buy DUST when it first rises.
Moreover, on the daily chart, DUST showed a doji yesterday (after rising from 24.07 for the past five days). This indicates that a drop is in order, today.
Let’s hope it plays out. DUST would be cheaper to buy then.
Alan thanks for your guidance. Good luck to your getting DUST cheap.
just in case
http://stockcharts.com/def/servlet/SharpChartv05.ServletDriver?chart=$gold,uu%5Bw,a%5Ddaolyyay%5Bpc55!c233!f%5D%5Bvc60%5D%5Biut!ub14!la12,26,9%5D&r=5739
4 days of red rising volume
I tried the link and it doesn’t work?
Hi Richard, I really detest upgrading anything, sorry. I posted a screen shot above. No idea why I can still get the old version but it seems to have fresh data before v2 does.
It is the same chart Lara has in her TA section above in the report.
Same instrument (spot eod cme) but I wouldn’t be surprised if some numbers didn’t line up