
Downwards movement unfolded as expected for both Elliott wave counts.
Confirmation that a small correction was over came with a break below the short trend line on the hourly chart, and final confirmation with a new low below 1,116.02.
Summary: Markets rarely move in straight lines. I expect the trend at least short term is down for both bull and bear wave counts with corrections along the way. In the short term, use the best fit channel on the hourly chart. If price breaks above the channel, then a deeper correction may have begun which may even show on the daily chart. But short term, what is more likely, price will remain within the channel and keep going down. The target for the bull for this to end is 1,096. For the bear the middle of a big third wave may be beginning, so look out for strong downwards movement to continue overall for weeks. Because today has a strong volume spike, I slightly favour the bear wave count. Please take the implications of a continuing bear market and strong downwards movement ahead very seriously.
Changes to last analysis are bold.
To see weekly charts and the three different options for cycle wave b (bull wave count) click here.
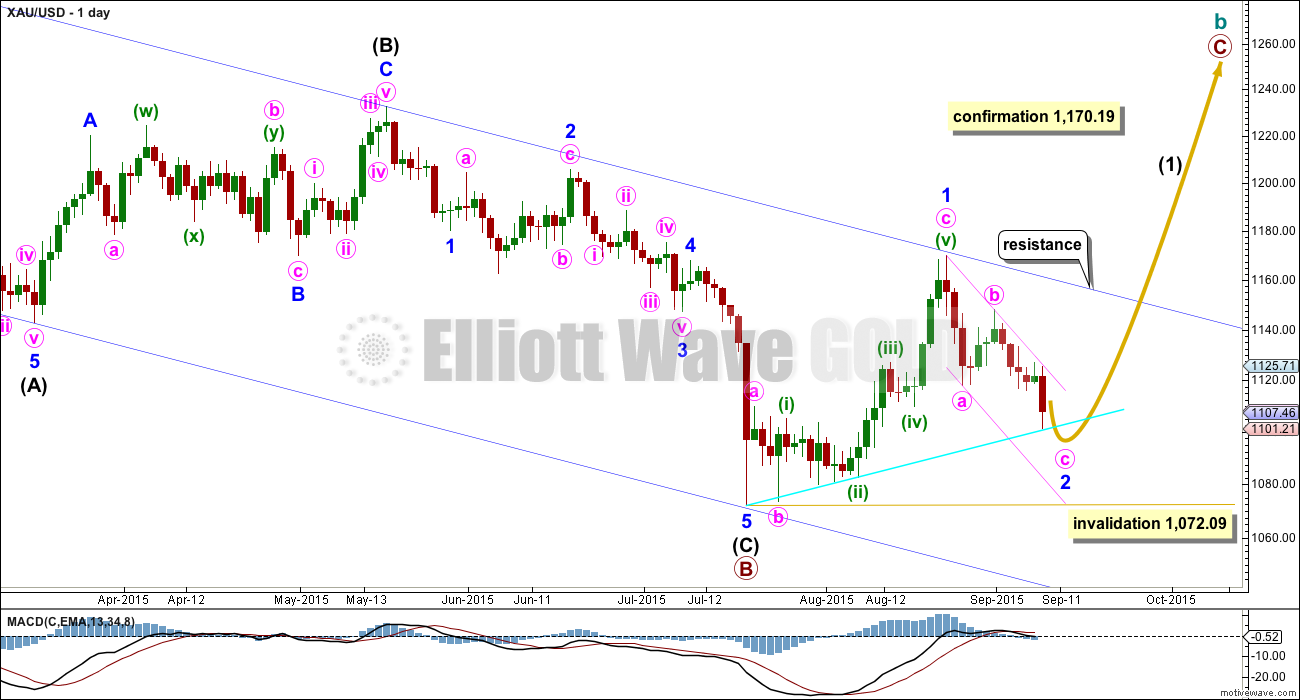
BULL WAVE COUNT – DAILY
Click chart to enlarge.
The bigger picture at super cycle degree is still bearish. A large zigzag is unfolding downwards. Along the way down, within the zigzag, cycle wave b must unfold as a corrective structure.
At this stage, there are three possible structures for cycle wave b: an expanded flat, a running triangle, or a combination.
This daily chart works for all three ideas at the weekly chart level.
For all three ideas, a five up should unfold at the daily chart level. This is so far incomplete. With the first wave up being a complete zigzag the only structure left now for intermediate wave (1) would be a leading diagonal. While leading diagonals are not rare they are not very common either. This reduces the probability of this bull wave count now to about even with the bear wave count.
A leading diagonal requires the second and fourth waves to subdivide as zigzags. The first, third and fifth waves are most commonly zigzags, the but sometimes may appear to be impulses. So far minor wave 1 fits well as a zigzag.
Minor wave 2 may not move beyond the start of minor wave 1 below 1,072.09. If this invalidation point is breached, then it would be very difficult to see how primary wave B could continue yet lower. It would still be technically possible that primary wave B could be continuing as a double zigzag, but it is already 1.88 times the length of primary wave A (longer than the maximum common length of 1.38 times), so if it were to continue to be even deeper, then that idea has a very low probability. If 1,072.09 is breached, then I may cease to publish any bullish wave count because it would be fairly clear that Gold would be in a bear market for cycle wave a to complete.
To the upside, a new high above 1,170.19 would invalidate the bear wave count below and provide strong confirmation for this bull wave count.
Upwards movement is finding resistance at the upper edge of the blue channel and may continue to do so. Use that trend line for resistance, and if it is breached, then expect a throwback to find support there.
In the short term, use the smaller pink channel drawn about the zigzag of minor wave 2 using Elliott’s technique for a correction as shown. Copy this channel over to the hourly chart. This channel is also drawn in the same way for the bear wave count, and there it is correctly termed a base channel. Both wave counts should expect upwards corrections for the short term to find resistance at the upper edge of this smaller channel.
I added a bright aqua blue trend line today to this chart to be the same as the trend line on the technical analysis chart. Price has found support there and is bouncing up. I expect this trend line to be breached, and if that happens, then look for a throwback to it. Throwbacks to trend lines can provide perfect entry points when you are confident of the trend, and they also provide some confirmation of an expected trend.
Click chart to enlarge.
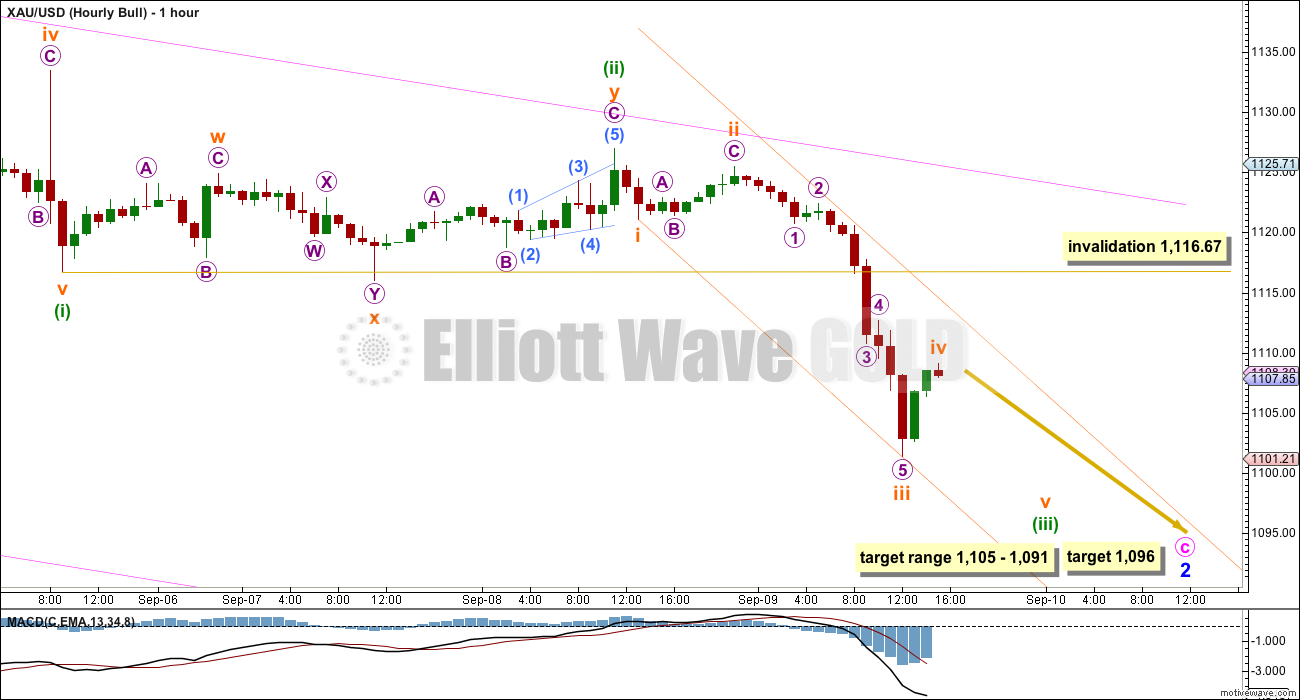
The bull wave count expects the middle of a third wave has just passed. Minute wave c must subdivide as a five wave structure, and is unfolding as an impulse.
Today I will use the two hourly charts to present two different ways of seeing this downwards movement. The scenario presented here for the hourly bull count has a better overall look. I have more confidence this is correct. It sees an impulse downwards not yet complete which still requires the fourth and fifth waves to unfold.
For this bull wave count, if minuette wave (iii) reaches equality in length with minuette wave (i), then the target would be at 1,096. This is also exactly where minute wave c would reach equality in length with minute wave a.
For the bull wave count, minuette wave (ii) shows up on the daily chart as three green candlesticks. So that minute wave c has a clear five wave look to it at the daily chart level, it may also be that minuette wave (iv) to come may show up on the daily chart. When minuette wave (iv) arrives it may last one to four days. Minuette wave (ii) was a shallow 0.328 double zigzag. Minuette wave (iv) may be deep and is most likely to be a flat, combination or triangle.
Minuette wave (iii) should remain contained within the best fit channel drawn here in the same way on both hourly charts. Only if this channel is breached by upwards movement, then would I expect that minuette wave (iii) is over and minuette wave (iv) has arrived. While price remains within the channel expect the short term trend to remain down.
Minuette wave (iv) may not move into minuette wave (i) price territory above 1,116.67.
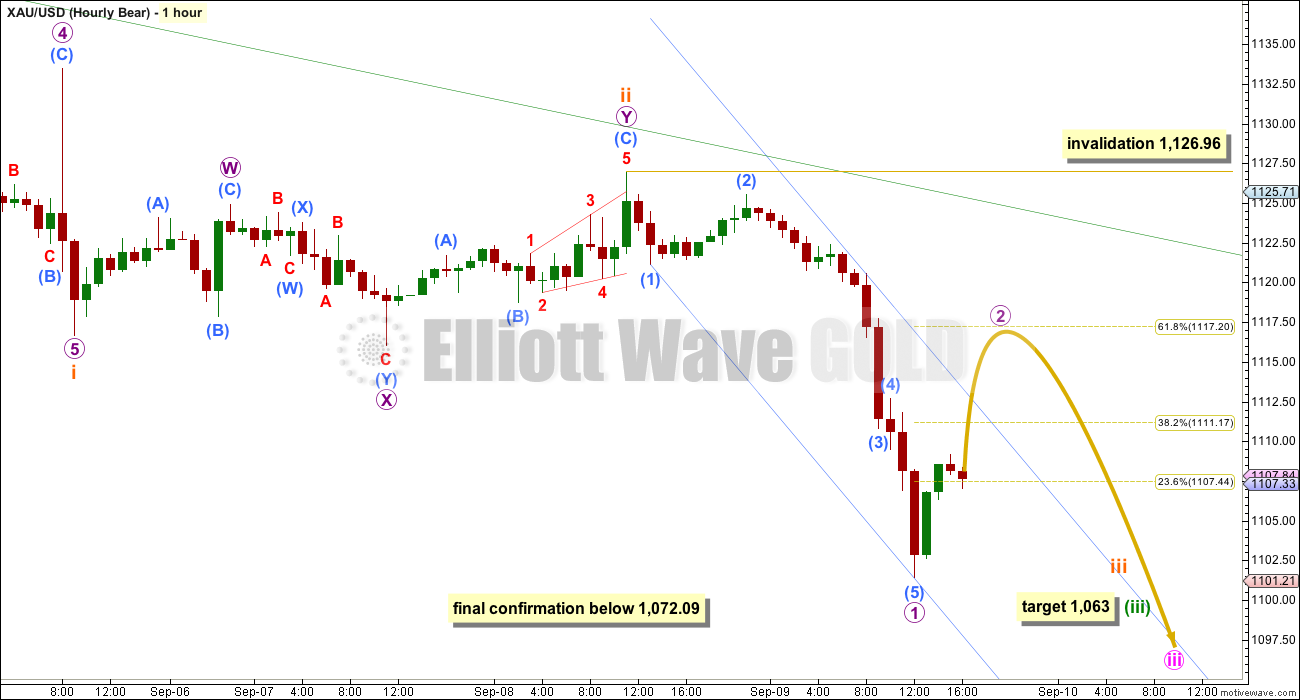
BEAR ELLIOTT WAVE COUNT

Click chart to enlarge.
At this stage, the reduction of probability for the bull wave count sees this bear wave count about even now in probability.
This wave count now sees a series of four overlapping first and second waves: intermediate waves (1) and (2), minor waves 1 and 2, minute waves i and ii, minuette waves (i) and (ii), and now subminuette waves i and ii. Minute wave iii should show a strong increase in downwards momentum beyond that seen for minute wave i. If price moves higher, then it should find very strong resistance at the blue trend line. If that line is breached, then a bear wave count should be discarded.
The blue channel is drawn in the same way on both wave counts. The upper edge will be critical. Here the blue channel is a base channel drawn about minor waves 1 and 2. A lower degree second wave correction for minute wave ii should not breach a base channel drawn about a first and second wave one or more degrees higher. If this blue line is breached by one full daily candlestick above it and not touching it, then this wave count will substantially reduce in probability.
Minuette wave (ii), if it were to continue, may not move beyond the start of minuette wave (i) above 1,170.19. A breach of that price point should see this wave count discarded as it would also now necessitate a clear breach of the blue channel and the maroon channel from the weekly chart.
Full and final confirmation of this wave count would come with a new low below 1,072.09.
If primary wave 5 reaches equality with primary wave 1, then it would end at 957. With three big overlapping first and second waves, now this target may not be low enough.
Click chart to enlarge.
This wave count expects an impulse to be beginning downwards. An impulse subdivides 5-3-5-3-5. The beginning of an impulse and the whole of a zigzag have exactly the same subdivisions.
I am labelling this downwards movement a little differently on this hourly chart. Both ideas work in the same way for both wave counts.
A five down may be incomplete as per labelling on the bull, or it may already be over as per labelling here. I think that the labelling on the bull chart is more likely.
If a five down is complete, then it should be followed by a three up. For the bull wave count, the structure would be minuette wave (iv). For the bear wave count, the structure would be another second wave correction.
Only if the best fit channel is clearly breached by upwards movement, then in the next 24 hours would I expect the correction has arrived.
Second wave corrections are normally deep and the 0.618 Fibonacci ratio is usually a reasonable target. In this instance though it may not turn out to be that deep because the middle of a big third wave is getting close. Expect any surprises to be to the downside. Micro wave 2 may show on the daily chart, but it may not. Micro wave 2 could be more brief and shallow than second waves usually are, and may not move beyond the start of micro wave 1 above 1,126.96.
The target for minuette wave (iii) remains the same. At 1,063 it would reach 1.618 the length of minuette wave (i).
TECHNICAL ANALYSIS
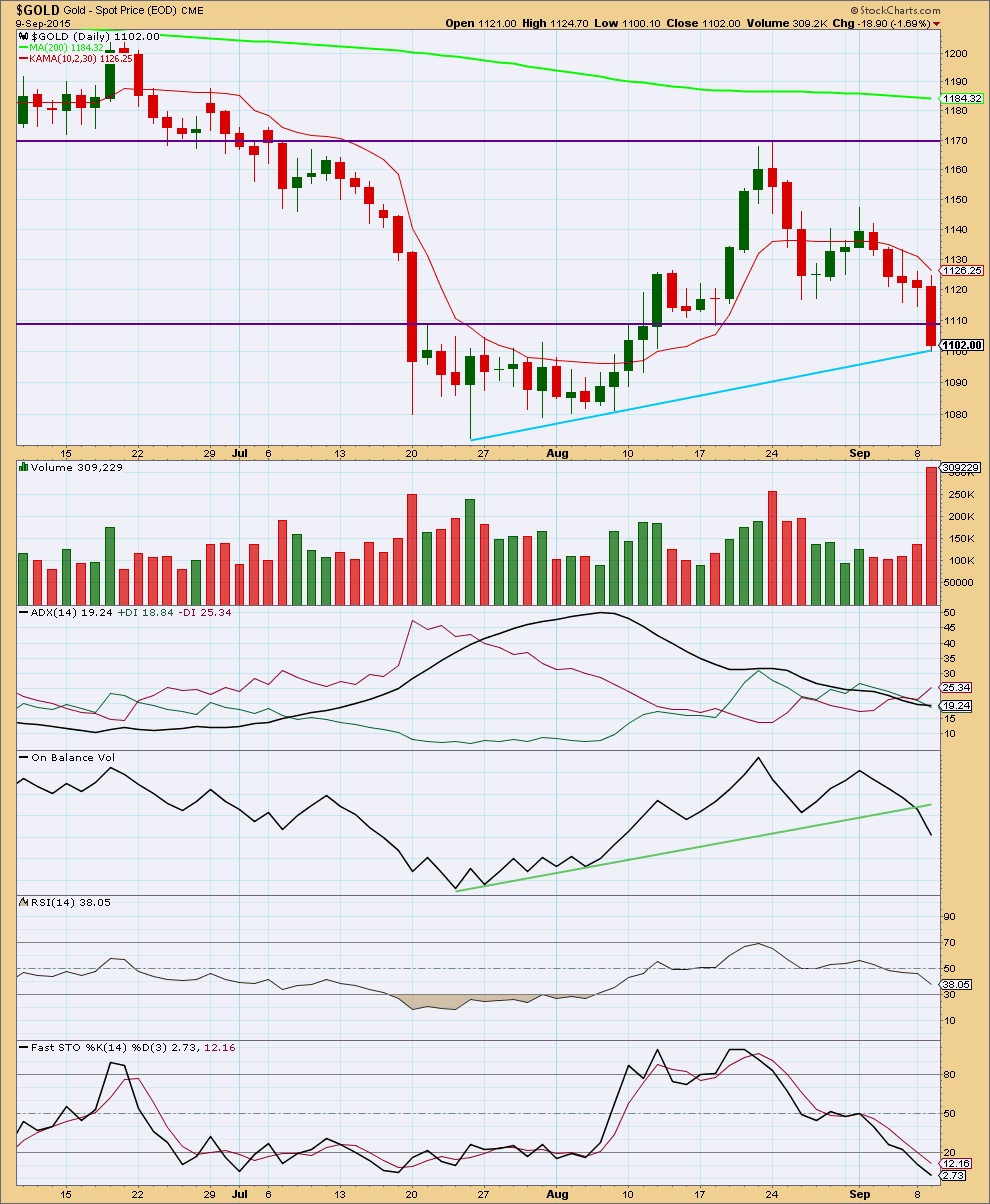
Click chart to enlarge. Chart courtesy of StockCharts.com.
The biggest thing to note is the huge volume spike for today’s down day. This is very bearish and supports the bear wave count over the bull. The fall in price is well supported by volume.
On Balance volume has broken below its trend line. This too is very bearish. OBV works well with trend lines and this one is reasonably long held.
ADX is lagging, and does not show any clear trend yet. Because volume is so strong today and has been rising for four days in a row, now as price falls on balance I would expect there is a downwards trend and ADX is slow to show it. Although ADX indicates the market is still range bound, I do not trust this indicator today. I expect ADX will show a downwards trend in a few more days. However, depending upon your risk appetite and the level of caution you apply to your approach to this market, you may choose to wait until ADX is clearer before having confidence in a downwards trend.
Price has broken below the horizontal purple support line and Stochastics indicates oversold. While ADX indicates no clear trend a range bound system would now expect upwards movement from here. But with volume indicating the potential for a new downwards trend this may be the point of a breakout, and this system may not work in this instance. I would not recommend having any confidence that a reasonable upwards swing should develop from here.
If there is a new downwards trend, then Stochastics can remain oversold for some time. Oscillators are not particularly useful in trending markets, so moving averages should be used instead. I have added Kaufman’s moving average (close red line). While price remains below this average expect the downwards trend is in place. This average may work well to show potential entry points each time price comes up to touch it, although some small overshoots can also be seen from time to time so it is not exactly perfect. In a trending market moving averages or trend lines of resistance (for a downwards trend) can also provide a guide as to where to place stops which can be moved as the trend continues. Always allow for some overshoot.
Price has come to touch the bright blue trend line drawn here. When this line is breached look for a throwback. Throwbacks to trend lines which previously provided support or resistance offer excellent entry points to join a trend, and again stops can be set just beyond the line (always allow for some overshoot).
This analysis is published about 05:29 p.m. EST.
The triangle did not hold. This correction is now looking more like a second wave than a fourth wave. The invalidation point is 1,126.96.
I can see a complete zigzag structure up on the hourly chart, the B wave was a nice contracting triangle. The A and C waves are somewhat close to equality (but not close enough to say they have a ratio of equality.)
A channel can be easily drawn about this upwards movement. When that channel is clearly breached by downwards movement it shall provide some confirmation the second wave is over and a third wave down has begun. Price may throwback to the lower trend line.
Lara: will gold still move to $1117 to complete wave 2?
I don’t think so. The zigzag for a second wave looks now to be complete.
A new low below the end of the B wave triangle at 1,106.19 would provide some price confirmation it’s over. At that stage downwards movement may not be a second wave correction within the C wave, so the C wave would have to be over.
That would also necessitate a breach of a channel which can be drawn to contain this correction.
GDX getting ready for a big move down or a break out of the channel.
http://goldtadise.com/?p=350959
Lara: What is Kama line ?? Do u have experience with it????
Google Kauffmans Adaptive Moving Average
AFAIK it’s used in the same way as any other moving average.
Kaufman developed it to be more responsive than an EMA.
Is It Better To Be “Insane” Or A “Nerd” When It Comes To Metals? Tuesday September 08, 2015 15:55 – Avi Gilburt EW
http://www.kitco.com/commentaries/2015-09-08/Is-It-Better-To-Be-Insane-Or-A-Nerd-When-It-Comes-To-Metals.html
Gold futures look set to snap string of losses – Sept 10, 2015 11:05 a.m. ET
http://www.marketwatch.com/story/gold-prices-nudge-up-aims-to-snap-losing-streak-2015-09-10
Is micro wave 2 over????
I think so. But we don’t have confirmation yet.
So is this 4th wave a combination???
Any ideas out there???
Or was the correction a zigzag, and now the much anticipated flush down for the bear count???
It looks like a zigzag so far. The correction might not be over.
thanks fence, looking to add more dust at the bottom
Since the B wave of this 2nd wave correction already contained a triangle, as Lara explains above, it is less likely that another one is forming now.
I am definitely bearish on all time frames and am positioned to take further advantage of it. That said, in the very short term, I am just going to wait for gold to break below 1106. The only risk I see is that gold corrects to 1117 area from here, but drops right after.
The fact that gold is hanging in there indicates to me that this correction is not over. However, I can’t quite tell what form it is. Right now I am thinking that this is a small 4th wave within a C wave. While gold spiked nicely that could have been a 3rd wave.
I’m expecting a final 5th wave to end this correction.
The correction could just as easily be over too. I’m not good at counting on tiny levels.
I’m short from much higher up, so I am just waiting this one out. Any further correction should be minor (a few dollars at best).
matt, are you leaning toward bear count?
Perhaps a triangle is forming a small 4th wave? The .618 target (1117.20) on the hourly bear could end this correction.
US oil 4 hour chart shows support at 43.30 area. Once this support is broken to downside oil can trade down.
However oil has developed a trading range from recent bottom to recent top.
I love it to trade long/short side during this sideway movement.
On weekly chart oil show bullish reversal with engulfing or hammer. Plus has bullish divergence on oscillators.
Lara: what is expected duration of wave 2 completion?
I can see what may be a triangle unfolding, if the triangle holds it would be a B wave within a zigzag. The breakout would be up.
If the triangle doesn’t hold then I would still expect this is wave B within a zigzag. It may morph into a combination.
I really can’t make a reasonable prediction about how long intermediate (2) will last. Within primary 3 down (the last big move for Oil) the intermediate corrections lasted only about 4 days. This one is much longer in duration, it’s surprising. It’s ending it’s 13th day. Another 8 days would see it last a Fiboancci 21…. but that really does seem to be too long in duration.
I’d really expect it to end in another few days.
When the B wave is clearly over I’ll draw a channel about the zigzag. When the channel is breached and only then will I have any confidence that intermediate (2) is over for Oil and the third wave down has begun.
Interesting chart
Although sideways movement has breached the best fit channel I have drawn on the hourly charts, so far it looks like a triangle which may have just completed wave C.
If a triangle unfolds it could be a fourth wave as per the scenario on the hourly bull wave count. Look to see if the sideways movement fits the rules for a contracting triangle; each wave needs to not move beyond the end of the prior wave in the same direction.
Questioning If We Break $1,000 Gold – Avi Gilburt – EW – Sept 5th for members
http://news.goldseek.com/GoldSeek/1441804140.php
How Market Sentiment works…
Thank you for posting that! Love it.
Hi Lara. Have yet to read in depth but noticed the volume spike was factored in to the analysis. I recall this happened in the past with Stockcharts, a huge volume bar was shown at the usual time and then adjusted later in the day. That has happened today again. Volume is trending higher but did not spike. If you check Stockcharts now you’ll see the adjusted volume
I’m seeing it too at 161609
Thank you very much Lara for this excellent Gold analysis,
just a thought on Oil, really fits well in this triangle,… can we expect a break trough to the downside soon? Anyone?
No, the triangle looks like it may be a B wave within a larger zigzag. So the break out of it may be upwards.. if that view is correct.
Yes, I did notice that. And yes, we’ve seen it happen before.
Maybe it’s orders that were placed but eventually unfilled?
Anyway, no huge spike but we do have another increase in volume for four days in a row now. That’s pretty bearish.
Overall on balance I’d still slightly favour the bear wave count over the bull. But price will be the final determinator.