
Sideways / downwards movement was expected for both Elliott wave counts.
Price moved lower then retraced almost all of the loss to complete a hanging man candlestick pattern for the session.
Summary: Both wave counts have problems and price has not yet finally confirmed which one is correct. A new high above 1,170.19 would strongly favour the bull. A new low below 1,104.69 would strongly favour the bear.
New updates to this analysis are in bold.
BULL ELLIOTT WAVE COUNT
Click chart to enlarge.
I will present this bull wave count first because with the bear wave count breaching its trend channel the bull wave count now must increase in probability.
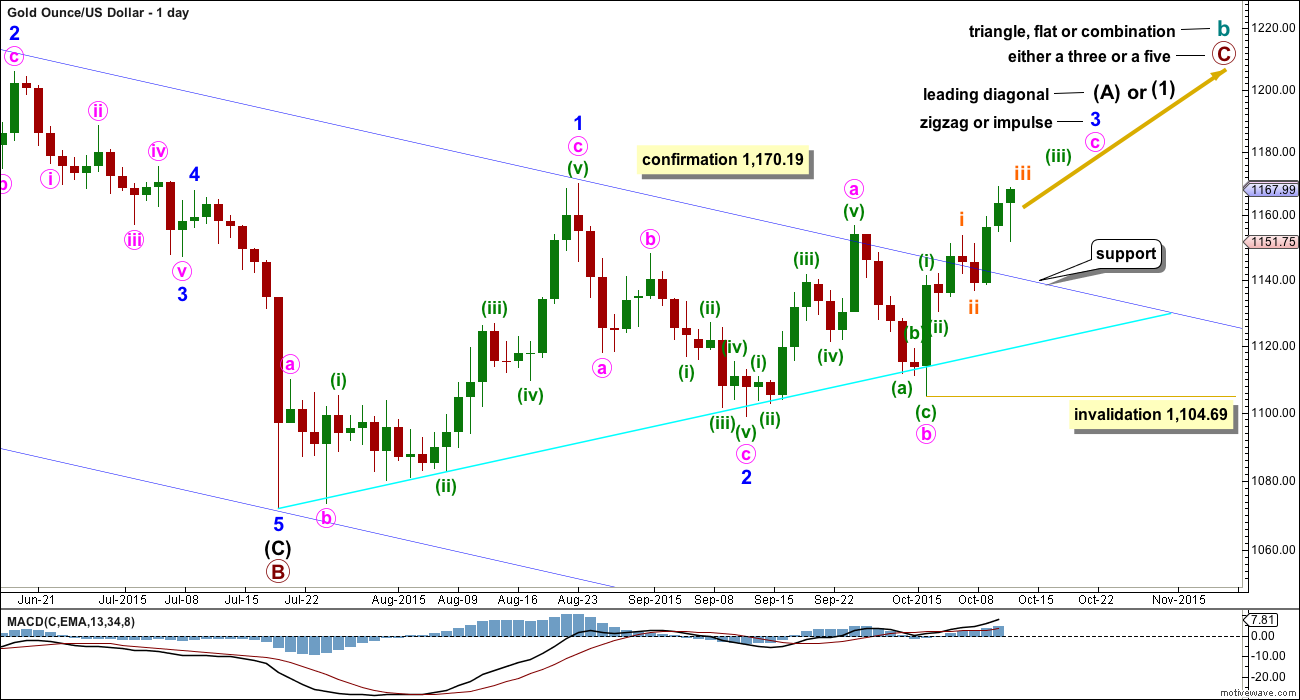
The bull wave count sees cycle wave a complete and cycle wave b underway as either an expanded flat, running triangle or combination. This daily chart works for all three ideas at the weekly chart level. To see the bigger picture on weekly charts click here.
For all three ideas, a five up should unfold at the daily chart level for a movement at primary degree. This is so far incomplete. With the first wave up being a complete zigzag the only structure left now for intermediate wave (1) or (A) would be a leading diagonal. While leading diagonals are not rare they are not very common either. This reduces the probability of this bull wave count.
A leading diagonal requires the second and fourth waves to subdivide as zigzags. The first, third and fifth waves are most commonly zigzags, the but sometimes may appear to be impulses. So far minor wave 1 fits well as a zigzag.
To the upside, a new high above 1,156.83 would invalidate the bear wave count and provide strong confirmation for this bull wave count.
Minor wave 2 can now be seen as a complete zigzag. It is 0.73 the depth of minor wave 1, nicely within the normal range of between 0.66 to 0.81 for a second wave within a diagonal.
Third waves within leading diagonals are most commonly zigzags, but sometimes they may be impulses. Minor wave 3 should show some increase in upwards momentum beyond that seen for minor wave 1. Minor wave 3 must move above the end of minor wave 1 above 1,170.19.
There now looks like a five up on the daily chart within minor wave 3. This may be minute wave a within a zigzag, or it may also be minute wave i within an impulse. It is difficult at this stage to see how minute wave b could continue any lower; it is likely to be over now as labelled. No second wave correction may move beyond the start of its first wave below 1,104.69 within minute wave c.
Click chart to enlarge.
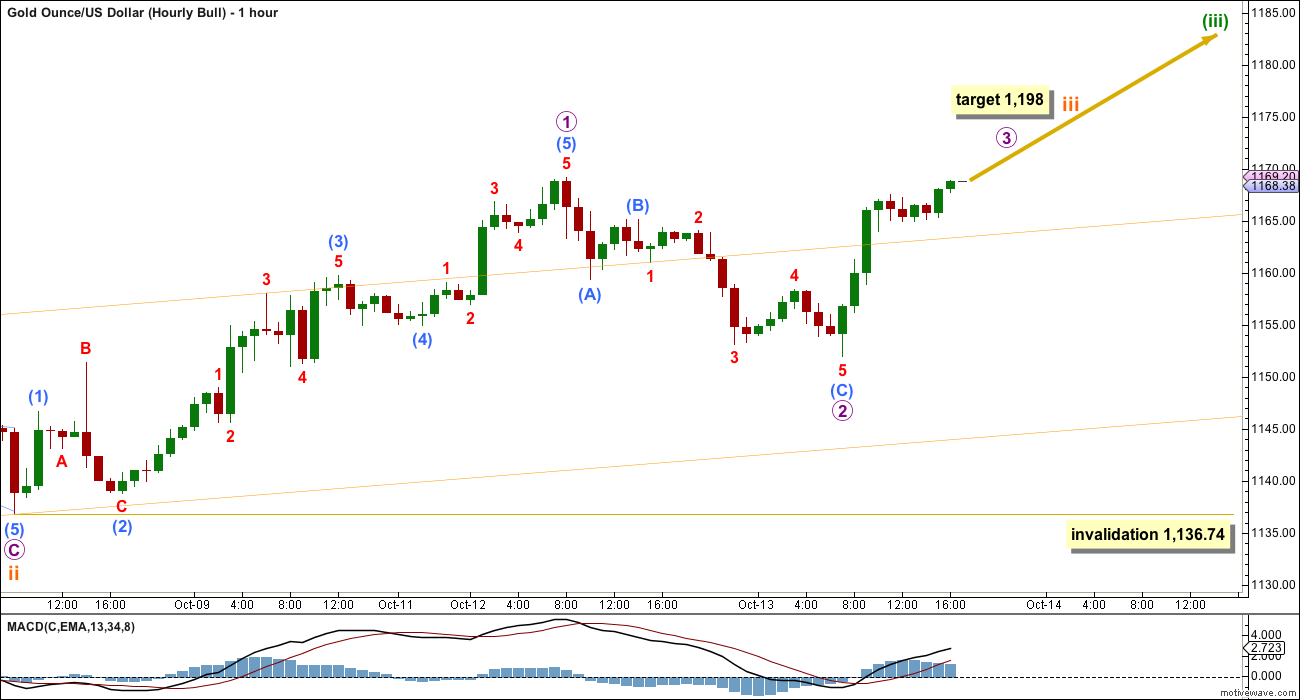
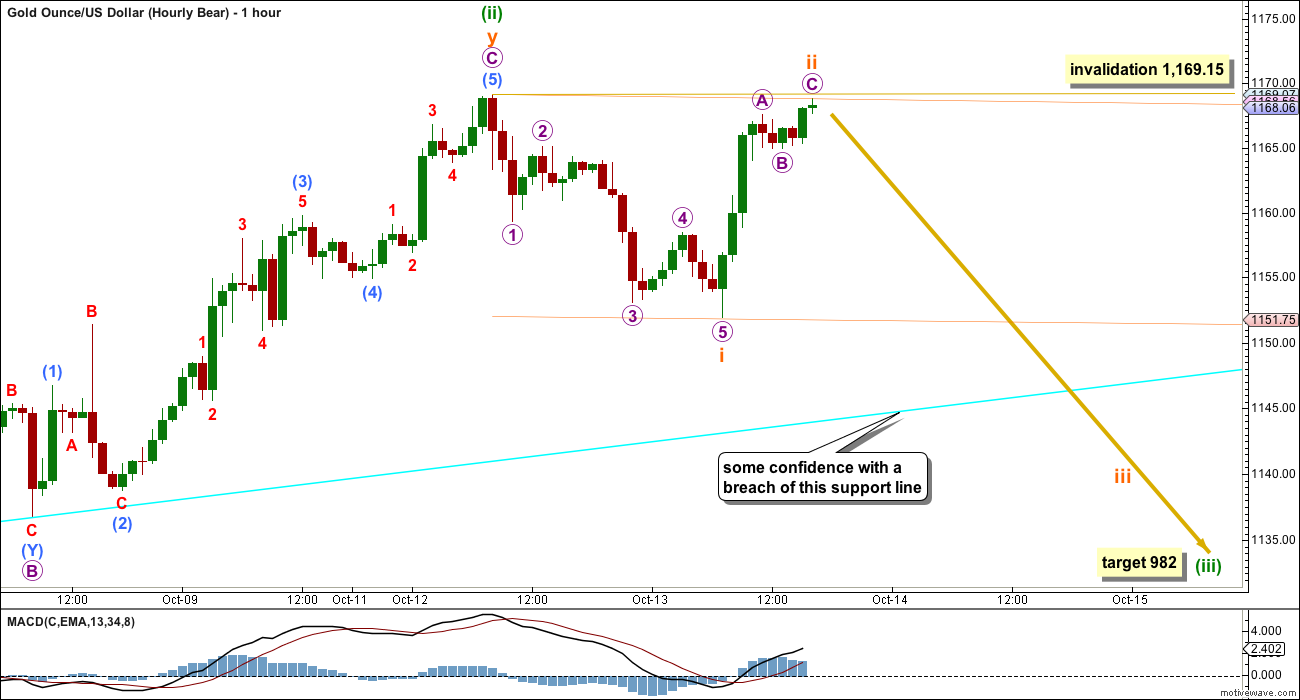
The hourly chart still focusses on the middle of minuette wave (iii) from the low of subminuette wave ii.
Downwards movement for Tuesday’s session moved back into subminuette wave i price territory, so this may not be subminuette wave iv. This means subminuette wave iii must be incomplete.
The degree of labelling within subminuette wave iii is moved down one degree. Only micro wave 1 would be complete. Downwards movement for Tuesday would be micro wave 2. If it continues further, it may not move beyond the start of micro wave 1 below 1,136.74.
Micro wave 2 will subdivide as a deep zigzag on the five minute chart. Micro wave 2 remains above the lower edge of the base channel about subminuette waves i and ii (orange trend lines).
The target for minuette wave (iii) is removed today and will be recalculated when subminuette waves iii and iv are complete. The next interruption to the trend for the bull wave count would be at the end of subminuette wave iii.
At 1,198 subminuette wave iii would reach 2.618 the length of subminuette wave i.
BEAR ELLIOTT WAVE COUNT
Click chart to enlarge.
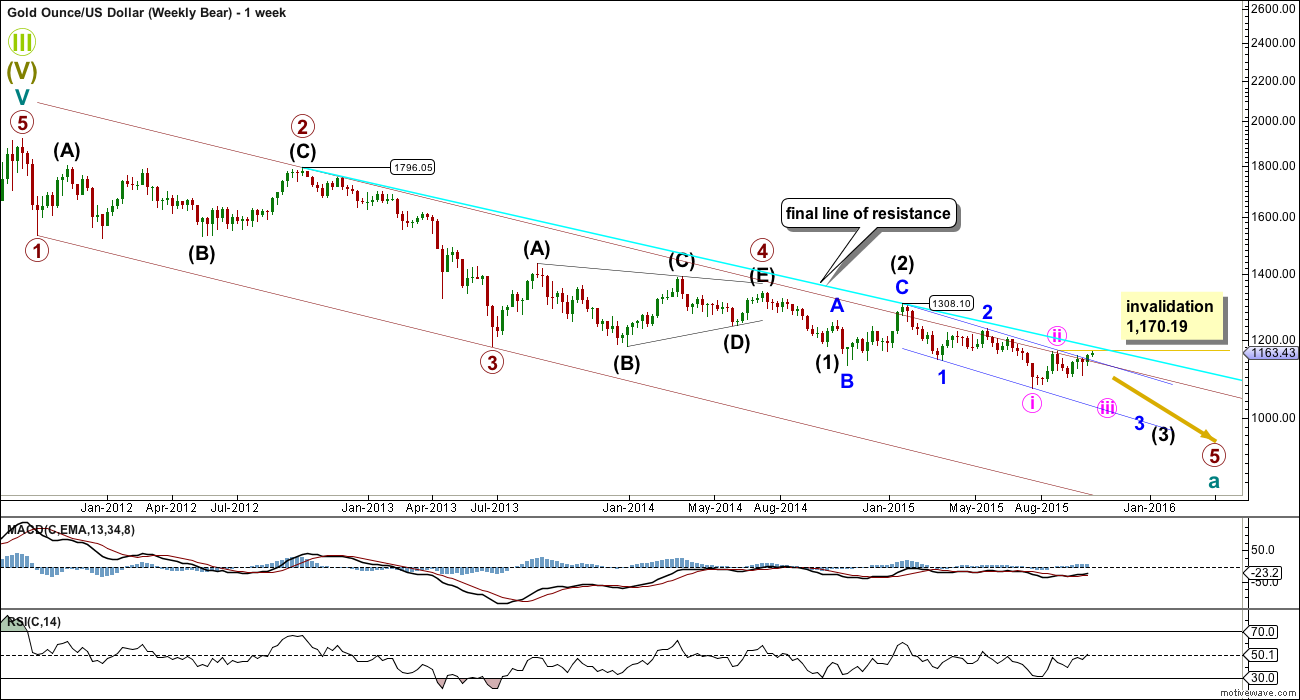
I publish the bear weekly chart today to illustrate the channels which need to be breached, and a final line of resistance which also should really be breached, in order to provide technical confirmation of a big trend change from bear to bull.
The wide maroon channel is drawn about this impulse using Elliott’s first technique: the first trend line is drawn from the ends of primary waves 1 to 3, then a parallel copy is placed in the end of primary wave 2. This channel is now breached two times (so far, the current week is incomplete and may not end in a breach) and overshot once. If this week ends with a breach of this channel, then it may be used to confirm a trend change.
A final line of resistance is added from the highs labelled primary wave 2 at 1,796.05 to intermediate wave (2) at 1,308.10. If that bright aqua blue line is breached, then it would provide full and final technical confirmation of a trend change from bull to bear. I may consider publishing a bear wave count as an addendum (with a low probability) while price remains below that trend line, if the Elliott wave count fits and makes sense.
If price breaks above 1,170.19, then another possibility for the bear would be to see minute wave ii continuing higher. That would see minute wave ii huge in duration though; it would look wrong at the daily chart level.
I have considered an ending diagonal for primary wave 5. It will not fit because the wave up labelled minor wave C of intermediate (2) will not fit as a zigzag (see video of 20th August for an explanation of this problem). I know other Ellioticians have wave counts which see this move as a three, but I do not know how they managed to do that and resolve the problem.
Click chart to enlarge.
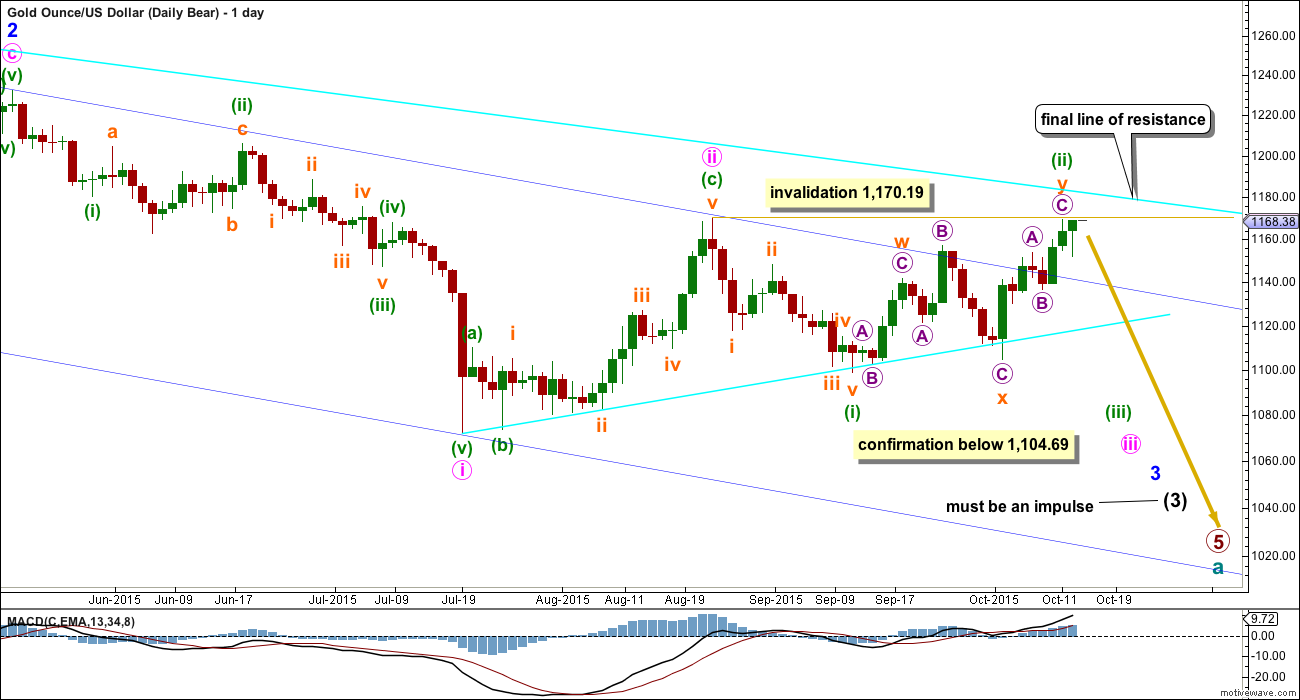
The bright aqua blue line is copied over from the weekly chart. When price gets up there, it should find some resistance. If that line is breached at the daily chart level with one full candlestick above it and not touching it, then that would be full and final invalidation of this or any other bear wave count.
This wave count now sees a series of five overlapping first and second waves: intermediate waves (1) and (2), minor waves 1 and 2, minute waves i and ii, minuette waves (i) and (ii), and now subminuette waves i and ii (on the hourly chart). Minute wave iii should show a strong increase in downwards momentum beyond that seen for minute wave i. The upper blue trend line is now breached on the daily chart which substantially reduces the probability of this wave count. Base channels almost always work to show where lower degree corrections find support or resistance, but almost always is not the same as always which means this wave count is still just technically possible. Base channels at this higher degree and higher time frame though really should work better than this. This wave count no longer has the right look.
If minuette wave (ii) continues any higher, then it may not move beyond the start of minuette wave (i) above 1,170.19.
Downwards movement from 1,170.19 will subdivide as a complete five wave impulse on the hourly chart, but on the daily chart it does not have a clear five wave look. Subminuette wave iii has disproportionate second and fourth waves within it giving this movement a three wave look on the daily chart.
Minuette wave (ii) is a double zigzag, with subminuette wave x an expanded flat correction. The subdivisions fit perfectly at the hourly chart level. However, this is a very deep second wave correction and it would be reasonable to expect the strong downwards pull from the middle of a big third wave to force this second wave correction to be more shallow and brief than this. The probability of this wave count is reduced.
Gold has the most textbook looking structures and waves of all the markets I have analysed over the years, probably due to the high volume of this global market. And so I am quite concerned with the look of minuette wave (i). Sometimes Gold has movements which don’t look perfect on the daily chart, but this is uncommon.
Sometimes Gold’s impulse waves start out slowly. There is a good example on this daily chart for minute wave i. When the fifth wave approaches that is when momentum sharply increases, and it often ends on a price shock with a volume spike. This is an even more common tendency for Gold’s third wave impulses. The strongest downwards movement is ahead, and it should be expected to arrive when subminuette wave v within minuette wave (iii) begins.
This bear wave count expects Gold is within a third wave at five wave degrees. Expect any surprises to be to the downside for this wave count. Because of the implications of this potential third wave, although this wave count now has a greatly reduced probability, I still want to publish it as a “just in case” while it remains technically viable (in terms of price). If downwards movement begins to unfold and shows a strong momentum and volume, then this would remain a viable explanation at this stage.
Within minuette wave (iii), subminuette wave ii now shows up very clearly on the daily chart. This was expected, and will give minuette wave (iii) the right look. Minuette wave (iii) may only subdivide as an impulse.
Full and final confirmation of this wave count would come now with a new low below 1,104.69.
I will remove the final target for primary wave 5 at this stage. If it were to reach only equality with primary wave 1 , then this wave count would end about 985. But it has begun with three big overlapping first and second waves, so the target no longer looks low enough. I will calculate a target for primary wave 5 to end at intermediate degree when intermediate waves (3) and (4) are complete. Primary wave 5 may not exhibit a Fibonacci ratio at primary degree.
Click chart to enlarge.
I checked the subdivisions of subminuette wave i on the five minute chart. I have found a solution where it will subdivide well as a five wave impulse. This downwards wave is ambiguous; it will subdivide as either a three wave zigzag or a five wave impulse. Both possibilities must be considered.
If subminuette wave i is a five wave impulse, then subminuette wave ii may not move beyond its start above 1,169.15.
The target for minuette wave (iii) remains the same. At 982 it would reach 2.618 the length of minuette wave (i). I am using this Fibonacci ratio for the target because of the depth of minuette wave (ii).
If price breaks above 1,169.15, then rather than seeing minuette wave (ii) continue as a very rare triple zigzag I would see minute wave ii continuing as a double zigzag. The invalidation point for that idea is at 1,232.49, but the final line of resistance would be used to confirm or invalidate a bear wave count at that stage.
ALTERNATE BEAR ELLIOTT WAVE COUNT
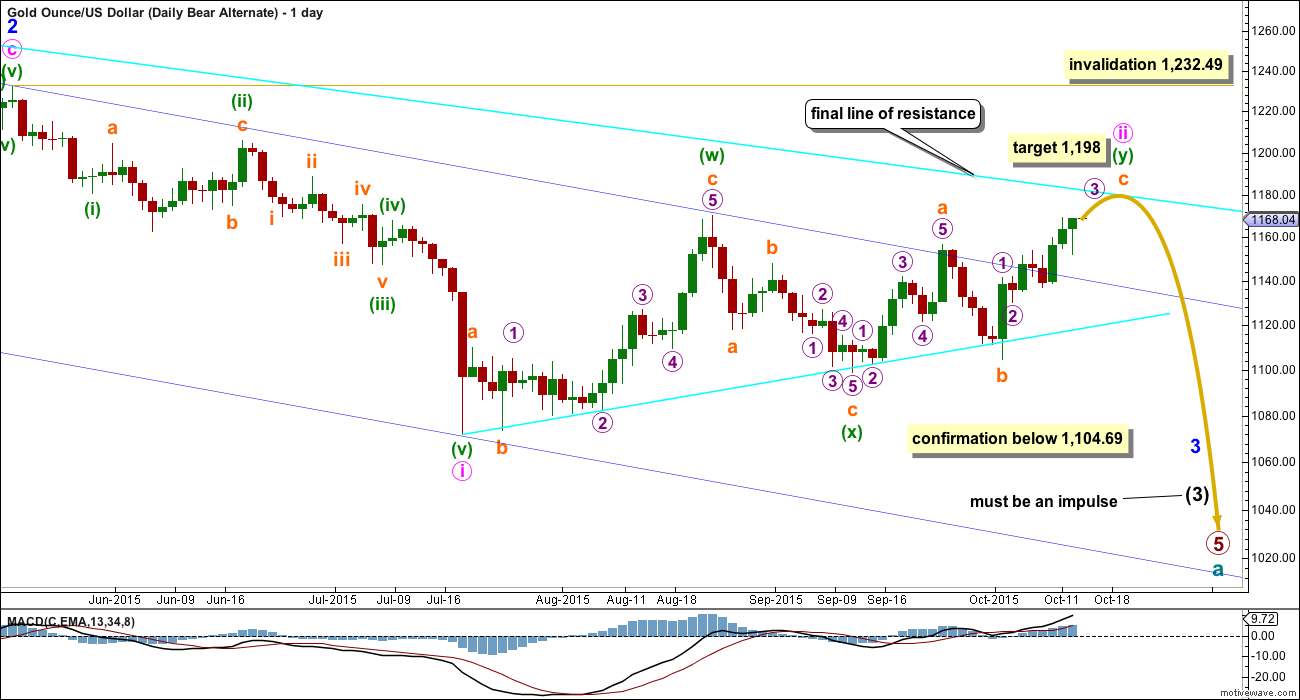
Click chart to enlarge.
If price breaks above 1,170.19, then this would be the bear wave count I would use. It has a reasonably low probability. Minute wave ii would substantially breach the dark blue base channel about minor waves 1 and 2. Minute wave ii would be much longer in duration than a minute degree correction normally is. These are the two reasons which reduce the probability of this alternate idea.
The subdivisions of minute wave ii are a better fit than how this movement is seen for the main bear wave count.
A new high above 1,170.19 would indicate an impulse is most likely unfolding upwards, and would require more upwards movement to complete the structure. At that stage, for both bull and bear wave counts, I would expect price to keep moving higher.
The target for this idea is probably too high as it would see a break above the final line of resistance. At 1,198 subminuette wave c would reach 2.618 the length of subminuette wave a.
Minute wave ii may not move beyond the start of minute wave i above 1,232.49.
TECHNICAL ANALYSIS
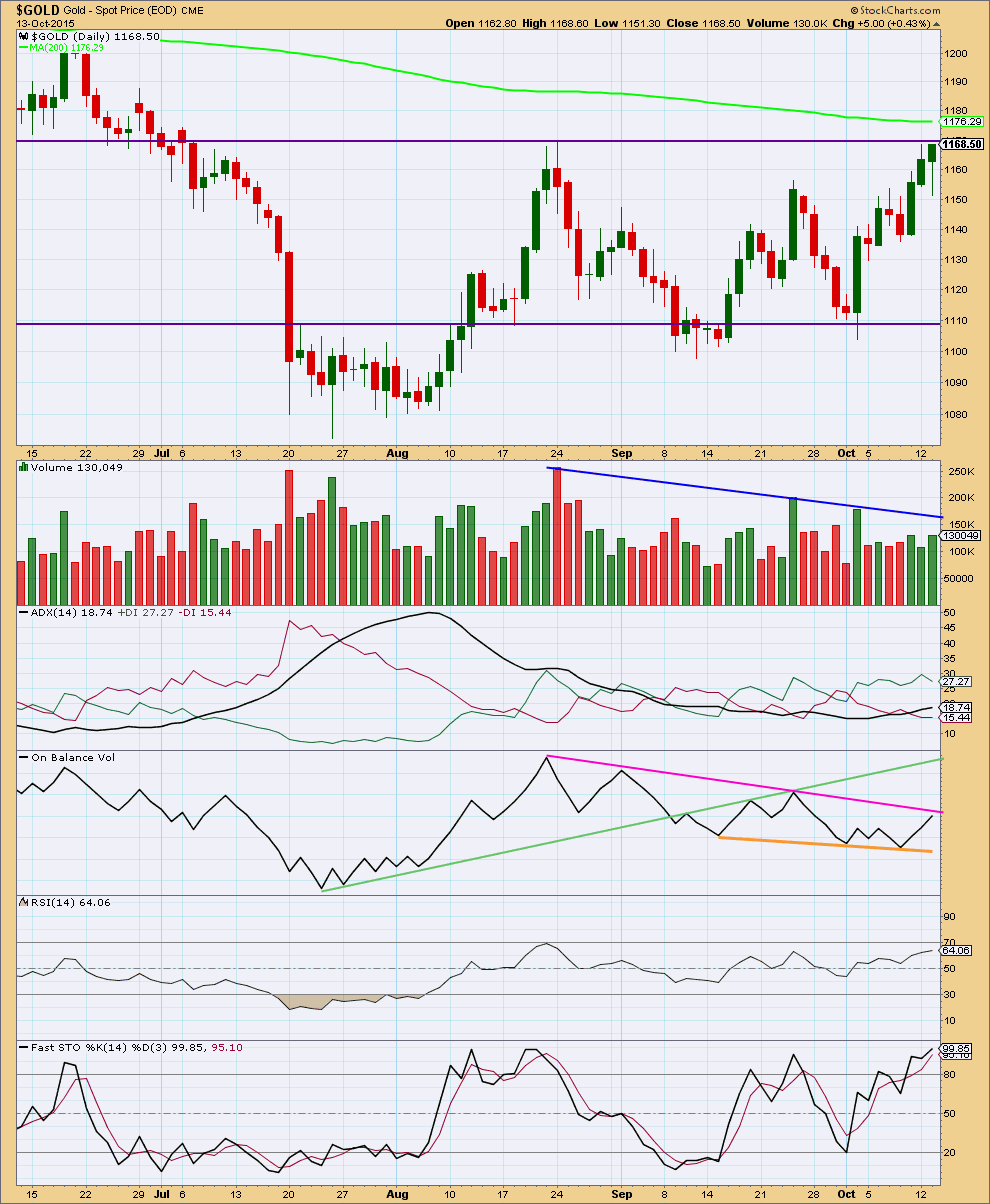
Click chart to enlarge. Chart courtesy of StockCharts.com.
Daily: Monday’s candlestick has a long upper wick and now Tuesday’s candlestick looks like a hanging man, a bearish reversal pattern. The candlestick patterns are bearish. Price is still finding strong resistance at the horizontal trend line. The more often that line is tested the more technically significant it becomes.
There is some support for this upwards movement. Volume for Tuesday is higher than the last two upwards days (although not by much). Overall volume is lower than at the start of this consolidation, no breakout is yet indicated.
Price remains range bound between horizontal lines of resistance and support. ADX is starting to indicate the development of a new upwards trend with the black ADX line pointing upwards and the +DX green line above the -DX red line. Although ADX indicates a new trend, price remains within the consolidation band and volume is declining. Volume indicates the consolidation is incomplete. The breakout has not yet occurred. ADX indicates the breakout may be upwards, but volume indicates it may be downwards. The picture is unclear, so it must be left to price as the final determinator.
On Balance Volume has now come up to almost touch the pink trend line and may find resistance there. This line is reasonably shallow but not long held and has only been tested twice. It is only somewhat technically significant. If OBV turns down from this trend line, the strength will be reinforced and may then be expected to provide future resistance.
The slight divergence between the last two swing highs in price and RSI is no longer so slight; RSI now has moved a little above its point about 14 days ago while price has also made a higher high. RSI is weaker than price indicating a little weakness for this upwards wave, but not as much.
Overall, the regular technical analysis picture is unclear but slightly more bearish than bullish. We need to wait for price to break out of the horizontal trend lines and if that happens on a day with increased volume, then I would expect the breakout is underway.
This analysis is published about 06:32 p.m. EST.
By the way, Great SPX analysis Lara….my gains on those positions nearly offset my gold loss today.
That’s great to hear!
Well, great to know I got one market right. Not great to hear you made a loss on this market.
Stopped out today with a loss when GDX cleared 16.70, too bad! What a move recently. I read today that golds 2-year contracts expire on the 28th and its common to run gold up into those expirations. That could mean 2 more weeks of sideways to up movement.
There are a lot of gaps down below on miners and GLD, but that doesn’t mean they have to be filled.
I’m flat right now, good luck trading everyone!
“The next interruption to the trend for the bull wave count would be at the end of subminuette wave iii at 1,198.”
Absolute Bottom In Gold Confirmed, Silver To Remain Volatile (As per EW)
– Gary Wagner Oct 13, 2015
http://www.kitco.com/news/video/show/Chart-This/1086/2015-10-13/Absolute-Bottom-In-Gold-Confirmed-Silver-To-Remain-Volatile—Gary-Wagner
With price above 1,170 we now have only two daily wave counts which both require more upwards movement.
My focus over the next few days will be to look at all the different ways I can label this upwards impulse (its an impulse but where exactly are the subdivisions?) to try to identify where and when it is over.
It’s not done yet. I can’t see a five wave impulse complete. It should keep moving higher.
I smell a blowoff top….
When this session is over volume will be very telling.
If this session has a volume spike it may be an upwards breakout. If volume is low then it would be highly suspicious.
Price has just broken above the bright aqua blue line. If tomorrow completes a green candlestick we can say goodbye to the bear wave count.
Agreed
i think this rally will come to an end very soon followed by a deep or a very time consuming correction at least, if the final low is already in.
Silver Manipulation is at a 3-year-high.
the big 4 Dealers are short 75 days of world production
the big 8 dealers are short 99 days of world production.
with a sharp increase seen in the last report what means the high is very close.
speculators went long 20.000 contracts! and price made 1.26$. thats like nothinng. this is a clear manipulation or call it what ever if you dont like the word.
silver would have gone up much further!
we have not yet seen this increase in gold even if the manipulation is already present what means dark clouds.
75 days short by the big 4? If one thing is sure, this is no level for an upward break out.
there are 2 options.
1. gold and silver will diverge from now or 2.
we will have a top very soon followed by a deep or a very time consuming correction at least.
so what does it mean when you say goodby bearcount?
that there will be no further low? i could live with that. but it seems the bullcount is wrong also cause there is not much room left for this current rally.
it seems there is something wrong with your counts. i have this feeling since month s
since we have entered this sideways phase in march this year whre you said a 3rd wave up or down had to come.
we went sideways for 3 months.
now i see the same problem coming again in another way.
Correction at end of subminuette wave iii at 1,198.
the speculators are for the most part on the buyer’s side already .
we have a significant weakness on 2 month basis.
and we have the highest manipulation since 3 years.
17$ is the maximum for this rally and if COT-data becomes worse equally it is most likely silver will fall from 17 to 14 at least.
so what does that mean for gold? thats the question.
When is the option expiration day?
Tomorrow I believe
The bright aqua blue line on the bear count at about 1,182, when price gets up there, it should find some resistance. If that line is breached with one full daily candlestick above it and not touching it, then that would be full and final invalidation of this or any other bear wave count.
The alternate bear wave count has a reasonably low probability. The main bear daily and hourly are both invalidated.
The way I see it, at best, gold may be able to hit the 1190s intraday. A top in the 1180s seems more likely.
Gold is trading above its 200 day moving average. It is quickly approaching 70 RSI and trading at/above the daily upper Bollinger band. It has also moved $100 off the summer (multiyear) low and has a tendency to drop around mid-October.
If gold does not go down hard from these levels, the only other way to explain this upward movement is that it is in the 4th wave of a diagonal. If so, expect gold to move as high as the 1260s. Nonetheless, Lara has dismissed this idea so I wouldn’t count on it.
Until gold breaks 1307 (the January high), I remain a bear.
So, before the bulls out there get drunk from the thin air at these lofty levels, take a good look at the weekly charts to get a reality check. The bears are salivating just thinking about shorting this thing! 🙂
This move up is baffling and frustrating. Nothing supports this bull run. Volume has been weak, steadily decreasing, and certainly not strong enough for a $100 move up. The move does seem very corrective and only a matter of short time before the rug is pulled out from underneath. Thx to John for the great long term perspective on gold.
Right, the decrease in volume is a telling signal that this run is soon coming to an end and is, indeed, corrective.
The diagonal could be expanding (not very likely, but possible and so must be considered).
It could go up to the 1260’s for the third wave to be longer than the first.
I agree with your assessment re the 200 day MA and RSI. We could see RSI overbought for a wee while before it turns down.
As soon as the middle of the third wave is over (and I can’t see it done yet) then a series of three fourth wave corrections may help to resolve overbought indicators, and possibly short fifth waves may keep price close to the 200 day MA.
That’s one possibility.
It could end minute wave c for the bull count and manage to not stay too high too long.
Then we need minor 4 down for the diagonal to overlap back into minor 1 price territory.
Diagonals are choppy and overlapping, a series of zigzags. This is a rising wedge forming (if my wave count for the bull is right)
Gold Prices Jump To 3 1/2-Month High
– October 14, 2015, 10:35 A.M. ET
http://blogs.barrons.com/focusonfunds/2015/10/14/gold-gets-its-groove-back-hits-3-12-month-high/
This guy has been calling gold bullish since mid September.
Lara, taking a step back and looking at the larger picture, I pulled up super cycle wave 4 which lasted 19 years. (See chart). I think it would be beneficial if we recognize what we’re dealing with here, since we’re only 3 or 4 years into a larger degree (Grand Super Cycle wave 4) which could last another 15 to 20 years. This means our chances of navigating through this successfully will be incredibly difficult. Im not saying it can’t be done. But, maybe some of your members may consider another market – perhaps oil? I think we should recognize the gravity of the situation. (Interesting Note: super cycle wave four retraced 38.2%)
Current wave 4
John, thanks for your charts.
You may want to look at Lara’s last Supercycle post before giving up on Gold.
GOLD Elliott Wave Technical Analysis – Grand Supercycle – 8th May, 2015
see it under her – Gold Historical
Yes, it’s well done
You’re right, Grand super cycle IV can take many different forms.
But for now cycle a is a five wave impulse.
Cycle b I have identified as one of three possible structures.
When that’s done cycle c must be a five wave structure; impulse or diagonal.
And no matter if it’s a bull or bear market the issue of which structure is unfolding will always be there. B waves will always turn up in corrections, they’ll always be the worst most difficult to analyse due to their variety.
When this cycle b is over cycle c will make life much easier.
So true…
Avi Gilburt doubles down: Gold is going to $25,000
June 12, 2015 11:24 a.m. ET
http://www.marketwatch.com/story/avi-gilburt-doubles-down-gold-is-going-to-25000-2015-06-12
I expect a fourfold to fivefold increase in the HUI within the next five to seven years, with a fifteenfold to twentyfold increase in the HUI within the next 20 years. Ultimately, the 15,000 target in the HUI, and $25,000 target in gold US:GCQ5 is a 50-year expectation, not a 10-year expectation.
However, he expects a new low first!
I wouldn’t label that move as a triple zigzag. It doesn’t have a clear slope against the trend as a triple zigzag should have and there’s a triangle in there (supported by MACD).
It fits as a single zigzag with a triangle for the B wave. Much simpler.
Even though a bear market can last a long time (and yes, that one was 19.5 years) there are still plenty of trading opportunities.
We managed well enough during a fourth wave triangle for primary wave 4.
The problem at this time has been identifying a cycle degree trend change from a to b. And no matter what structure a big trend change is always going to take time to be confirmed due to the size.
“Metals fallacy revisited, but still searching for a bottom” by Avi Gilburt EW
Wednesday, 14 October 2015
http://news.goldseek.com/GoldSeek/1444827840.php
Just a view: Gold price took quite a battering all the way down from 1308 to 1073 and lets look at it this way, it has not yet made it back up to 50% retrace at 1190-91 and given some upside allowance to 1202-1215, I’d say the bear lives to fight another day lol…. 🙂
The last resistance for gold to turn around. It has done it in past. A chart from other trader.
“Here we go again. Notice the backtests are getting shallower….all part of the bottoming process.”
Papudi, I’ve been meaning to thank you for introducing me to the Goldtent side a few weeks ago. I now check the site daily. Some very good technical charts posted there. Postings seemed to increase while the Rambus site was down. I’m guessing that the “Mark” that posts there is the same person that was a member at EWG for a couple of months. Would you agree?
Yes I agree. He is very good charting and has great confidence in his chart analysis.
Rambus forum is back on so traders have left this forum I still visit daily.
Gold just broke thru $1175 at 0330 EST….
And at 6am EST, gold dropped 10 dollars within 30 minutes. Clearly gold is fighting opposing forces at trend line resistance and the 200 MA. Last call for the Bears to make a stand…
Lara..what should be the stoploss for buy now
I am not legally able to provide entry points or stop loss points.
This service is analysis only. Your trades are your own.
I provide analysis, not a signal service.
Lara mentioned in the video, ” Above 1,170.19 tells us that upwards movement will continue for a few days at least.”
Just opened the analysis and I see that Gold still thinks it’s rocket ship since it blasted off from 1,104.70 on October 2nd. Hopefully the bears got out of the way.
The MACD indicator I use the longer time frames showed GDX daily, weekly and monthly have been bullish all month long. I did get out of harms way even though I wished and hoped gold would just make new lows.
With a new high above 1,170 its now needing to complete a third wave up.
For both the preferred bull wave count and the now very unlikely bearish alternate (which will remain just technically possible until that final line of resistance is broken).
Well that’s that. Unbelievable how they were able to wrestle away my long position from me right before the move lol. Now i have to hope the same thing happens as last night, just vice versa. Bummer dude
Lara, do you have the rules and regs for a barrier triangle handy.
Can the (b) wave of a zig zag be a barrier triangle?
Can the (b) wave of the triangle be a double zig zag?
Any idea what the normal fib ratios inside the triangle usually are?
Thanks
Watch the video on triangles on the education page.
Yes, the B wave of a zigzag can be a barrier triangle.
Yes, the B wave of a triangle can be a double zigzag.
Fibonacci in triangles: expect at least one wave to be 0.618 of its predecessor. However, in my experience it’s pretty common for triangle sub waves to be close to 0.8 to 0.85 of each predecessor.
Good Morning Lara, is it now clear is the Bear wave count out and we all go long? And the same in Silver too?
Thanks for an update.