
More upwards movement was expected and price made a new high.
All the Elliott wave counts remain mostly the same and expect exactly the same direction next.
Summary: The target for upwards movement to be interrupted is still at 1,198. The final line of resistance is only overshot and not properly breached, so the bear wave count remains viable. There has not been enough technical confirmation of a trend change from bear to bull for Gold for me to discard a bear wave count at this stage, but the bull wave count does look more likely.
To see weekly charts for bull and bear click here.
New updates to this analysis are in bold.
BULL ELLIOTT WAVE COUNT
DAILY – TRIANGLE
Click chart to enlarge.
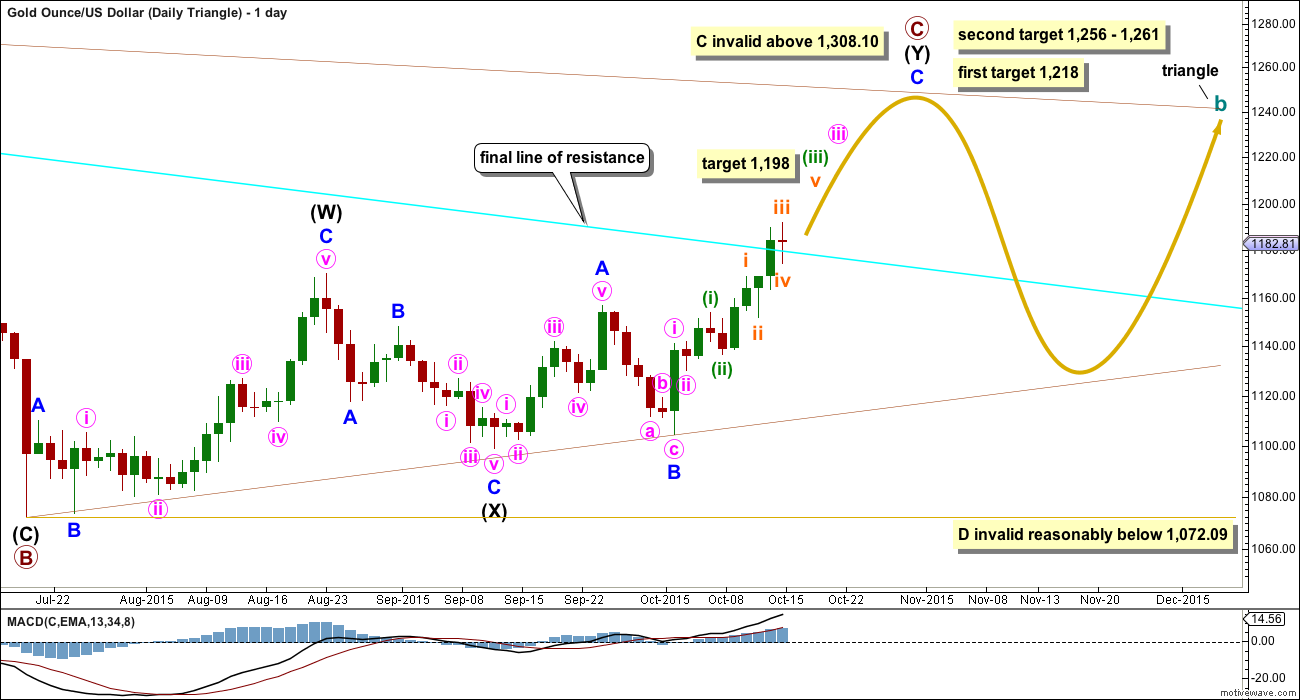
This first daily chart looks at what a triangle would look like for cycle wave b. The triangle would be a running contracting or barrier triangle. Within the triangle, primary wave C up must be a single or multiple zigzag. Primary wave C may not move beyond the end of primary wave A above 1,308.10.
This idea slightly diverges from the other two ideas for cycle wave b as an expanded flat or combination and now at this stage requires its own daily chart.
The expected direction is still exactly the same, and the current upwards structure is still seen as an impulse. The first short term target at 1,198 is also the same. This target is where minuette wave (iii) would reach 2.618 the length of minuette wave (i).
The first target at 1,218 is where primary wave C would reach 0.618 the length of primary wave B. If price gets up to the first target and the structure of minor wave C is a complete five wave impulse, then it may be over there.
The second target at 1,256 is where minor wave C would reach 2.618 the length of minor wave A, and at 1,261 primary wave C would reach 0.8 the length of primary wave A.
For the triangle idea, for cycle wave b, a five wave impulsive structure only needs to complete upwards. The next wave down for primary wave D should be fairly time consuming, lasting about 2 to 6 months. Primary wave D may not move beyond the end of primary wave B at 1,072.09 for a contracting triangle. Alternatively, primary wave D may end about the same level as primary wave B at 1,072.09 for a barrier triangle, as long as the B-D trend line remains essentially flat. In practice this means primary wave D can end slightly below 1,072.09 and this wave count remains valid. This is the only Elliott wave rule which is not black and white.
DAILY – EXPANDED FLAT OR COMBINATION
Click chart to enlarge.
Cycle wave b may also be a flat or combination. To see what these ideas look like for the bigger picture see weekly charts here.
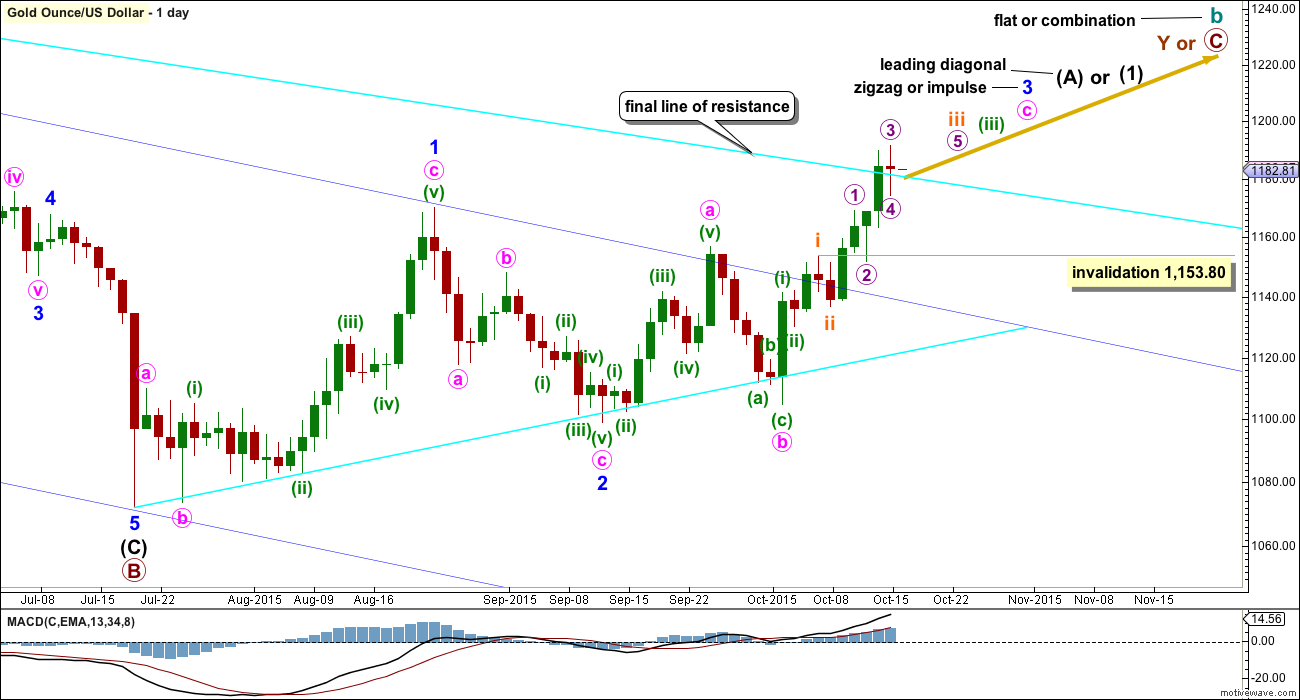
This second daily chart will suffice for both the combination and expanded flat ideas.
If cycle wave b is an expanded flat, then primary wave C must be a five wave structure. If the current diagonal unfolds as a contracting diagonal (most common), then it would be intermediate wave (1) of a five wave impulse upwards for primary wave C. If the current leading diagonal unfolds as an expanding diagonal, then the degree of labelling within primary wave C may be moved up one degree because an expanding diagonal may be an ending diagonal for primary wave C in its entirety.
If cycle wave b is a combination, then primary wave Y may subdivide as either a zigzag, flat or triangle. A zigzag would be most likely. The first structure in the double was an expanded flat. If primary wave Y is a zigzag, then the diagonal would be a leading diagonal for a five wave structure for intermediate wave (A).
At 1,197 minor wave 3 will pass equality in length with minor wave 1. Above that point the diagonal must be expanding and not contracting.
A leading diagonal requires the second and fourth waves to subdivide as zigzags. The first, third and fifth waves are most commonly zigzags, but sometimes may appear to be impulses. So far minor wave 1 fits well as a zigzag.
Minor wave 2 can now be seen as a complete zigzag. It is 0.73 the depth of minor wave 1, nicely within the normal range of between 0.66 to 0.81 for a second wave within a diagonal.
Third waves within leading diagonals are most commonly zigzags, but sometimes they may be impulses. Minor wave 3 is now showing some increase in upwards momentum beyond that seen for minor wave 1. Minor wave 3 has moved above the end of minor wave 1 above 1,170.19.
There now looks like a five up on the daily chart within minor wave 3. This may be minute wave a within a zigzag or it may also be minute wave i within an impulse.
Current upwards movement would be minute wave c or minute wave iii. Either way, it must subdivide as an impulse. On the hourly chart so far the structure still looks incomplete.
The hourly chart below will suffice for all three bull wave count ideas. For the triangle idea, the labelling would be the same except it should be moved up one degree.
HOURLY CHART
Click chart to enlarge.
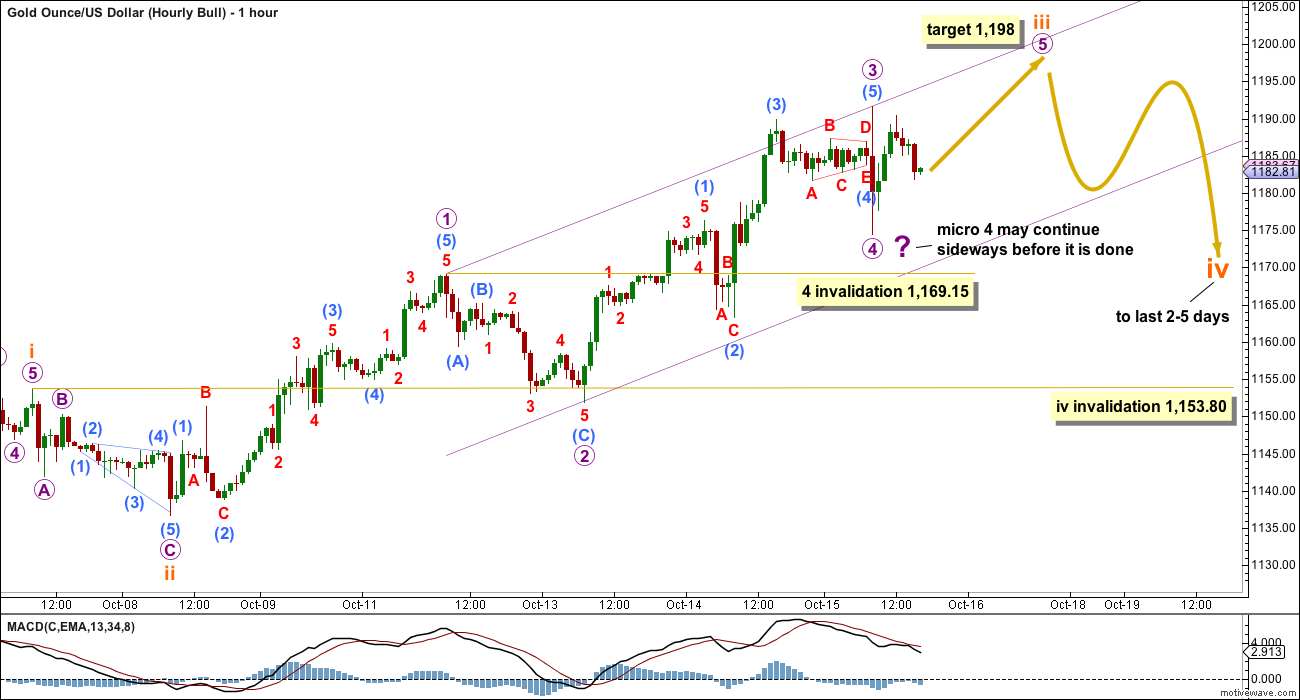
Price first moved sideways before it made a new high during Thursday’s session. The sideways movement fits perfectly as a triangle.
Submicro wave (3) was probably already complete. The sideways movement looks and fits best as submicro wave (4) and not one degree lower as I had it labelled on yesterday’s hourly chart.
The following sharp downwards movement may have been micro wave 4 in its entirety, or equally as likely it may only be wave A of a flat or triangle or wave W of a combination for micro wave 4. Micro wave 4 may yet continue sideways before it is done.
Micro wave 4 may not move into micro wave 1 price territory below 1,169.15. A new low below 1,169.15 may not be micro wave 4, so at that stage micro wave 4 must be considered as complete and micro wave 5 would also have to be complete. If price breaks below 1,169.15 before making a new high, then micro wave 5 may have ended with a truncation and subminuette wave iii must be over.
What is more likely is price may drift sideways a little and then make a new high. The target remains the same at 1,198 where subminuette wave iii would reach 2.618 the length of subminuette wave i.
Subminuette wave ii was a deep 0.73 zigzag. Subminuette wave iv may be expected to be more shallow and a flat, combination or triangle. These are all mostly sideways movements. Subminuette wave ii shows on the daily chart as two red candlesticks. For the impulse of minuette wave (iii) to have the right look, subminuette wave iv should also show on the daily chart with at least one and most likely more red candlesticks or doji. It may last a Fibonacci 2 or 3 or even 5 days.
Subminuette wave iv may not move into subminuette wave i price territory below 1,153.80.
Draw a channel about the middle of this third wave using Ellliott’s first technique: draw the first trend line from the ends of micro waves 1 to 3, then place a parallel copy on the end of micro wave 2. The lower edge should provide support while micro wave 4 continues, if it does. The upper edge may show where micro wave 5 ends when price again touches that trend line.
When subminuette wave iii is complete redraw the channel using the same technique about the third wave one degree higher. Use the lower edge to show where subminuette wave iv may end.
BEAR ELLIOTT WAVE COUNT

Click chart to enlarge.
The final line of resistance (bright aqua blue line copied over from weekly charts) is only overshot and not so far properly breached. While this line is not breached the bear wave count will remain possible. Simple is best, and the simplest method to confirm a trend change is a trend line. While price remains below this line, it must be accepted that Gold has been in a bear market since 2011 and we don’t have technical confirmation that the bear market has ended.
The only option now for a bear wave count is to see minute wave ii continuing higher as a double zigzag.
Minute wave ii has strongly breached the dark blue base channel drawn about minor waves 1 and 2. When a lower degree second wave correction breaches a base channel drawn about a first and second wave one or more degrees higher, then the probability of the wave count reduces, particularly at higher time frames.
The structure of upwards movement for the bear wave count is exactly the same as the bull for the short term: a five wave impulse is unfolding upwards and it is incomplete.
Minute wave ii may not move beyond the start of minute wave i above 1,232.49. A new high above that price point would be final price invalidation of any bear wave count. That would fully eliminate the concept that Gold remains in a bear market. No bear wave count should be considered above that point.
TECHNICAL ANALYSIS
Click chart to enlarge. Chart courtesy of StockCharts.com.
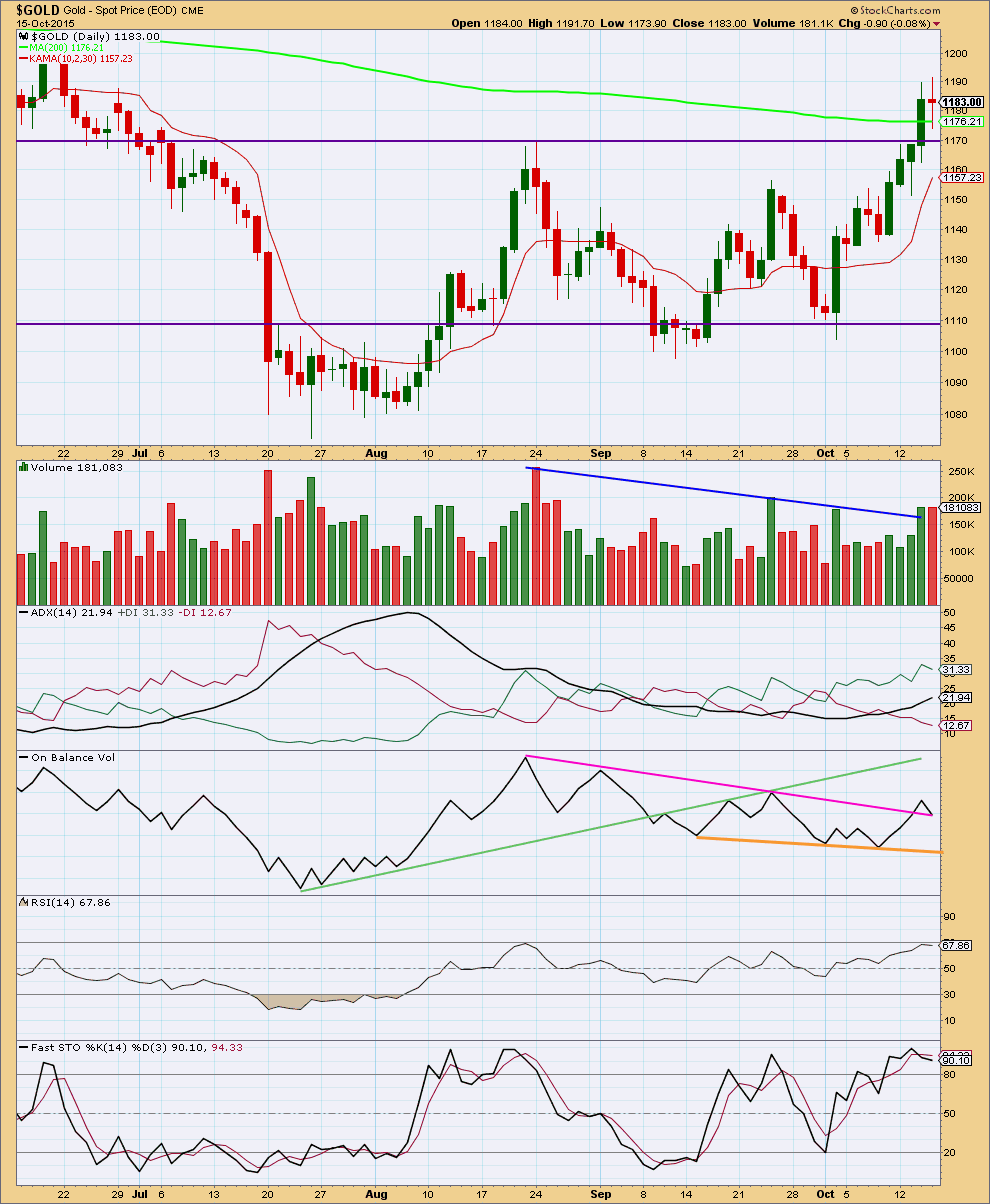
Daily: Today’s candlestick completes a red doji on volume which was slightly lower than the prior upwards day. This represents indecision, a balance between bulls and bears. In the first instance I would expect the horizontal trend line which previously provided resistance to now provide support. Price may throwback to that line.
When price breaks through trend lines and then throws back, if ADX indicates a clear trend is evident, then it offers a good opportunity to join the trend.
ADX is now above 20 and pointing upwards indicating a new trend. The trend is upwards with the +DX line above the -DX line.
On Balance Volume broke above the short pink trend line providing a weak bullish indicator. Today OBV has come down to sit on the pink trend line. It may provide some support, but this trend line is not a strong technical indicator as it is not very long held nor well tested.
There is no longer divergence between price and RSI. RSI is not yet overbought.There is room for further upwards movement.
Stochastics showed some bearish divergence with price just before today’s high. This may be an indication that a correction may unfold about here, but it cannot tell us exactly where the high will happen because this small divergence can persist for a few days prior to the price high. It is a weak indicator, but another small piece of information to weigh up.
I added Kaufman’s Moving Average (red line) because ADX indicates a trend and price has broken out of a consolidation zone. This may be useful to show where this upwards trend may find support.
Overall, it looks like Gold has broken out of the recent consolidation and the breakout was upwards, despite the strongest volume day during the consolidation being downwards. The strongest piece of technical analysis on this chart is the horizontal trend line. It is very likely to provide support.
This analysis is published about 07:06 p.m. EST.
I’m thinking that with the stronger US dollar and news that gold and the miners may drop over the weekend and also on Monday and I’ll buy NUGT lower on Monday before the breakout up.
“It is not over and so I’d expect this sideways drift to continue into Monday.
When its done all wave counts expect the breakout to be upwards.”
http://www.pmbull.com Gold shows an upper trend line last 2 days for 1 minute through 15 minutes for gold. It hit it 4 times today and came back down. the last time was at 1:28 pm.
Gold is down from Thursday and weaker today with higher US dollar and US inflation, consumer sentiment, optimism on FED interest rates and there are fewer job openings,
Micro wave 4 is drifting sideways. It will be either a flat, combination or triangle. It is not over and so I’d expect this sideways drift to continue into Monday.
When its done all wave counts expect the breakout to be upwards.
The bear wave count remains possible, price has not breached the long term bear market trend line yet. The last three daily candlesticks are finding resistance about there.
Its a long held reasonably shallow and repeatedly tested trend line. If a strong move down develops from here the line strength would be reinforced; it price breaks above it that would be significant and I’ll discard the bear.
Thanks Lara you are very helpful with your comments. You are doing a terrific job with your analysis making as much sense as possible during these confusing gold actions lately that could scare the bejesus out of investors.
Gold futures retreat from 4-month high as dollar climbs
Oct 16, 2015 12:28 p.m. ET
http://www.marketwatch.com/story/gold-futures-dive-from-four-month-high-as-dollar-climbs-2015-10-16
Narrow range inside day so far with 5dma 1175 holding and a rising support below there at 1171-70. Remains to be seen which way this breaks on Monday, more likely upward for a take out of 1190-1191…. A closing above pivot would be preferred….The bears have not done too well third week running with Gold price closing at the upper end of weekly range and maybe today week closing 118x….Preference is to stay long until topping is seen….
I think it looks like gold is heading up to 1,198 from low today at 1175.44 at 3:16 am
I disagree. Stronger dollar will push gold down short term.
The higher S&P goes the more downside pressure gold faces too, however, Elliott Wave dismisses the inverse correlation between different markets.
The inverse correlation isn’t always there anyway.
And isn’t always isn’t the same as always! LOL!
An impulse move up is underway and indicated by ADX line as Lara wrote above:
——————————————————————————————–
“When price breaks through trend lines and then throws back, if ADX indicates a clear trend is evident, then it offers a good opportunity to join the trend.
ADX is now above 20 and pointing upwards indicating a new trend. The trend is upwards with the +DX line above the -DX line.”
Using GLD yesterday. Shorted .618 retrace against the high. Was stopped out. Frustrating. Guess we are still in 4 until 1169.15 breaks. See what happens today
with chart
“Gold is at its long-term downtrend (marginally) and 200-day moving average, implying that a dramatic shift in sentiment could be under way.”
Gold scores highest settlement in four months.
2 Gold experts say gold is doomed to fail and in a short covering rally. So sell the rally.
http://www.msn.com/en-us/money/mutualfunds/gold-scores-highest-settlement-in-four-months/ar-AAftsXc?srcref=rss
Includes video and numerous GLD charts.
Just hanging out for now. If gold pops to 1198 in the morning, I may grab some dust/jdst for a trade.
I’d want to buy some DUST at 1198 Friday or Monday.
DUST is at a multi month triple low price January 20th, May 14th and $11.50 Thursday
coming off that spike low last night, on the 1 minute chart (investing.com) there is a beautiful pattern, I think a WXY composed of a leading 5 wave diagonal with a sharp correction followed by an ending 5 wave diagonal to make a 5,3,5 (W) with a shallow zig zag to correct making an (X) followed by an expanded fifth impulse with a zig zag to correct followed by an ordinary impulse to make a 5,3,5 (Y) yielding a lower high. Classic (B) wave bull trap. Finding something like this on an hourly or daily could be a lot of fun.
Edward I didn’t understand it as too complex waves for me to follow until I read Bull trap.
Sorry here’s a screen shot
In future reports can you please add some extra space (bars) to golds stockchart chart like you have on FXCM chart?
The way to do that is under chart attribute far left block type in number of bars like 10,20 30 etc. That way the chart image will move over to the left.
This helps see the end of indicators at the bottom clearly.
Thanks
OMG
I know you’ve asked me to do this before, I tried and didn’t figure it out.
Just figured it out thanks to your explanation.
Done.