
Short term some sideways movement was allowed for and this is what is happening.
The breakout direction is still expected to be the same for all wave counts.
Summary: Short term I expect Monday to continue a sideways drift. When it is done price should breakout upwards for a fifth wave to a target at 1,198. There has still not been a breach of the long held bear market trend line, so the bear wave count remains possible, but with price right at the line the bull count is now favoured.
To see weekly charts for bull and bear click here.
New updates to this analysis are in bold.
BULL ELLIOTT WAVE COUNT
DAILY – TRIANGLE
Click chart to enlarge.
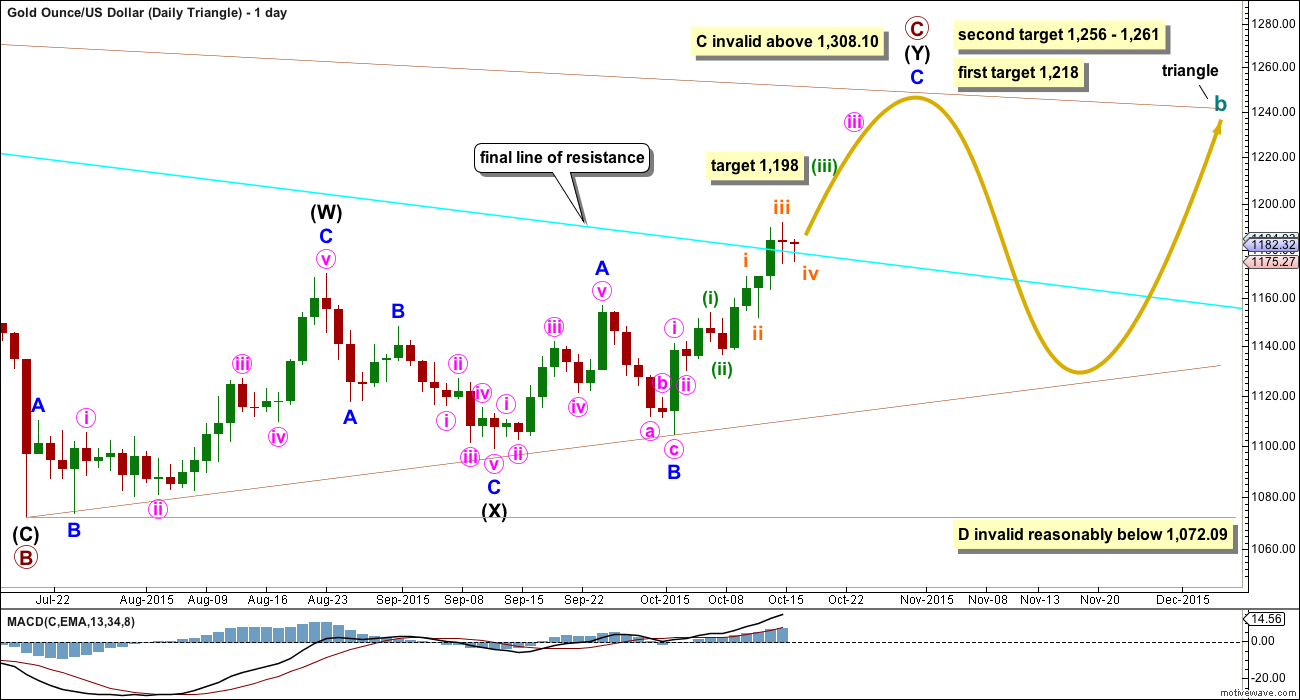
This first daily chart looks at what a triangle would look like for cycle wave b. The triangle would be a running contracting or barrier triangle. Within the triangle, primary wave C up must be a single or multiple zigzag. Primary wave C may not move beyond the end of primary wave A above 1,308.10.
This idea slightly diverges from the other two ideas for cycle wave b as an expanded flat or combination.
The expected direction is still exactly the same, and the current upwards structure is still seen as an impulse. The first short term target at 1,198 is also the same. This target is where minuette wave (iii) would reach 2.618 the length of minuette wave (i).
The first target at 1,218 is where primary wave C would reach 0.618 the length of primary wave B. If price gets up to the first target and the structure of minor wave C is a complete five wave impulse, then it may be over there.
The second target at 1,256 is where minor wave C would reach 2.618 the length of minor wave A, and at 1,261 primary wave C would reach 0.8 the length of primary wave A.
For the triangle idea, for cycle wave b, a five wave impulsive structure only needs to complete upwards. The next wave down for primary wave D should be fairly time consuming, lasting about 2 to 6 months. Primary wave D may not move beyond the end of primary wave B at 1,072.09 for a contracting triangle. Alternatively, primary wave D may end about the same level as primary wave B at 1,072.09 for a barrier triangle, as long as the B-D trend line remains essentially flat. In practice this means primary wave D can end slightly below 1,072.09 and this wave count remains valid. This is the only Elliott wave rule which is not black and white.
DAILY – COMBINATION
Click chart to enlarge.
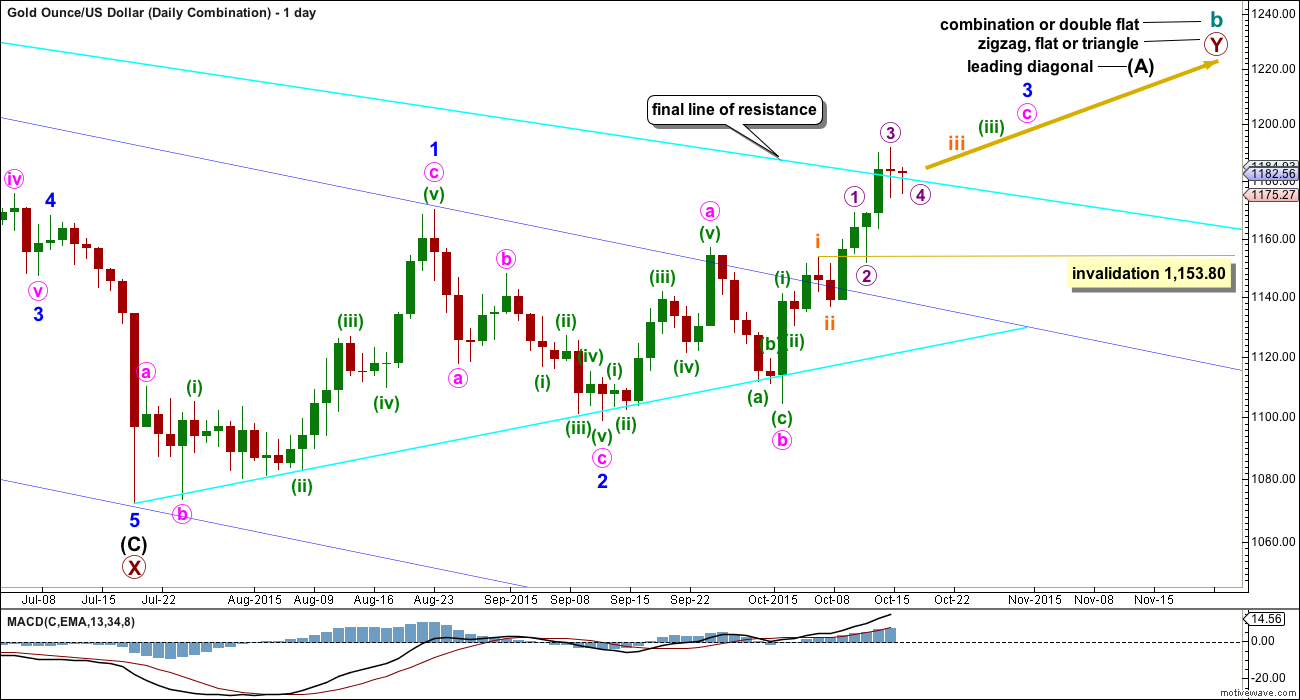
It may be clearer to separate the three ideas for cycle wave b at the daily chart level as well as the weekly.
If cycle wave b is a combination, then the first structure in the double combination (or double flat) was an expanded flat. The double is joined by a three in the opposite direction labelled primary wave X which was a zigzag.
The second structure in the double may be another flat for a double flat, or it may be a zigzag or triangle for a double combination. Because a triangle for primary wave Y would essentially make the whole of cycle wave b the same as a triangle for cycle wave b, this chart will focus only on a possible zigzag for primary wave Y.
If primary wave Y is a zigzag, then intermediate wave (A) must be a five wave structure and may be unfolding as a leading diagonal.
If primary wave Y is a flat correction, then intermediate wave (A) must be a three wave structure and may be unfolding as a double zigzag (this idea is how the first chart, Daily – Triangle, labels upwards movement).
For all possibilities, a five wave impulse is still required to complete upwards. The short term target for subminuette wave iii is still the same at 1,198.
Subminuette wave iv may not move into submineutte wave i price territory below 1,153.80.
DAILY – EXPANDED FLAT
Click chart to enlarge.
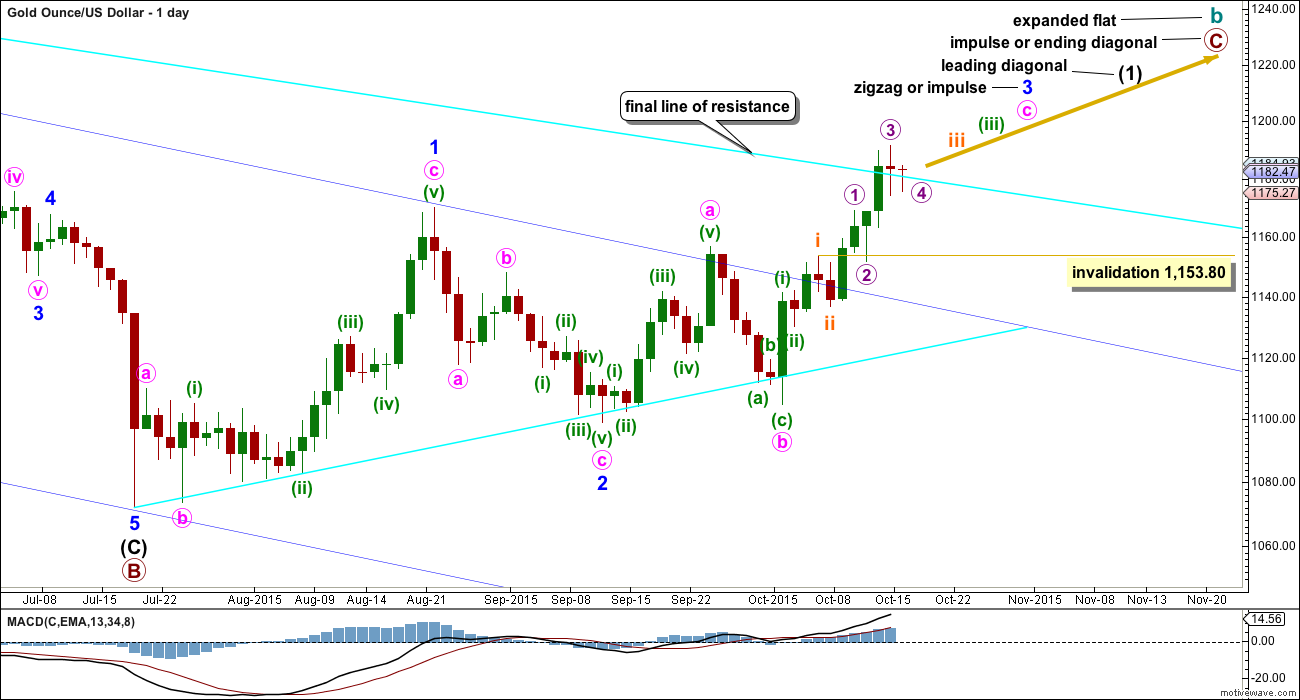
Cycle wave b may also be a flat.
If cycle wave b is an expanded flat, then primary wave C must be a five wave structure. If the current diagonal unfolds as a contracting diagonal (most common), then it would be intermediate wave (1) of a five wave impulse upwards for primary wave C. If the current leading diagonal unfolds as an expanding diagonal, then the degree of labelling within primary wave C may be moved up one degree because an expanding diagonal may be an ending diagonal for primary wave C in its entirety.
At 1,197 minor wave 3 will pass equality in length with minor wave 1. Above that point the diagonal must be expanding and not contracting.
A leading diagonal requires the second and fourth waves to subdivide as zigzags. The first, third and fifth waves are most commonly zigzags, but sometimes may appear to be impulses. So far minor wave 1 fits well as a zigzag.
Minor wave 2 is 0.73 the depth of minor wave 1, nicely within the normal range of between 0.66 to 0.81 for a second wave within a diagonal.
Third waves within leading diagonals are most commonly zigzags, but sometimes they may be impulses. Minor wave 3 is now showing some increase in upwards momentum beyond that seen for minor wave 1. Minor wave 3 has moved above the end of minor wave 1 above 1,170.19.
There now looks like a five up on the daily chart within minor wave 3. This may be minute wave a within a zigzag or it may also be minute wave i within an impulse.
Current upwards movement would be minute wave c or minute wave iii. Either way, it must subdivide as an impulse. On the hourly chart so far the structure still looks incomplete.
The hourly chart below will suffice for all three bull wave count ideas. For the triangle idea, the labelling would be the same except it should be moved up one degree.
HOURLY CHART
Click chart to enlarge.
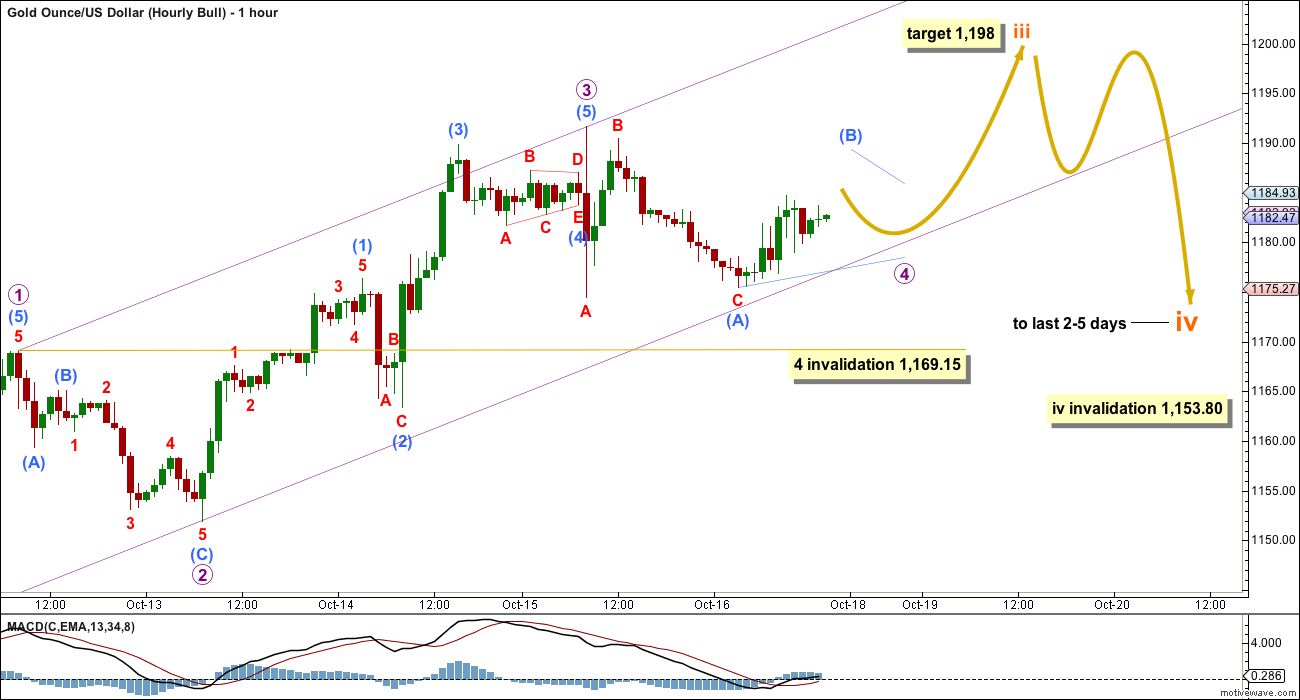
Micro wave 4 looks like it is drifting sideways taking up more time. This still has the right look on the daily chart because micro wave 2 shows up with a long lower candlestick wick.
Micro wave 4 may be unfolding as a triangle as labelled. Alternatively (and equally as likely), it may continue as a combination, single flat or double flat. If it reaches the lower edge of the channel, it should find support there. That may be where it ends.
The target remains the same. At 1,198 subminuette wave iii would reach 2.618 the length of subminuette wave i. Micro wave v may last about two or three days.
There is no Fibonacci ratio between micro waves 1 and 3; micro wave 3 is longer by 7.33. It would be highly likely that micro wave 5 will exhibit a Fibonacci ratio to either of micro waves 1 or 3, and equality with micro wave 1 at 32.41 would be the most common ratio. I will add to the target calculation for subminuette wave iii when micro wave 4 is complete, and it may then be calculated at two wave degrees. At that stage, it may widen to a small zone or it may change.
Micro wave 4 may not move into micro wave 1 price territory.
When subminuette wave iii is complete then the following correction for subminuette wave iv may not move into submineutte wave i price territory below 1,153.80.
BEAR ELLIOTT WAVE COUNT
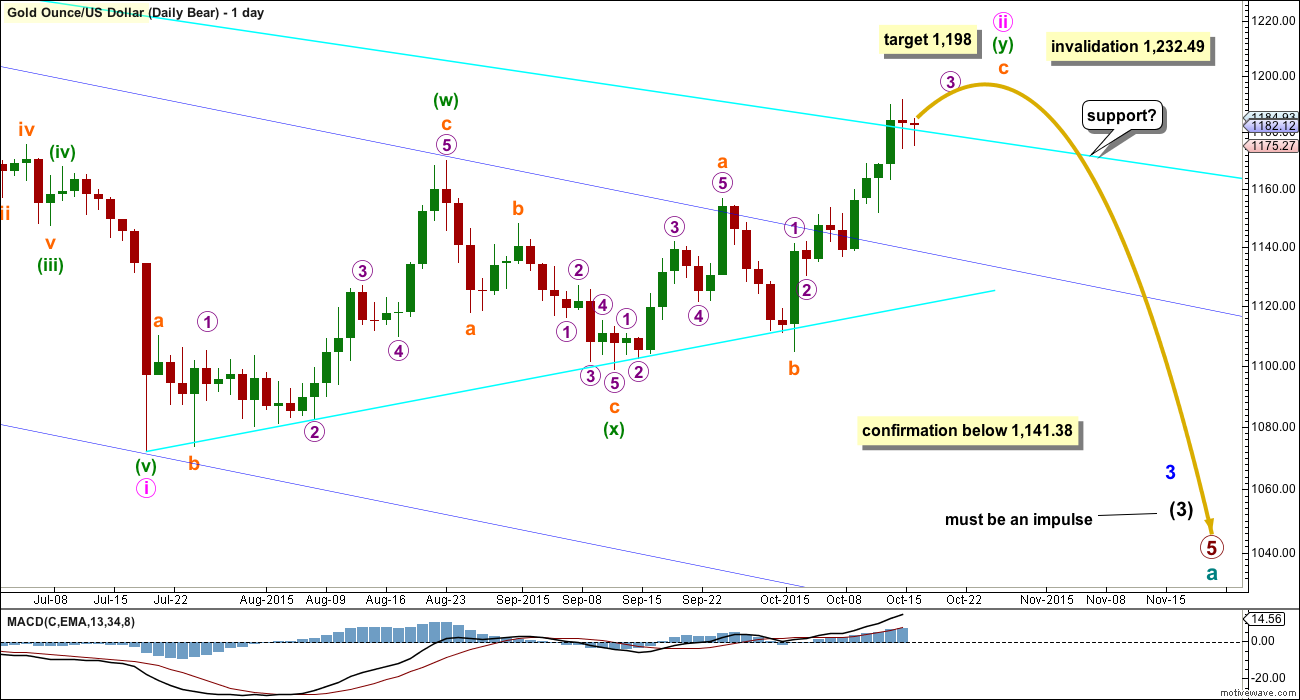
Click chart to enlarge.
The final line of resistance (bright aqua blue line copied over from weekly charts) is only overshot and not so far properly breached. While this line is not breached the bear wave count will remain possible. Simple is best, and the simplest method to confirm a trend change is a trend line. While price remains below this line, it must be accepted that Gold has been in a bear market since 2011 and we don’t have technical confirmation that the bear market has ended.
The only option now for a bear wave count is to see minute wave ii continuing higher as a double zigzag.
Minute wave ii has strongly breached the dark blue base channel drawn about minor waves 1 and 2. When a lower degree second wave correction breaches a base channel drawn about a first and second wave one or more degrees higher, then the probability of the wave count reduces, particularly at higher time frames.
The structure of upwards movement for the bear wave count is exactly the same as the bull for the short term: a five wave impulse is unfolding upwards and it is incomplete.
Minute wave ii may not move beyond the start of minute wave i above 1,232.49. A new high above that price point would be final price invalidation of any bear wave count. That would fully eliminate the concept that Gold remains in a bear market. No bear wave count should be considered above that point.
TECHNICAL ANALYSIS
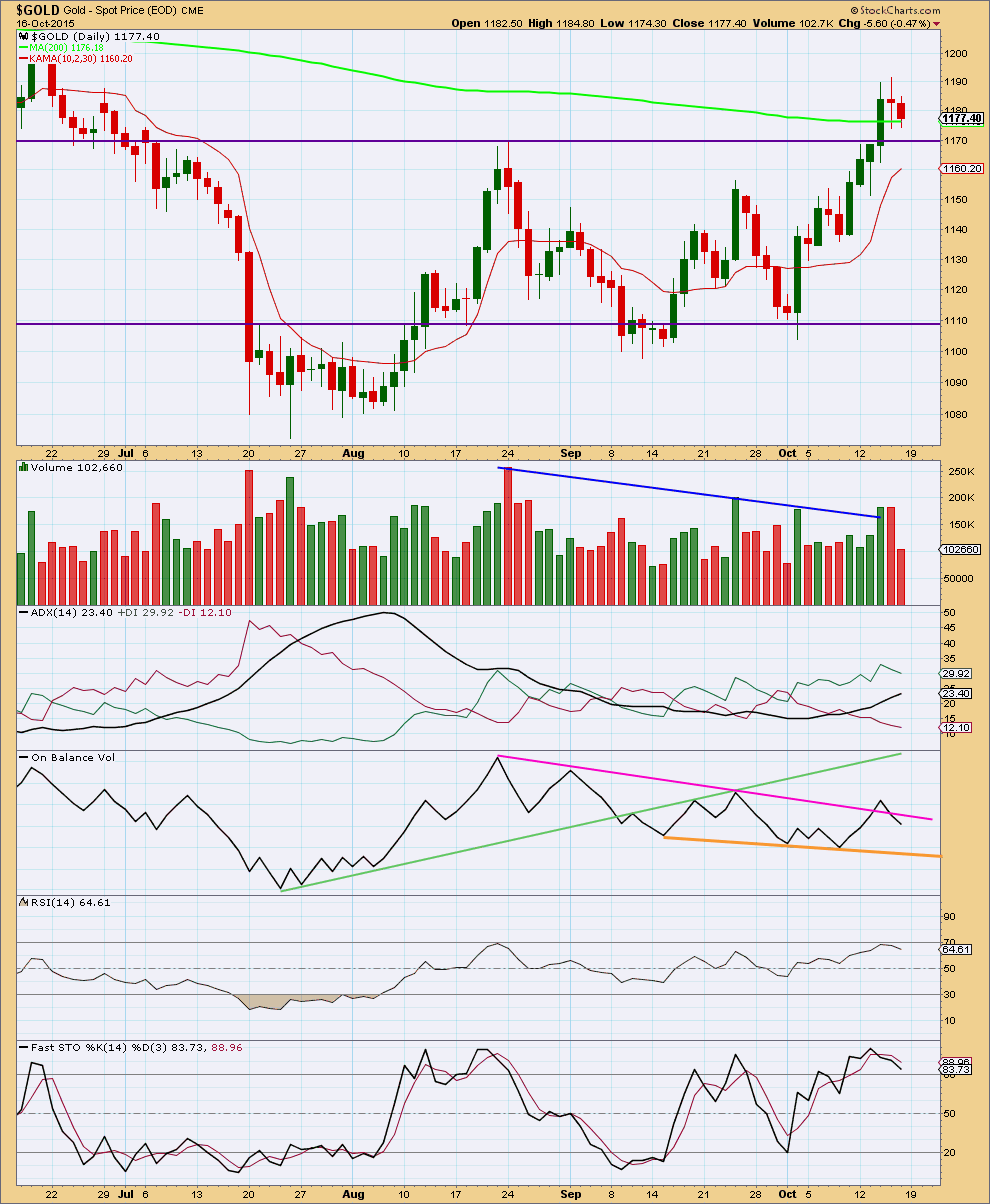
Click chart to enlarge. Chart courtesy of StockCharts.com.
This section of the analysis is updated after first publication.
Friday’s red candlestick importantly comes on substantially lower volume. This indicates the move is corrective.
Friday’s red candlestick completes an evening doji star candlestick pattern, although the pattern is weak because the third candlestick closes only about halfway in the body of the first candlewick (the deeper the close of the third candlestick the stronger the pattern). This is a warning that we may have a high in place; an evening doji star is a bearish reversal pattern. These candlestick patterns do not always work as expected though. As with all technical analysis indicators they need to be weighed up with other pieces of evidence.
I would expect price to find strong support now at the horizontal trend line which previously provided resistance. When price breaks through trend lines and then throws back, if ADX indicates a clear trend is evident, then it offers a good opportunity to join the trend.
ADX is now above 20 and pointing upwards indicating a new trend. The trend is upwards with the +DX line above the -DX line.
The pink trend line is not working well for On Balance Volume. It is not technically significant enough. OBV may now find some support at the orange trend line, but that too is too short lived and not tested enough to be highly technically significant. It may provide some weak support.
RSI is not yet overbought. There is room for further upwards movement.
The current correction is resolving the prior small bearish divergence between price and Stochastics.
I added Kaufman’s Moving Average (red line) because ADX indicates a trend and price has broken out of a consolidation zone. This may be useful to show where this upwards trend may find support.
Overall, it looks like Gold has broken out of the recent consolidation and the breakout was upwards, despite the strongest volume day during the consolidation being downwards. The strongest piece of technical analysis on this chart is the horizontal trend line. It is very likely to provide support.
This analysis is published about 04:04 p.m. EST.
October 19th analysis is out.
Use the ALTERNATE HOURLY CHART invalidation point is 1,153.80.
Gold just dropped down to 1,168.99 at 3:19 pm and below the invalidation point of 1,169.15 for the hourly bull wave count.
Lara’s comment at 2:14 pm said.
“Short term if we see a new low below 1,169.15 then I would expect the correction is actually subminuette iv. Invalidatioin point 1,153.80.”
I understand that means gold is now in subminuette wave iv and invalidation point changed to 1,153.80 that gold may drop even further and the subminuette wave iii target of 1,198 won’t happen.
My technical indications at the ‘Daily’ time frame today this morning gave a ‘SELL’ for NUGT and a ‘BUY’ for DUST.
I did buy some NUGT today but sold it at $42.93 and now NUGT is at $40.87.
I won’t hold anything overnight as I believe gold may drop overnight.
I’ll have two hourly wave counts today. The main and preferred wave count will be the same as the one here, the correction will be micro wave 4.
The alternate will see the correction one degree higher, subminuette iv. It doesn’t have as good a look but it does fit on the five minute chart.
While price remains above 1,169.15 the preferred count will see this correction as micro wave 4. That has the best look on the daily chart.
I expect upwards movement to a new high from here most likely. It is a fifth wave and so it may either show a slowing of momentum, but beware, sometimes Gold exhibits swift strong fifth waves. It may be a sharp upwards movement.
The target may now be calculated at two wave degrees for the main hourly: micro and subminuette. It is a small zone 1,198 – 1,202.
Short term if we see a new low below 1,169.15 then I would expect the correction is actually subminuette iv. Invalidatioin point 1,153.80.
Overall this structure still needs to see more upwards movement. Corrections are down, the trend remains up. The structure is incomplete. It has to complete as an impulse for all the daily wave counts and I have not been able to yet see a solution which sees this as complete.
Lara,
Thanks for your timely update and reply below.
Bull looks to have been invalidated. Bear is still very much in play. Volume seems to have gained momentum to downside. Gdx is showing an evening star on weekly!
Gold stalled and DUST moving up strong and NUGT dropping hard since 10:01 am
Since the open gold hit a double top 9:30 then at 10:12 am and dropped hard and then stayed lower which causes miners to loose momentum and change direction and both NUGT had a lot to drop since the peak last week and high for the year onThursday.
DUST had a lot to move back up since the Thursday low that was a triple low for the year.
Do u believe gold is going higher per bull wave count?
Lara,
Are you charts cash GOLD or GCZ (Dec.futures)?
At 1169 did we O/L 4/1? If so, what is the alt. short term count here?
Thanks
We didn’t reach invalidation at 1169.15 yet gold stayed above so bull hourly is still valid.
thanks, was looking at Dec. futures low was 1169. Above chart is cash GOLD, what low do you show for today?
Low so far today was 1169.24 at 10:42 am
thanks, Richard
Charts are cash. On my data there is no overlap. A fourth wave can touch the end of first wave price territory, it cannot move beyond that point. The low I have is 1,169.30, the high of micro wave 1 is 1,169.15.
Lara: I have better experience with 9 ema. This average tracks prices like magic carpet and strong support when price is going higher and works as resistance like an umbrella when price is drifting down.
I am glad to learn about ADX as trend indicator. Thanks.
Just my opinion. I have been following this for long time.
“I added Kaufman’s Moving Average (red line) because ADX indicates a trend and price has broken out of a consolidation zone. “
Papudialso add the best MACD indicator you can find and check things on multiple time frames from 1 minute to 1 month as they give different opinions depending on how you want to trade intraday by the minute or longer or even much, longer like weekly, etc.
Richard
I have MACD LBR 3/10,
Which one should be used?
Agreed. It does seem to be a closer fit. I’ll use that. Thanks.
Has any wave count been invalidated at gold 1172?????
Lara: Short term I expect Monday to continue a sideways drift.
No invalidation, only if below 1169.15.
Papudi. Your post on “A Better Way Than Trading The Commercials (Swap Dealers) In The COT Data” very interesting. Please keep posting updates and charts as they are available–let’s see if this works. Thanks
Yes I will once I get it going forward. Between this chart and MTSLD’s COT data chart we should get a clear picture of COT and gold.
MTSLD/Lara
Looking at your long term chart Net position bottomed at -200000 in 2011 and peaked at +200000 in January when gold topped at 1307.
That week Lara declared that gold may be in bull trend because it crossed the red trend line and stayed above it for few days.
Soon price will tell us if bear wave count gets invalidated.
Hi Lara Is there a way to tag MTSLD’s both posts on Swap and MM Net position on side bar to refer in the future? I think this deserves to be accessible in the future for members.
This is important work and a great post for gold traders.
Thanks.
As an alternative, I can email you the spreadsheet and charts if you’d like, and I can post updates in the future.
OK you can PM me. Thanks.
How do you send a PM?
Sir MTSLD
Below is blog from another person. After reading your I switched to another blog and found this on COT. LOL.
It is screaming to go short.
—————————————————————————————–
A Better Way Than Trading The Commercials (Swap Dealers) In The COT Data
Here is a better way to trade the COT data than using the Commercials (Swap Dealers) position. The answer is to use the Producer-Merchants position (Prod_Merc_Positions_Short_ALL). This is particularly important for traders using leveraged trading instruments (DUST, NUGT, options) that experience time decay.
FIrstly it is known that the COT data suffers from the weekly lag. The Producer-Merchants data does not get around that problem. However, the Producer-Merchants data does tell the time decay trader when it is a good time to risk funds and when it is a good time to stay out of the trade.
Take the Summer of 2015 as an example. This was a terrible time for the time decay trader. The Commercials (Swap Dealers), taking the Strategic point of view, stayed short all summer. Meanwhile, the time decay trader is watching their funds shrink with no payoff. Even worse, there essentially no warning in the Swap Dealer data of the ramp up in
gold from $1178.00 to $1232.00 on May 12th through May 18th.
Ah, but the Producer-Merchant data has two advantages. First, the Producer Merchant data is very tactical or more short term than the Swap Dealer data. Secondly, the Producer Merchant data shows a trading range. So you know exactly when a short term top or bottom is occuring in Gold, perfect for the time decay trader.
To illustrate, lets again take the summer of 2015. Notice that even though the Swap Dealers were still very short Gold around 5/5/2015, the Producer Merchants were at the bottom of their trading range, essentially they were long – not short – Gold. Immediately after this we had the rally in Gold from 1178 to 1232. With a leveraged fund or options,
not only would you have saved yourself from a loss, you could have traded the rally too. As an added bonus, the Producer Merchant data quickly reversed position and said to go short 5/19/2015. This is trader’s heaven.
And what is the Producer Merchant data saying about Gold now? It is screaming to go short. The Producer Merchant data has never been this short since 1/27/2015. And this doesn’t even include the last few days when Gold was around 1190.
Producers destroyed themselves during the gold bull market because they were shorting on the way up as hedges. In 2011 gold was getting so high they started taking hedges off, and then gold got crushed and they lost again. I haven’t dug into it in detail but producers have a reputation of not being so smart, and their debt covenants may require hedging regardless of what good is doing. I’ll have to look at producers a little closer and see what I find.
I agree. Barrick was the last one near top of gold market to clear hedge book. Now Barrick stock price is down to below 2001 price level. LOL. How smart is this producer???
Thanks. We need to get an edge over these commercials and Money Managers.
Attached is a chart from the COT analysis I do each week. I have posted this here before, but its been a while. Background – I read one time that the banks are reversion to the mean traders, so I wanted to find a way to measure when Swaps and Managed Money were building momentum in opposing positions against each other. What I calculate is the Swap and MM Net positions excluding spreads – so straight up – Long minus short = Net. Then, I calculate the spread/difference/divergence between the two. Once I have that, I sum up the weekly differences for the past 10 weeks (I tried 7, 8, 12 weeks, but 10 seems to work well). Attached is the chart it produces. I have some guesses on when we peak based on the supporting analysis, but because these are weekly data points, it’s tough to be too accurate. With that said, we are in topping range, but when ever I have followed these on the way up, they always take longer to peak than I expect, so I am thinking somewhere around 2 to 3 COT survey dates from now. You can see that we are in the caution zone.
I ignore options, and I ignore small specs and producers. In my analysis of COT data since 2006, in a bull market, the blue like peaks with higher highs and troughs with higher lows in every occasion except one. And in the gold bear market since 2012, the blue line peaks with a lower high in all cases and troughs with a lower low in all cases but one. If this trend holds, and we are still in a bear market, I would expect that gold will not exceed 1214 on a closing bases on a COT survey date, and that we will be heading lower, below the last lows for the trough.
It could be though that we are switching from Bear to Bull. I will post second chart where you can see the flip in the blue line when we switched from Bull to Bear at the end of 2011.
2010 to current…notice the deep blue line trough when going from Bull to Bear in late 2011.
MTLSD thank you very much for posting these charts.
I’ll take some time to study this before I make any further comment. I’m still getting familiar with how to use COT data. The next thing I’m adding to the list.
Swap is same as commercial shorts or Net short??? Where do find MM positions?
great analysis of COT. I have not seen this before.
Wish you post every week for members benefit.
Thanks for posting.
Commercials are made up of two categories – producers and swaps. Non commercials are made up of managed money, other, and non reportable.
I will post more regularly, although it may not be every weekend.
Thanks. Correct it does not require every weekend. Only at extreme top and bottom should be nice. But currently need to keep on top of it.
Good work!!!!
Here is a blow up.
It is good for short term.
A new found TA is from LARA’s writeup on ADX everyday. Spot the trend change and use of TSI will indicate a sustain impulse move.
Currently following ADX trend to get comfortable for a low risk trade.
I will post a chart of US Oil to prove the point and Lara’s ADX analysis.
Anybody use TSI as an indicator?
Just started looking at it last night and stated to draw some trend lines.
Looks like dust is ready to go like it did back at the end of august.
Lets see how it plays out.
Yes I have been using TSI for some time. It is great for short term trading. TSI (7,4,7) is the one I use in 2 hour period to time the trade for high momentum stocks.
Along with TSI I use LBR 3/10 oscillator Richard inspired indicator. Both in conjunction works well right to the price point.
It will be nice if others use this and post the buy and sell points for trades in any 3xetfs.
I did post several times in the past but there was no interest. So I stopped posting.
Looking forward to your post.
The buy and sell signals are when price gets extreme tweek TSI at -60 or below a buy and sell when TSI is +60 and above.
Look out for my chart in future.
Potential Dust count
U.S. Dollar, Fed Speeches To Drive Gold Next Week
Friday October 16, 2015 14:32
http://www.kitco.com/news/2015-10-16/U-S-Dollar-Fed-Speeches-To-Drive-Gold-Next-Week.html
Next week, traders will be watching appearances by Fed officials for fresh clues on the outlook for monetary policy. Governor Brainard speaks at 10 a.m. ET on Monday, Governor Powell speaks at 8:15 a.m. on Tuesday and Fed Chair Yellen speaks at 11 a.m. ET on Tuesday.
Rambus interview by Cathrine Fist::
http://solari.com/Library/2015/Q2/rambus.html
Long interview, but enjoyed reading about the history of the site and the relationship with Fullgoldcrown. Thanks for posting.
Dollar charts sure are compelling for an upwards breakout. Waiting…….
COT data
Commercial shorts continue to soar.
Shorts at 355791 change + 31440.
Commercials net shorts: 128106 change +30071
Soon gold will reach the target and then may drop big.
I’m starting to watch this indicator more closely. I want to know how long it can remain at an extreme before a trend changes.
And I want to follow it to learn by practice (feel? intuition?) if my textbooks are correct when they state that the large players are usually on the right side of the market.
I expect that is correct. I just want to follow this for a while to see it for myself and become comfortable with it before I start incorporating it into my daily analysis.
So thank you for you for posting this information. It’s useful and we’re taking note.
Last week, Matt’s “Final line of resistance” got me playing around with long term trend lines. While I misunderstood where he was placing the control points, I slapped this chart together with parallel fib divisions, which I’ll put up here again for reference. Call it the 2AM chart.
It’s been intriguing me all week so I’ve been playing the “What would Lara Say?” game with it. I can’t remember ever doing an analysis using trend lines like this before so I may not really know what I’m talking about. I’ll post where I got to with it below for everyone’s consideration over the weekend. Criticism is fine, let ‘er rip.
Something worth thinking about?
Your first (highest) trend line (with the arrows) is a bear market drawn in the way Magee would advocate (“Technical Analysis of Stock Trends”, one of my favourite books).
And that right there is the problem with deep second wave corrections in a bear market. They make the bear market trend line close to horizontal, or at least very shallow. Which means price has to move a VERY long way up to breach them. And so the bear market would be well and truly over long before that trend line confirms the change.
So it’s not really very useful. Which is why I’m not using that method at this time for this market.
I’m thinking a breach of the 50% line followed by a retest and then a weekly rally on high volume would put the bear to bed. You’re right about taking out the top line, by then its game over anyway. The 38.2 and 61.8 lines are where the money will be made or lost – maybe.