
Upwards movement was expected.
Price moved slightly lower first to invalidate the main hourly Elliott wave count and confirm the alternate, and then price moved higher to complete a green candlestick.
Summary: Upwards movement should continue to the target which is now at 1,222 – 1,226. The target may be met now in a further four days trading, if this fifth wave lasts a total Fibonacci five sessions .
To see weekly charts for bull and bear click here.
New updates to this analysis are in bold.
BULL ELLIOTT WAVE COUNT
DAILY – TRIANGLE
Click chart to enlarge.
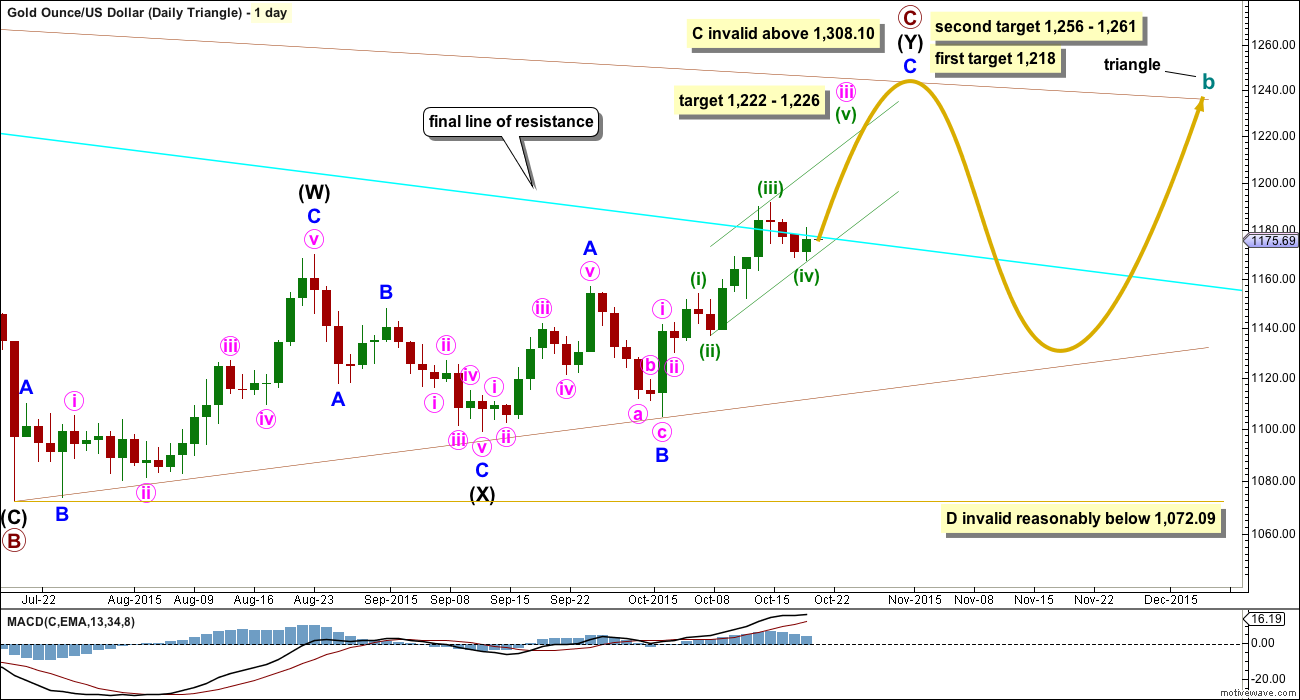
This first daily chart looks at what a triangle would look like for cycle wave b. The triangle would be a running contracting or barrier triangle. Within the triangle, primary wave C up must be a single or multiple zigzag. Primary wave C may not move beyond the end of primary wave A above 1,308.10.
This idea slightly diverges from the other two ideas for cycle wave b as an expanded flat or combination.
The expected direction is still exactly the same, and the current upwards structure is still seen as an impulse. The first short term target is changed. At 1,222 minuette wave (v) would reach equality in length with minuette wave (i). At 1,226 minute wave iii would reach 2.618 the length of minute wave i. This target is higher than the first target for the end of primary wave C, so if the short term target is only the end of minute wave iii, then the second higher target would be more likely for primary wave C.
The first target at 1,218 is where primary wave C would reach 0.618 the length of primary wave B. If price gets up to the first target and the structure of minor wave C is a complete five wave impulse, then it may be over there.
The second target at 1,256 is where minor wave C would reach 2.618 the length of minor wave A, and at 1,261 primary wave C would reach 0.8 the length of primary wave A.
For the triangle idea, for cycle wave b, a five wave impulsive structure only needs to complete upwards. The next wave down for primary wave D should be fairly time consuming, lasting about 2 to 6 months. Primary wave D may not move beyond the end of primary wave B at 1,072.09 for a contracting triangle. Alternatively, primary wave D may end about the same level as primary wave B at 1,072.09 for a barrier triangle, as long as the B-D trend line remains essentially flat. In practice this means primary wave D can end slightly below 1,072.09 and this wave count remains valid. This is the only Elliott wave rule which is not black and white.
DAILY – COMBINATION
Click chart to enlarge.
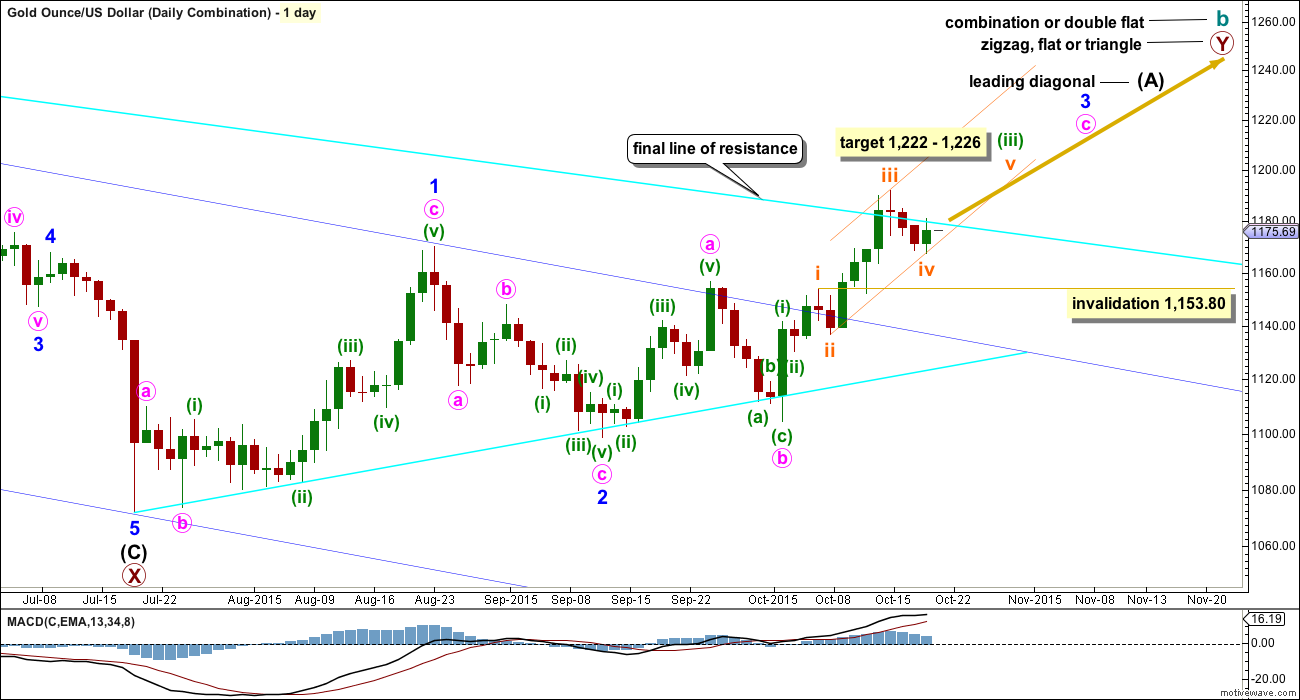
If cycle wave b is a combination, then the first structure in the double combination (or double flat) was an expanded flat. The double is joined by a three in the opposite direction labelled primary wave X which was a zigzag.
The second structure in the double may be another flat for a double flat, or it may be a zigzag or triangle for a double combination. Because a triangle for primary wave Y would essentially make the whole of cycle wave b the same as a triangle for cycle wave b, this chart will focus only on a possible zigzag for primary wave Y.
If primary wave Y is a zigzag, then intermediate wave (A) must be a five wave structure and may be unfolding as a leading diagonal.
If primary wave Y is a flat correction, then intermediate wave (A) must be a three wave structure and may be unfolding as a double zigzag (this idea is how the first chart, Daily – Triangle, labels upwards movement).
For all possibilities, a five wave impulse is still required to complete upwards. The short term target for all three bull wave counts is the same at 1,222 to 1,226.
Subminuette wave iv may not move into submineutte wave i price territory below 1,153.80.
DAILY – EXPANDED FLAT
Click chart to enlarge.
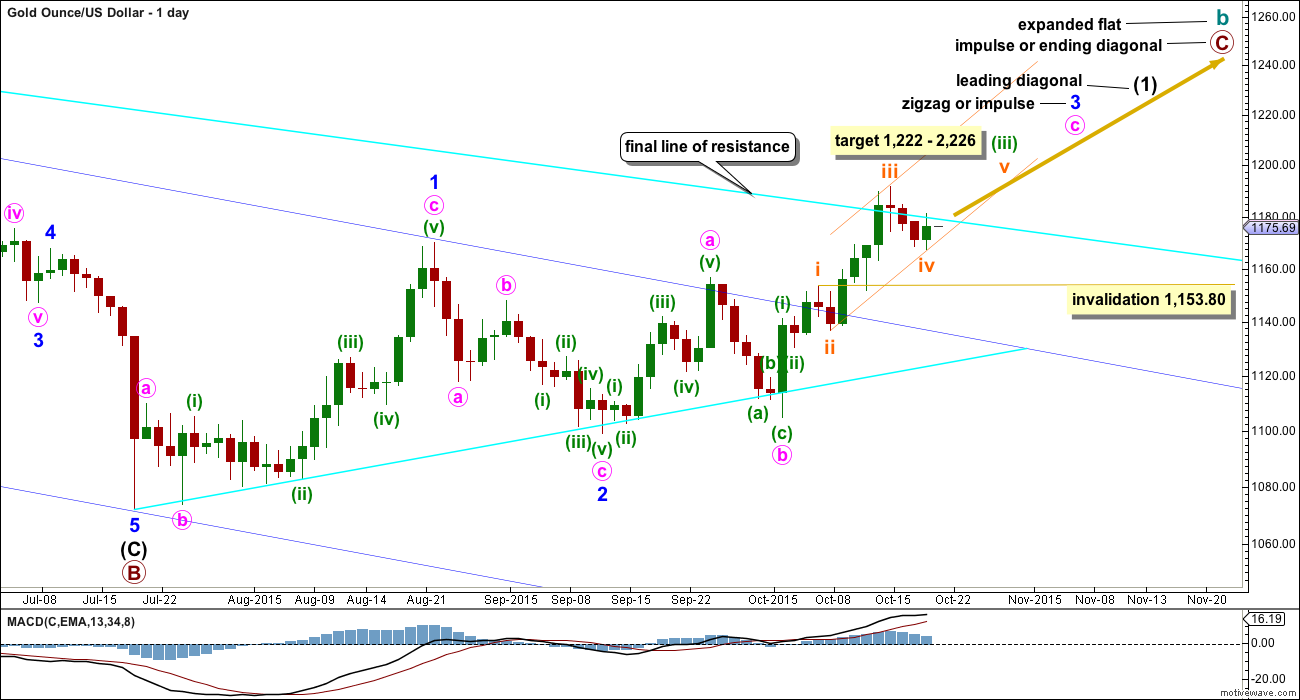
Cycle wave b may also be a flat.
If cycle wave b is an expanded flat, then primary wave C must be a five wave structure. If the current diagonal unfolds as a contracting diagonal (most common), then it would be intermediate wave (1) of a five wave impulse upwards for primary wave C. If the current leading diagonal unfolds as an expanding diagonal, then the degree of labelling within primary wave C may be moved up one degree because an expanding diagonal may be an ending diagonal for primary wave C in its entirety.
At 1,197 minor wave 3 will pass equality in length with minor wave 1. Above that point the diagonal must be expanding and not contracting.
A leading diagonal requires the second and fourth waves to subdivide as zigzags. The first, third and fifth waves are most commonly zigzags, but sometimes may appear to be impulses. So far minor wave 1 fits well as a zigzag.
Minor wave 2 is 0.73 the depth of minor wave 1, nicely within the normal range of between 0.66 to 0.81 for a second wave within a diagonal.
Third waves within leading diagonals are most commonly zigzags, but sometimes they may be impulses. Minor wave 3 is now showing some increase in upwards momentum beyond that seen for minor wave 1. Minor wave 3 has moved above the end of minor wave 1 above 1,170.19.
There now looks like a five up on the daily chart within minor wave 3. This may be minute wave a within a zigzag or it may also be minute wave i within an impulse.
Current upwards movement would be minute wave c or minute wave iii. Either way, it must subdivide as an impulse. On the hourly chart so far the structure still looks incomplete.
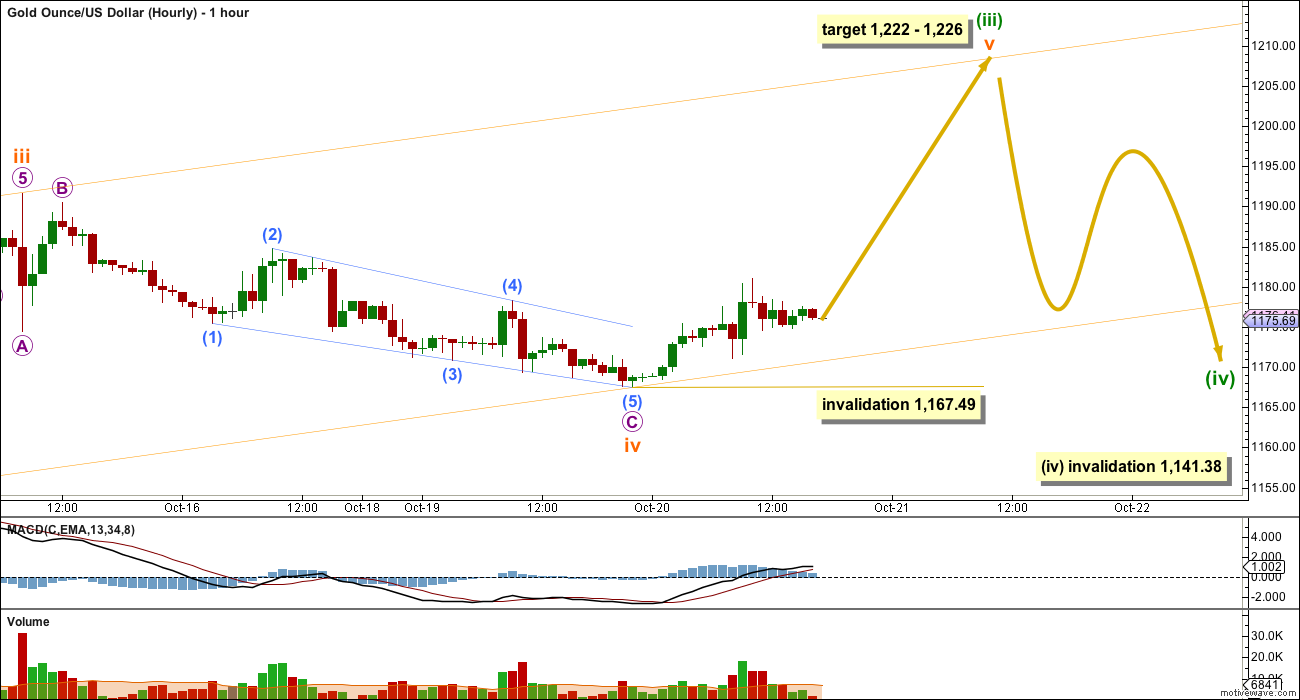
The hourly chart below will suffice for all three bull wave count ideas. For the triangle idea, the labelling would be the same except it should be moved up one degree.
MAIN HOURLY CHART
Click chart to enlarge.
A slight overlap back into micro wave 1 territory indicates this last correction may not be micro wave 4. Micro waves 3 and 4 may have already been complete and the correction may have been subminuette wave iv.
No second wave correction may move beyond the start of the first wave below 1,167.49 within subminuette wave v.
Draw a channel about this third wave as shown on all the daily charts using Elliott’s second technique: the first trend line from the ends of the second to fourth wave, then a parallel copy on the end of the third wave. Subminuette wave v may end either midway within the channel, or it may end about the upper edge.
Gold often exhibits swift strong fifth waves (be aware of this tendency). Subminuette wave v does not have to be swift and strong, but it may be.
If subminuette wave v reaches equality in duration with subminuette wave iii as well as length, then it may last a further four days to complete in a total Fibonacci five.
BEAR ELLIOTT WAVE COUNT
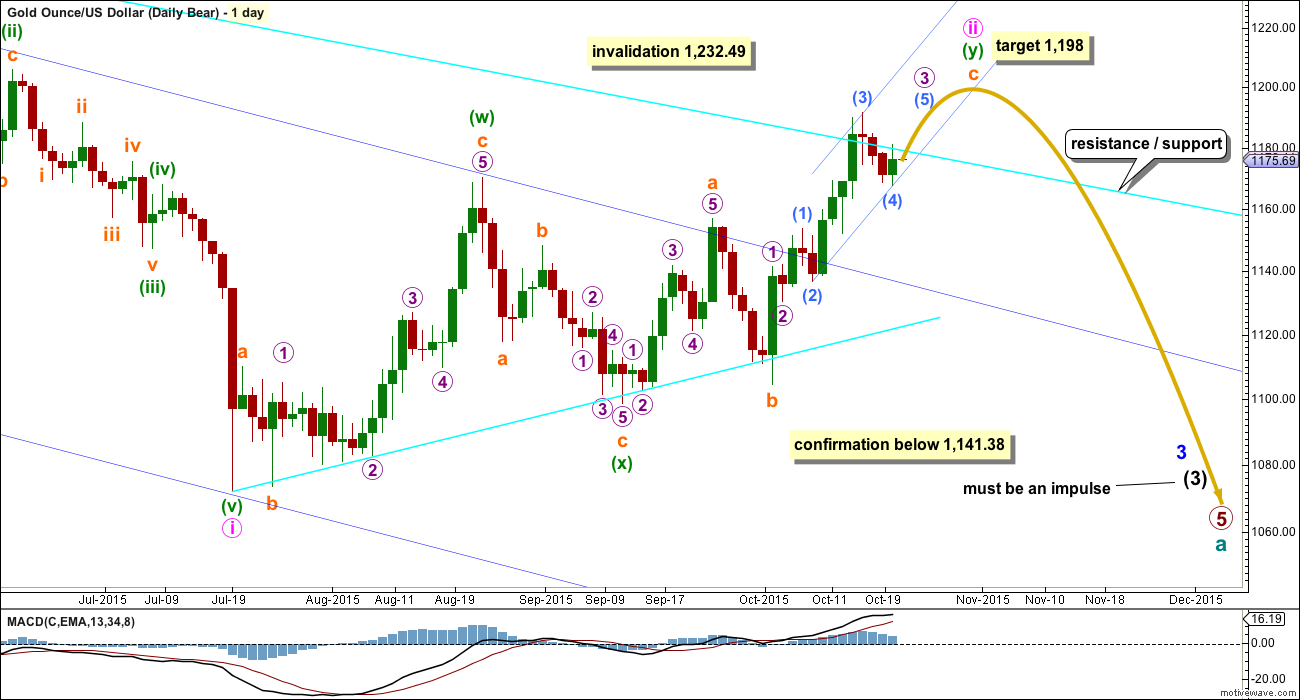
Click chart to enlarge.
The final line of resistance (bright aqua blue line copied over from weekly charts) is only overshot and not so far properly breached. While this line is not breached the bear wave count will remain possible. Simple is best, and the simplest method to confirm a trend change is a trend line. While price remains below this line, it must be accepted that Gold has been in a bear market since 2011 and we don’t have technical confirmation that the bear market has ended.
The only option now for a bear wave count is to see minute wave ii continuing higher as a double zigzag.
Minute wave ii has strongly breached the dark blue base channel drawn about minor waves 1 and 2. When a lower degree second wave correction breaches a base channel drawn about a first and second wave one or more degrees higher, then the probability of the wave count reduces, particularly at higher time frames.
The structure of upwards movement for the bear wave count is exactly the same as the bull for the short term: a five wave impulse is unfolding upwards and it is incomplete.
Minute wave ii may not move beyond the start of minute wave i above 1,232.49. A new high above that price point would be final price invalidation of any bear wave count. That would fully eliminate the concept that Gold remains in a bear market. No bear wave count should be considered above that point.
TECHNICAL ANALYSIS
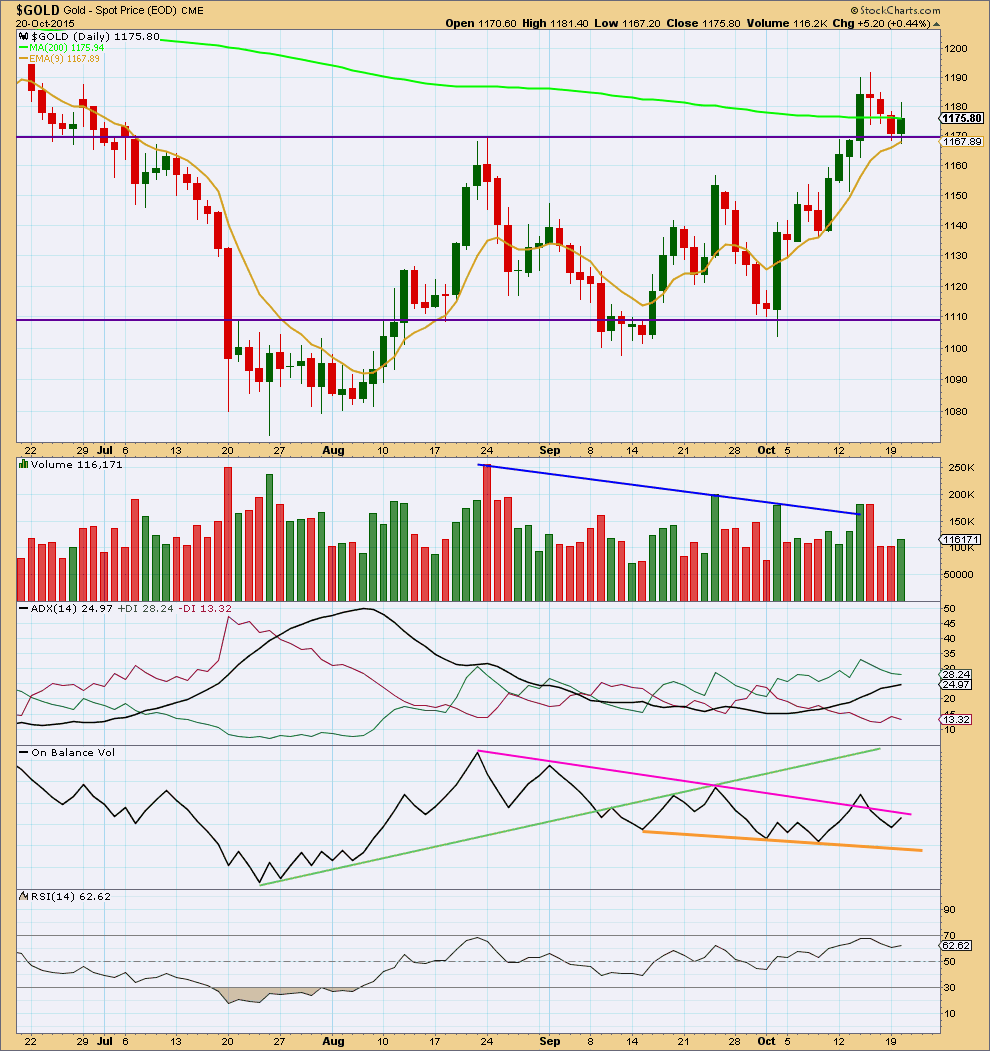
Click chart to enlarge. Chart courtesy of StockCharts.com.
Daily: Tuesday’s upwards day comes on some increase in volume. There is some support for upwards movement.
As expected price is finding support about the horizontal trend line which previously provided resistance. When price breaks through trend lines and then throws back, if ADX indicates a clear trend is evident, then it offers a good opportunity to join the trend.
ADX is rising and comfortably above 20 indicating a new trend. The trend is upwards with the +DX line above the -DX line.
The pink trend line is not working well for On Balance Volume. It is not technically significant enough. OBV may now find some support at the orange trend line, but that too is too short lived and not tested enough to be highly technically significant. It may provide some weak support.
RSI is not yet overbought. There is room for further upwards movement.
I added a 9 day EMA. This is showing nicely where price is finding support while the upwards trend continues.
I removed Stochastics. Oscillators should be used in range bound markets, and this market is not currently range bound. Moving Averages and trend lines should be used for trending markets.
Overall, it looks like Gold has broken out of the recent consolidation and the breakout was upwards, despite the strongest volume day during the consolidation being downwards. The strongest piece of technical analysis on this chart is the horizontal trend line. It is very likely to provide support.
This analysis is published about 06:31 p.m. EST.
IMHO: Gold price is currently struggling to rise above 1168-70 with 1178-80 still seen as curtailing subject to rise and sustain above 1173… Bearish pressure is too great with Stochastic %K remains below %D on 9dma through to 100dma… A drop of 5dma below 200dma probably did not help and likely caused the sudden drop…. Fully support Lara’s wave counts and eager to see them play out for the upside…
I am going to move the degree of labelling of this correction up one more degree. I’m going to see it as minuette wave (iv).
Upwards movement to new highs is still expected, but it makes a difference to target calculation.
The new target will be 1,198 – 1,200
Meanwhile…. over at US Oil….
It looks like finally there is some confirmation of a downwards trend returning.
While Gold is complicated with both bull and bear wave counts, US Oil has only one wave count which has been behaving rather well lately.
A simple trend line there (have outlined how to work with it in the comments for US Oil) may be a nice technique to manage risk and find an entry.
The hourly chart invalidation was unexpected. The daily chart invalidation point has not yet been breached. This would be the fourth wave of subminuette iv moving lower.
I have it as most likely a double zigzag or double combination (the first structure may be seen as either a zigzag or flat).
The C wave of the second structure, the downwards movement that breached the invalidation point, I am looking at on the five minute chart to see if it is a complete five wave impulse. And for the middle of the third wave I’m looking at the one minute chart.
It may be a complete five down. Sometimes Gold has strong fifth waves at the end of it’s third waves, and that forces the fourth wave corrections to be really shallow and quick. That looks like what’s happened at lower time frames.
However, it could still have a final fifth wave down to end it (I think this is possible but less likely). A new high above 1,173.27 (the end of the first wave price territory within the five wave impulse for wave C) could not be a fourth wave correction, at that stage the C wave should be over.
A new high above 1,173.27 would provide some confidence that an upwards trend has likely returned.
Lara,
Thanks for your update. If you have time later could you update $USD analysis.
Also last analysis on Sept 23rd the daily chart, seems not tobe the USD as the high was at 100.39 in March?
I can only use the data I have. It’s the US Dollar Index from FXCM.
When I update USD analysis that will be the data feed I’m using to update it.
Thanks
London Gold Market Sentiment ‘Concerning,’ Gold Driven Mainly By USD
– CME Group – Oct 21, 2015
http://www.kitco.com/news/video/show/LBMA-2015/1097/2015-10-21/London-Gold-Market-Sentiment-Concerning-Gold-Driven-Mainly-By-USD—CME-Group
Yes I know that Elliott Wave ignores the US Dollar. Which I used to agree with however in the last year I see and follow the inverse connection between Gold and the US Dollar even though it does vary. — Richard
The Gold cash market I’m analysing is Gold in USD, and so in this instance they should be correlated by quite a large degree.
Which is why I’m keeping an eye on the USD wave count.
They don’t have to move perfectly together, but their direction should be about the same each day (opposite).
For USD I’m expecting a triangle to still complete for a fourth wave; choppy overlapping movement. Right now the triangle for USD may move the C wave lower as Gold moves higher. When that’s done the triangle for wave D of USD may move USD higher while Gold moves lower for a correction. The final wave of E for the USD triangle may move USD lower while Gold moves higher to complete the impulse upwards. That’s how I see it possibly unfolding over the next while anyway.
My MACD indicator has right now a SELL NUGT and GDX at all time frames from 1 minute up to 1 day and only a BUY at weekly and monthly time frames.
It looks like a bearish direction change today.
Invalidating the hourly bull wave count was a surprise.
Makes me concerned about buying GDX or NUGT today for the bullish high target?
A VIEW: Dissappointing that Gold price was having trouble getting past 1180-83, now hard to see this back up above 1175-76 in a hurry… A break below support 1158 (rising by about $6 a day) will likely turn this on its head for further downside continuation….
I thought that JDST could go to 27 – 28 area, but I just don’t like the price action. Sold at 24.95…sidelines are less stressful…better than a $2 gain–not going to risk losing that. I really don’t like going against Lara’s calls…
With the drop to 1165.18 so far (I think it is not the end of the drop yet), we should still be in minuette 4. It is an ABC correction, 5 waves down, 3 waves up, and now most likely in the third of five waves down for C.
Alan or anyone do you think that today’s low of 1,163.95 at 10:37 am was the 5th of 5 waves down for wave C of Minuette 4 and then gold moves up from there towards 1,198 or 1,224-1226 area and are you buying NUGT at this point or already have it?
Richard. I think it is only the 3rd of five waves down for subminuette c of minuette 4.
Wave C should complete at 1160 – 1158.
Furthermore, the next major support for NUGT is at 36.19. I will wait.
Alan thank you for your wave count.
Alan wow an awesome wake up call of a wave count. That clarifies things.
I will wait to buy GDX or NUGT until I have time frames giving BUY as they will drop if gold stalls at this price and drop hard with another $6 to $8 drop in gold unless it happens fast then starts the long awaited 5th wave up soon.
I’ll wait for Lara’s pre-close comments.
Hourly chart just invalidated below 1,167.49 as gold just dropped down to 1,165.18 at 9:49 am EST
More detail for the hourly chart.
This does not mean I expect a red candlestick for Wednesday. Micro wave 2 may also be over already. If it’s not it shouldn’t take long to be done.
Upwards movement is still expected overall for Wednesday.
Lara thanks for the last minute update.