
Downwards movement was expected, but price breached the invalidation point on the hourly chart first providing much confusion with the wave count.
Summary: In the mid term, downwards movement should continue to at least 1,144. In the short term, a retracement of today’s price shock may end about 1,171. A new low below 1,120.32 would be very bearish at this stage.
To see weekly charts for bull and bear click here.
New updates to this analysis are in bold.
BULL ELLIOTT WAVE COUNT
DAILY – COMBINATION
Click chart to enlarge.
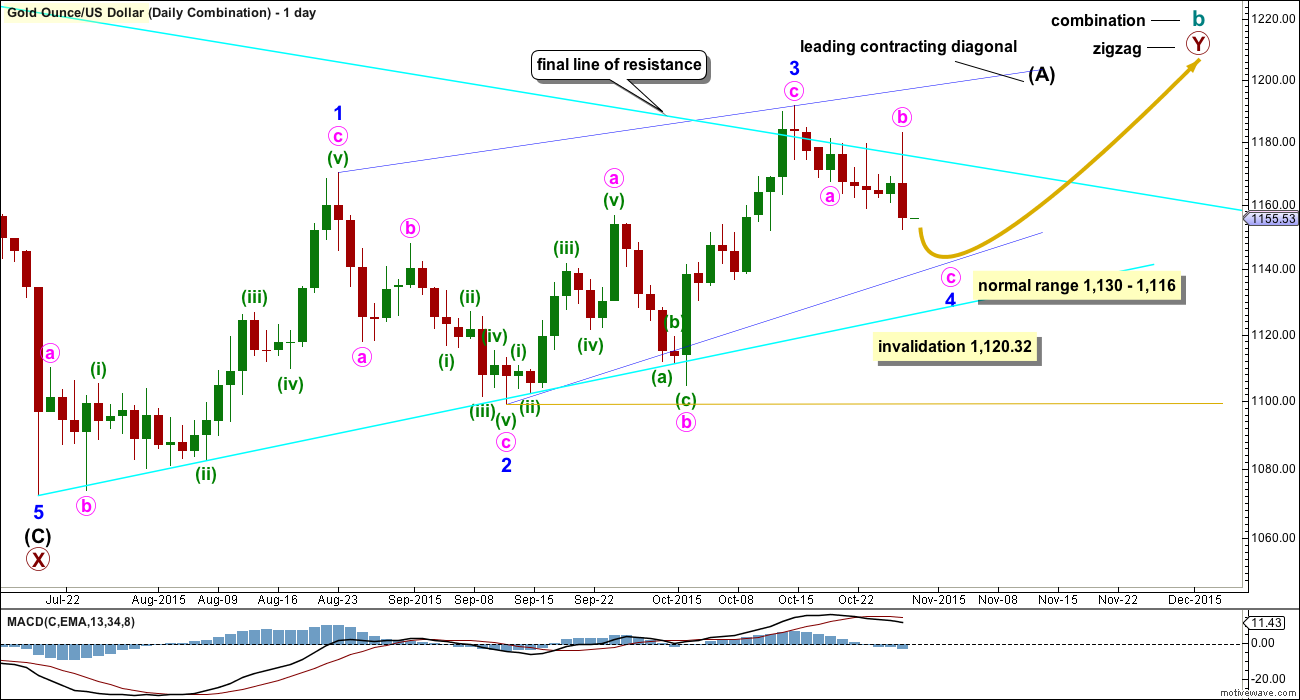
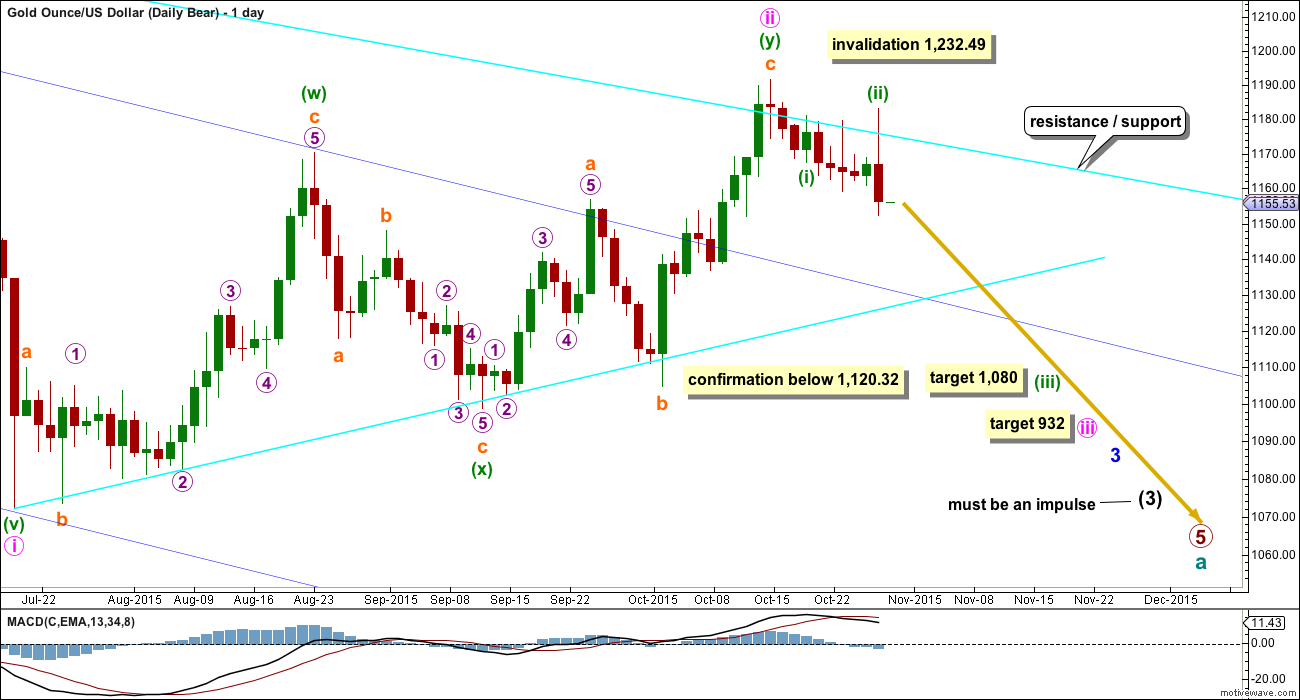
If cycle wave b is a combination, then the first structure in the double combination (or double flat) was an expanded flat. The double is joined by a three in the opposite direction labelled primary wave X which was a zigzag.
Downwards movement of the last several days looks now to be too large in price and duration to be part of the prior upwards wave, which now looks like a separate wave. Minor wave 3 may be a complete zigzag of a leading diagonal. Minor wave 3 is shorter than minor wave 1, so the diagonal would be contracting which is the most common type particularly for a leading diagonal. This limits minor wave 4 to no longer than equality in length with minor wave 2. Minor wave 4 may not move below 1,120.32.
A five wave structure would be developing upwards for this wave count as a leading contracting diagonal. Because primary wave Y would be beginning with a five wave structure, this reduces the possible structures to a zigzag. Cycle wave b as a combination would be a flat – X – zigzag.
The normal range for a fourth and second wave within a diagonal is between 0.66 to 0.81 the prior actionary wave. That gives a normal range for minor wave 4 from 1,130 to 1,116. Minor wave 4 must end at the upper edge of the normal range (or above) to remain above the invalidation point.
DAILY – EXPANDED FLAT
Click chart to enlarge.
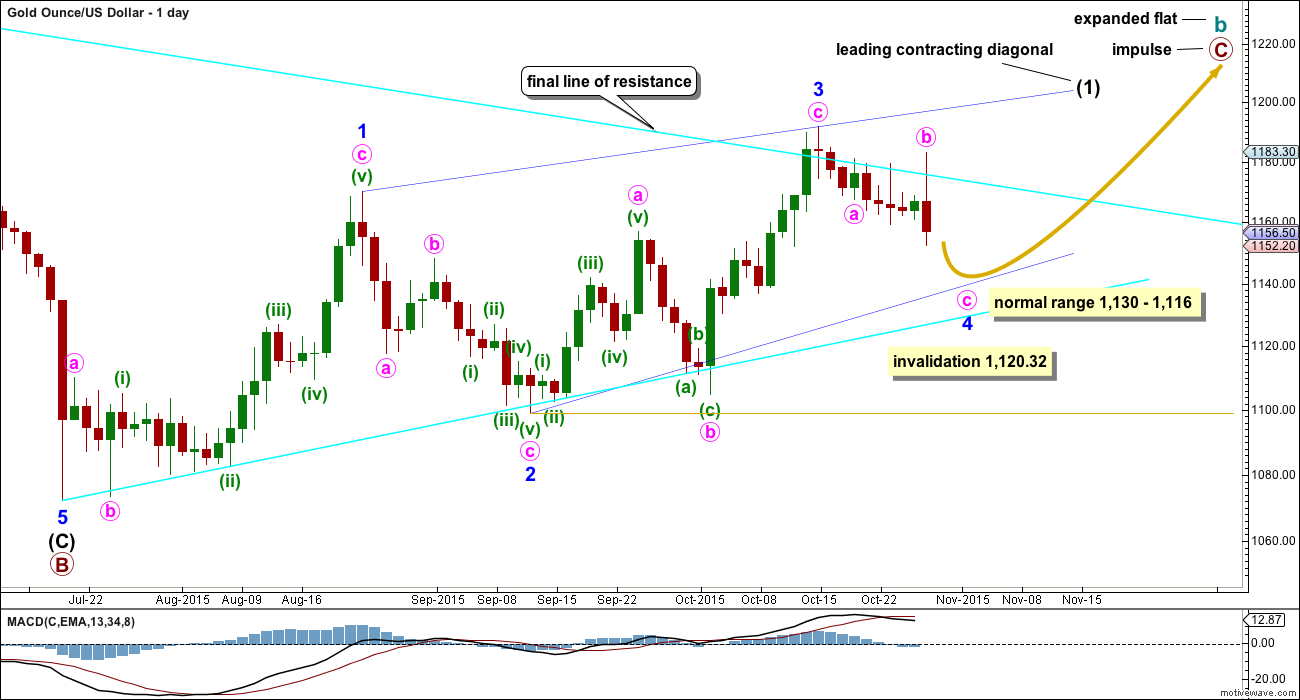
Cycle wave b may also be a flat.
If cycle wave b is an expanded flat, then primary wave C must be a five wave structure. The current upwards wave may be unfolding as a leading contracting diagonal, so this would be minor wave (1) within primary wave C.
There are two possible structures for a C wave within a flat correction: an impulse or an ending diagonal. If the first wave is a five and not a zigzag, then an ending diagonal may be ruled out because ending diagonals require all sub waves to be zigzags. Primary wave C may now only be an impulse.
A leading diagonal requires the second and fourth waves to subdivide as zigzags. The first, third and fifth waves are most commonly zigzags, but sometimes may appear to be impulses. So far minor waves 1 and 3 both fit well as zigzags.
Minor wave 2 is 0.73 the depth of minor wave 1, nicely within the normal range of between 0.66 to 0.81 for a second wave within a diagonal.
The hourly chart below works for both these first two daily charts.
HOURLY CHART
Click chart to enlarge.
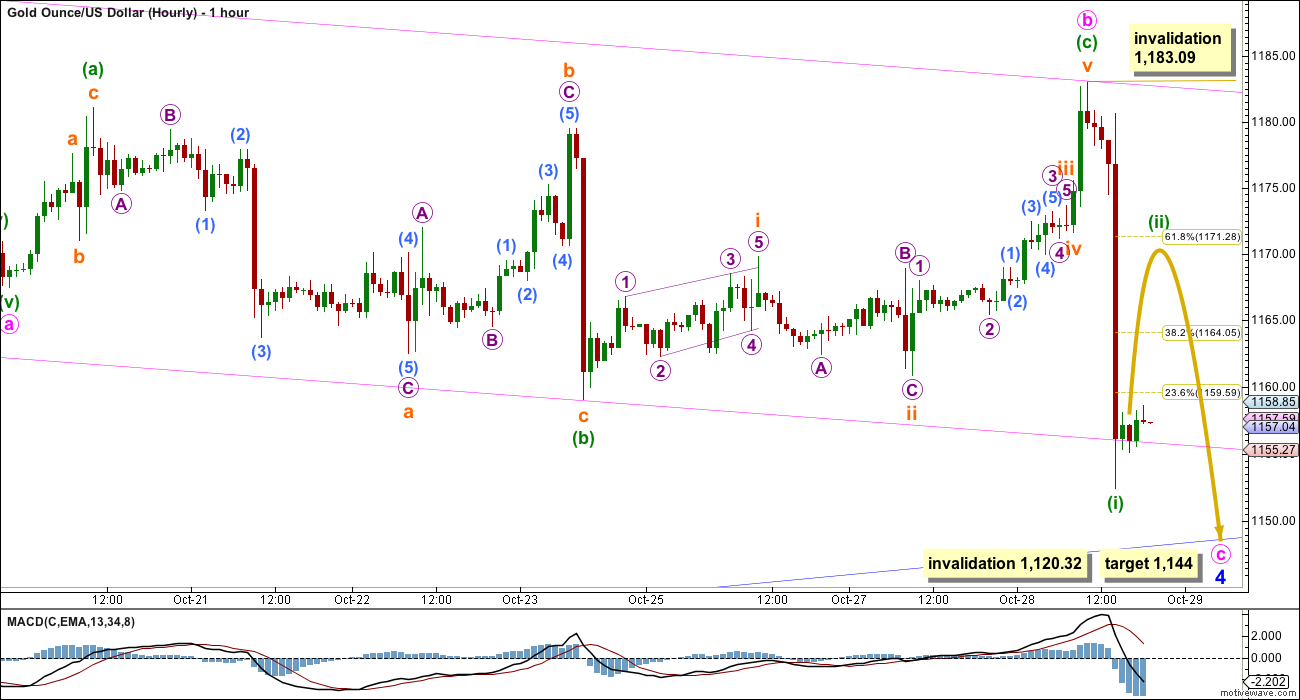
The upwards movement which invalidated yesterday’s hourly wave count will fit best as a continuation of minute wave b. Minute wave b subdivides perfectly as an expanded flat. Minuette wave (b) is a 1.62 length of minuettte wave (a), and minuette wave (c) is 2.08 longer than 1.618 the length of minuette wave (a). Minuette wave (c) moves slightly beyond the end of minuette wave (a) avoiding a truncation.
The pink channel is a best fit about this downwards movement. Draw the first trend line from the start of minute wave a to the end of minute wave b, then place a parallel copy on the low labelled minuette wave (b) so that all downwards movement is contained. The lower edge may provide some support, and after it is breached may provide some resistance.
Although minor wave 4 could be a complete zigzag at today’s low, it is unlikely to be over there if the bigger picture (a leading diagonal unfolding upwards on the daily chart) is correct. Fourth waves within diagonals are not normally that shallow.
At 1,144 minute wave c would reach 1.618 the length of minute wave a.
Price shocks like this one which moved price quickly lower during Wednesday are often all or almost all retraced. Minuette wave (ii) may be likely to end about the 0.618 Fibonacci ratio of minuette wave (i) at 1,171. It does not have to end there, it may also end about the 0.382 Fibonacci ratio, but in this instance the 0.618 ratio would have a higher probability.
When minuette wave (ii) is complete, then minuette wave (iii) downwards should unfold and may show an increase in momentum beyond that seen for minuette wave (i).
Minuette wave (ii) may not move beyond the start of minuette wave (i) above 1,183.09.
DAILY – TRIANGLE
Click chart to enlarge.
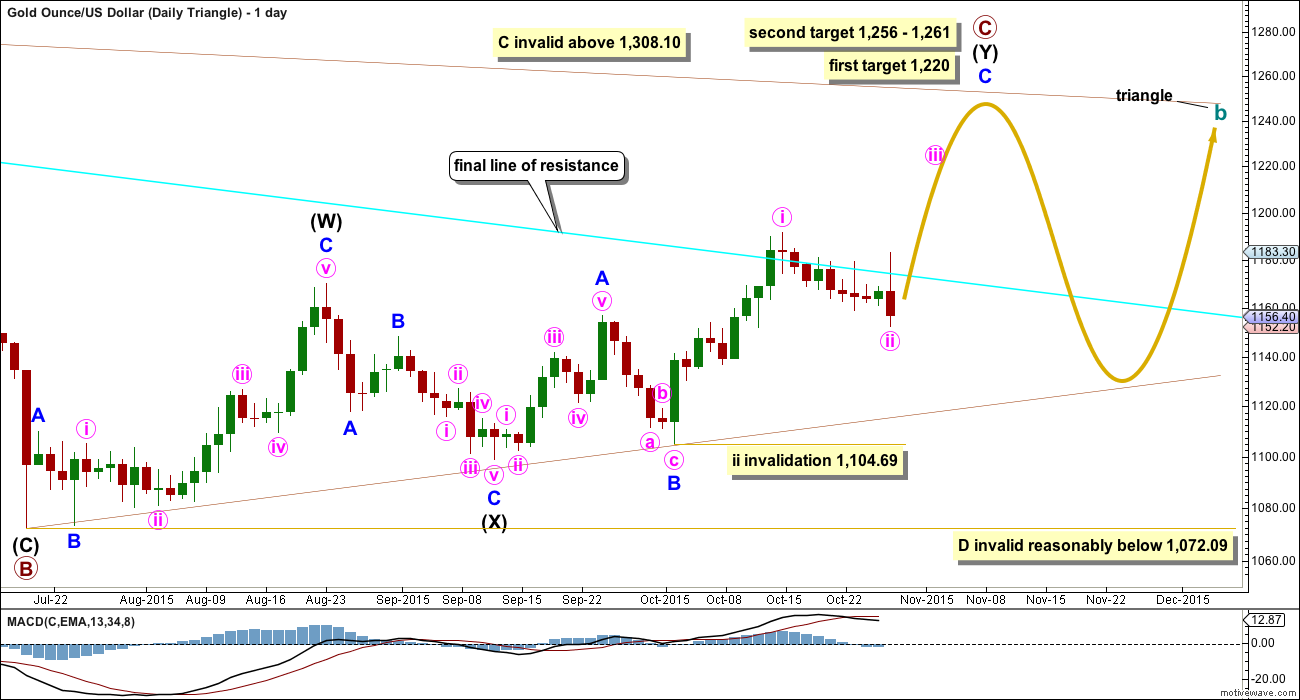
This daily chart looks at what a triangle would look like for cycle wave b. The triangle would be a running contracting or barrier triangle. Within the triangle, primary wave C up must be a single or multiple zigzag. Primary wave C may not move beyond the end of primary wave A above 1,308.10.
This idea slightly diverges from the other two ideas for cycle wave b as an expanded flat or combination.
If a triangle is unfolding, then at the weekly chart level primary wave C looks unlikely to be complete and should move higher for the triangle to have the right look. This wave count sees upwards movement as incomplete for minor wave C with a final fifth wave yet to unfold. At 1,220 minute wave v would reach equality in length with minute wave iii. This would see primary wave C end close to 0.618 the length of primary wave B. One of the five sub waves of a triangle is commonly about 0.618 the length of its predecessor.
The second target at 1,256 is where minor wave C would reach 2.618 the length of minor wave A, and at 1,261 primary wave C would reach 0.8 the length of primary wave A.
For the triangle idea, for cycle wave b, a five wave impulsive structure only needs to complete upwards. The next wave down for primary wave D should be fairly time consuming, lasting about 2 to 6 months. Primary wave D may not move beyond the end of primary wave B at 1,072.09 for a contracting triangle. Alternatively, primary wave D may end about the same level as primary wave B at 1,072.09 for a barrier triangle, as long as the B-D trend line remains essentially flat. In practice this means primary wave D can end slightly below 1,072.09 and this wave count remains valid. This is the only Elliott wave rule which is not black and white.
HOURLY – TRIANGLE
Click chart to enlarge.
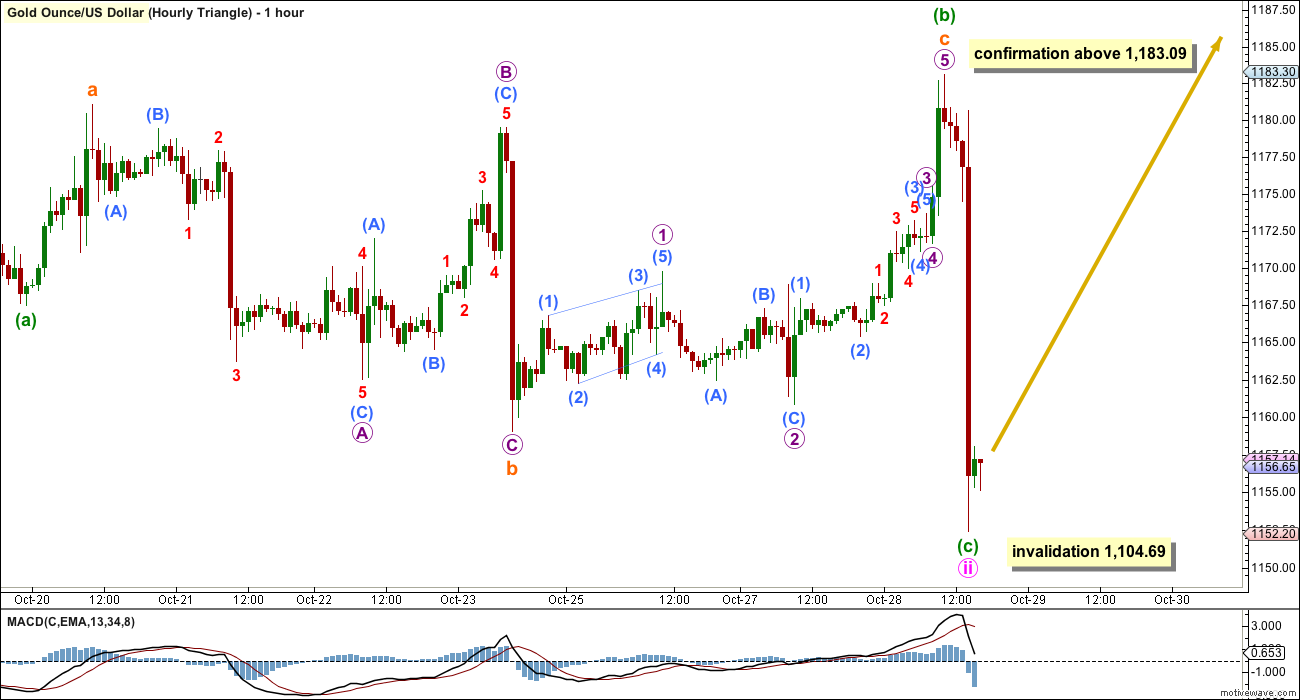
The subdivisions within downwards movement for the hourly chart for the triangle are exactly the same as for the first hourly chart. A 5-3-5 down is complete, here labelled minuette waves (a), (b) and (c).
For this triangle idea, this may be a completed zigzag for minute wave ii.
A new high above 1,183.09 should provide some confidence that a three down is complete and a new upwards wave is underway.
If minute wave ii continues any further (and minuette wave (c) within may yet continue lower), then it may not move beyond the start of minute wave i below 1,104.69.
BEAR ELLIOTT WAVE COUNT
Click chart to enlarge.
The final line of resistance (bright aqua blue line copied over from weekly charts) is only overshot and not so far properly breached. While this line is not breached the bear wave count will remain possible. Simple is best, and the simplest method to confirm a trend change is a trend line. While price remains below this line, it must be accepted that Gold has been in a bear market since 2011 and we don’t have technical confirmation that the bear market has ended.
The most likely possibility is that minute wave ii is a complete double zigzag and deep at 0.75 the length of minute wave i for the bear wave count. It has breached the dark blue base channel drawn about minor waves 1 and 2, one degree higher. When a lower degree second wave correction does this it reduces the probability of the wave count but does not invalidate it. Base channels most often work to show where following corrections find support or resistance, but not always.
At 932 minute wave iii would reach 1.618 the length of minute wave i.
If minute wave ii were to continue further, it may not move beyond the start of minute wave i above 1,232.49. A new high above that price point would be final price invalidation of any bear wave count. That would fully eliminate the concept that Gold remains in a bear market. No bear wave count should be considered above that point.
Although the subdivisions at the hourly chart level are the same for all wave counts, I will provide a separate hourly chart for this bear wave count to avoid any confusion. At this stage, it does not mean I consider this wave count to have a higher probability because I do not, but I do wish to stress it is entirely technically possible and we do not have technical confirmation that Gold has changed from bear to bull. All wave counts should be considered while the situation remains unclear for Gold.
Click chart to enlarge.
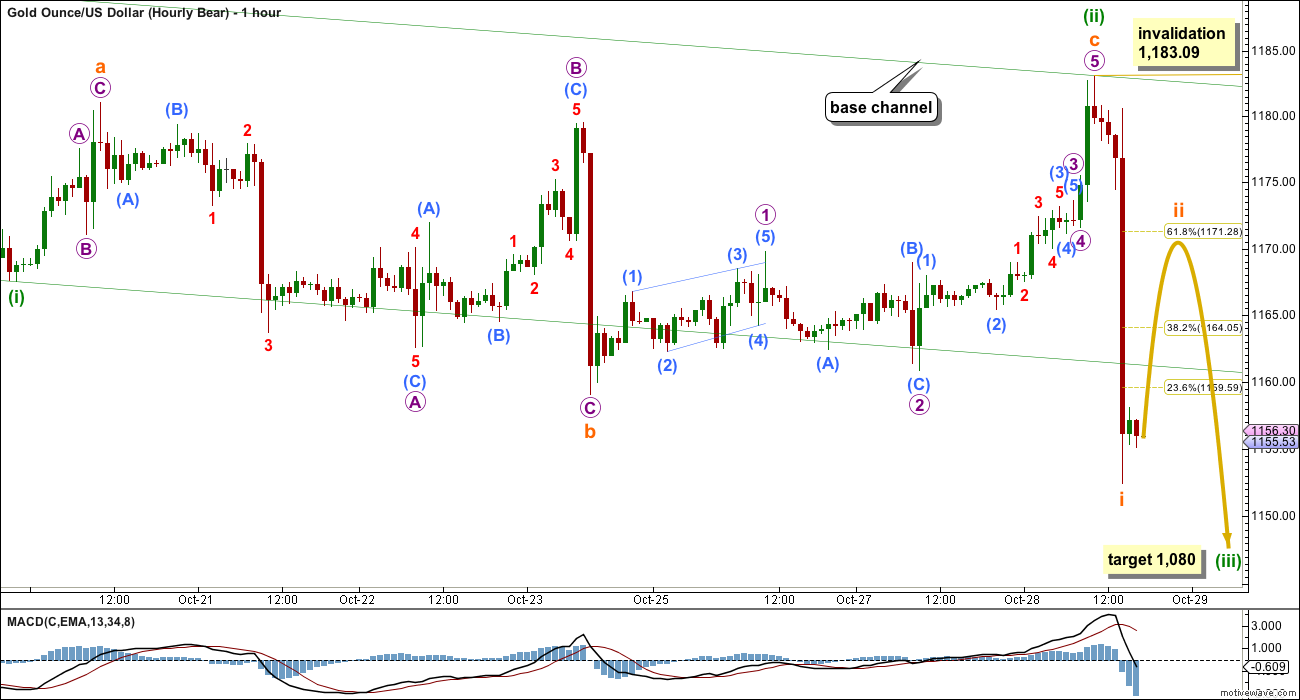
Downwards movement from the last swing high at 1,191.66 subdivides so far 5-3-5 for all wave counts.
For the bear, this may be minuette waves (i), (ii) and now subminuette wave i.
At 1,080 minuette wave (iii) would reach 4.236 the length of minuette wave (i). I am using that Fibonacci ratio because minuette wave (i) is so short.
The green channel is slightly different. It is a base channel about minuette waves (i) and (ii). Base channels often (not always) are useful to show where following corrections may find support or resistance. The lower edge of the base channel should be breached by a third wave. So far this has happened. In the first instance look for upwards movement to find some resistance at the lower edge of this base channel.
This bear wave count expects to see a strong increase in downwards momentum over the next few weeks.
TECHNICAL ANALYSIS
Click chart to enlarge. Chart courtesy of StockCharts.com.
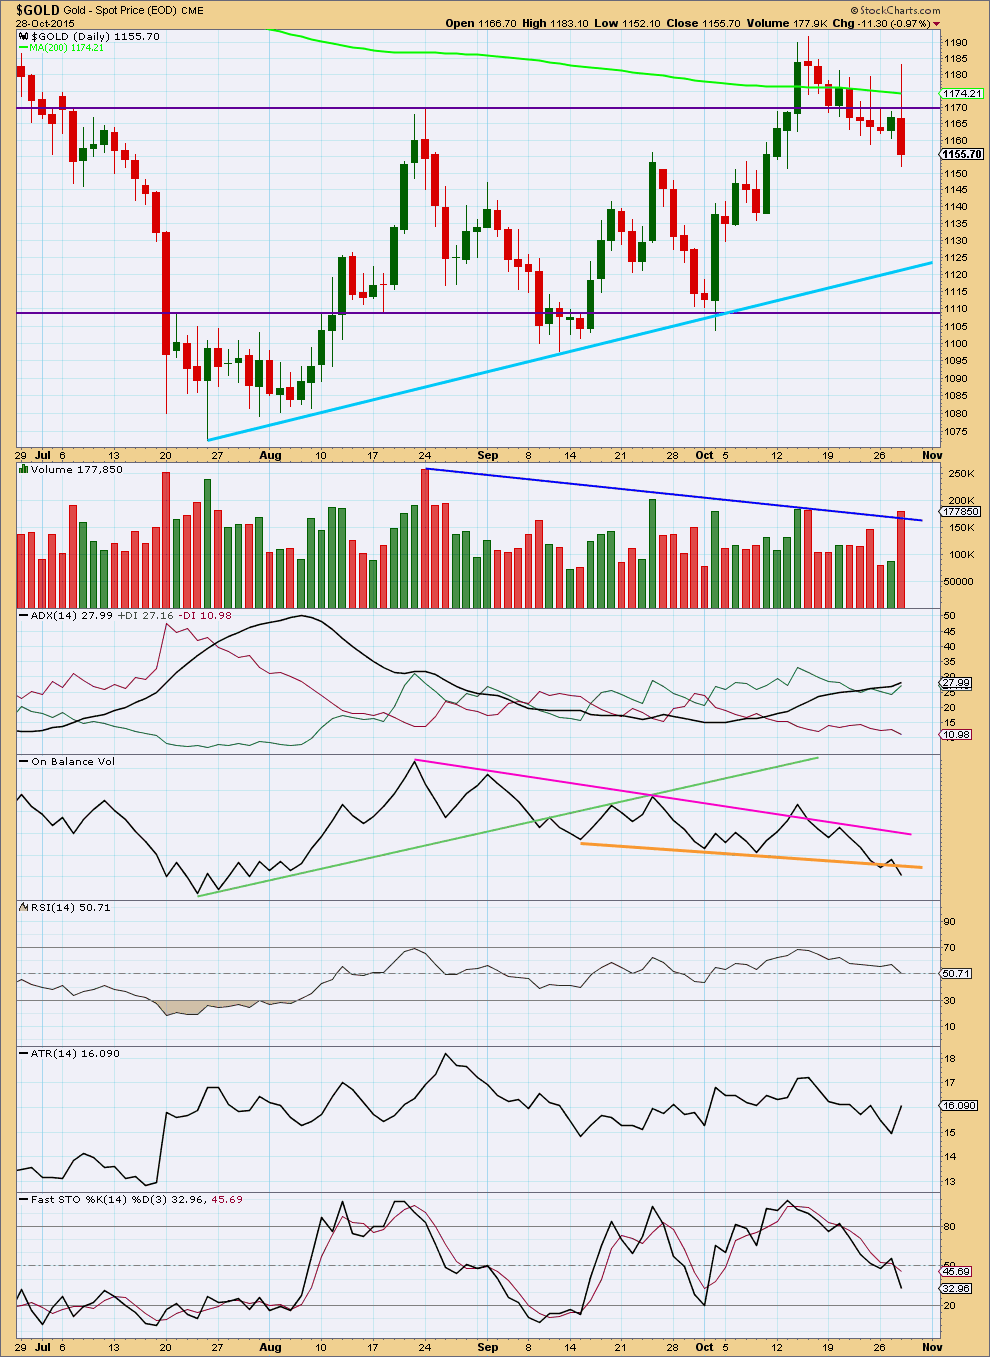
Daily: Today it looks increasingly like the breakout of 14th October was a false upwards breakout. Price has closed four days in a row back below the purple horizontal line of resistance.
Today’s strong downwards day comes with a sharp increase in volume (although this may change after 6:30pm EST when StockCharts data is finalised). This is bearish; the fall in price is well supported by volume.
ADX is a lagging indicator. ADX indicates an upwards trend is in place although price has now been moving overall lower for the last nine days. ATR overall still disagrees. This is an increase of only one day, not yet enough to determine a new trend is in place, although today’s range for price sharply increased. ATR overall is still declining which is more typical of price behaviour during a consolidation than a trend.
If price is still within a consolidation, then it may be expected that more downwards movement shall unfold until price finds support and Stochastics is oversold at the same time. Price may find support at either the upwards sloping light blue line or the horizontal purple line. Stochastics is not yet oversold. More downwards movement would be expected from this approach.
During this consolidation, which began back on 7th August, it is still a downwards day which has strongest volume. This indicates a downwards breakout is more likely than upwards.
On Balance Volume has breached the short held orange line. This is a weak bearish signal.
At this stage, the picture looks to be slightly more bearish than bullish, at least short term. That ADX still indicates an upwards trend is in place is concerning though, so this regular technical analysis comes with the caveat that the picture is mixed and we may yet have an upwards trend in place if ADX is to be believed in this instance.
This analysis is published about 06:55 p.m. EST.
Hey Dreamer…re:$US..
thanks for your post last night and @ 4:15AM….from RAMBUS..
I’ve been watching this chart for some time as well.
This seems to be the early indication of the next intermediate trend.
Have you been trading off RAMBUS’ signals?
If so, is he best for day trading, swing, or intermediate positions?
Thanks for your continuing substantive input…always appreciated.
Ted, you’re welcome. I’m actually not a Rambus member, although I probably should sign up as I do like his work. I read all of his public posts. They often come out on Wednesday or Sunday. I find his charts most useful to help with my swing to intermediate trades, but I believe that some of his alerts for members are very precise buy and sell ideas. I trade mostly the 3x miners and rely on Lara’s gold analysis to give me the daily to intermediate direction for gold. My research found that miners follow the daily direction of Gold over 92% of the time.
I believe Papudi is a Rambus member if you want more info.
Hope this helps.
The gold target at 1,132 is only $12 above confirmation of Bear daily and hourly and invalidation of bull daily and hourly. That is a close call for holding bullish overnight.
A long legged doji is formed on Oil daily chart…it may also show reversal..??
I’m seeing this wave down as a third wave.
The second wave reached only to the 0.382 Fibonacci ratio, not the 0.618.
At 1,132 this third wave would reach equality in length with the first.
I’m expecting red candlesticks until the target is reached. If this third wave reaches equality with the first then the target at 1,144 will not be low enough.
When the third and fourth waves are complete within this downwards move then I’ll recalculate the target.
Regarding the structure of what I have labelled minuette wave (i) down: on the five minute chart I can see it as either a three or a five, so Alan you are correct, it may not be the end of minuette wave (i). I am labelling it as a complete impulse though because it would have a typical curved look to it; I see an extended fifth wave in the middle of it for its third wave, and then quick shallow fourth waves before the end.
Buy Comex gold if it touches $1,143-45/ounce. published on October 29, 2015
http://www.thehindubusinessline.com/opinion/columns/gnanasekaar-t/buy-comex-gold-if-it-touches-114345ounce/article7819182.ece?utm_source=RSS_Feed&utm_medium=RSS&utm_campaign=RSS_Syndication
Lara also please give update on oil counts
How low gold could go????
Many countries that depend on oil sales for a large part of their revenue are hurting. Venezuela is selling it’s gold to pay debts. This could get much worse….
http://money.cnn.com/2015/10/29/news/economy/venezuela-selling-gold/index.html?iid=hp-stack-dom
$ASTROLOGY$
Yesterday we mentioned the fall is expected to continue till friday.BOOK PROFITS..
Disclaimer*
How high can crude go before joing bear trend..??
Shorts are looking at head and shoulders pattern so they are getting in now with stop loss at 46.50 with the idea that right shoulder is complete.
Gold is heading for 1,144 or lower area now in my opinion. As at 1,148.39
Shit crude came down…
Booked shorts in loss…
Hedggies taking the little guys money… Pump and dump.
First in the short term, a retracement up of Wednesday’s price shock may end more likely about .618 at 1,171.28 or less likely only .382 at 1,164.05.
It looks to me like gold headed for 1,164 instead of 1,171 and instead topped at 1,162.79 at 2:29 am.
Then gold started down towards 1,144 or lower target.
Any wave counts or comments?
Yesterday’s low of 1152.40 was NOT the end of minute c. I was puzzled that Lara said it was because I could only count 3 waves down from the 1183.04 high. So, gold spot price is looking for the bottom. It would still be in the vicinity of 1144 which incidentally completes Minor 4. Minor 5 / Int A should then target 1171 as the first target.
Yes, I think we now have a 5 down and may start a second wave correction up at any time.
Lara said the low of 1,152.40 was the end of minuette wave (i) and that
“At 1,144 minute wave C would reach 1.618 the length of minute wave a.”
After 1,152.40 she expected 1,171 or perhaps lower at .382 at 1,164 then down to finish minute wave C at 1,144 or lower and I think gold is moving towards that now.
Sorry, wrong labelling in my comment above. Instead of “minute c”, it should have been “minuette i”.
I could only count three waves down to “minuette i”, so it might be minuette iii instead. Which means mineuette v / minute c / minor 4 would end around 1144.
So minuette wave (ii) to 1,171 won’t happen as already hit 1,162.79 at 2:29 am to complete minuette wave (ii).
Now gold may have completed minuette wave (iii) at 1,148.39 at 11:03 am.
Still have mineuette v / minute c / minor 4 downwards movement should continue to at least 1,144. Normal range 1,130 – 1,116, invalidated below 1,120.32.
Wednesday at the 5 minute time frame I believe there were 5 waves down from high of 1,183.04 at 10:20 am down to low of 1,152.40 at 2:45 pm.
Here is a take on Gold’s EW count by a blogger Pedro:
—————————————————————————————————-
“Working off my system, but using EW to describe what I’m seeing.
Indices appear to have made a smaller wave 4 low in late Aug.
Now in 5th wave up (within wave III impulse from 2010-11).
Probably close to completing 3rd subwave within that 5.
Rate hike in Dec (after shopping is done) should start us on large IV.
Crude impulsed off the lows in Aug.
Spent Sept/Oct in sideways B. LIKELY now starting C up.
If so …. watch out energy shorts.
PMs delivered on the higher highs I’d been calling for.
But the swift retrace is leaving the larger pattern less than clear.
I have JDST on (provisional) IT buy, but not DUST …. no sells on metals …
Could be the post FOMC drop ended a complex corrective 4, and 5 up for GDX etc remains, from here.”
Lara does oil count got invalidated..it made high of 46.52
Lara: ADX is a lagging indicator. That is the black line is lagging. But the +D1 and -D1 lines are daily and real time day late. Is that correct???????
What happens if one sets the ADX parameter to 7 days instead of 14 standard days?????
What I mean by lagging is it takes 14 days of data into account. And so if a new trend begins it won’t show it for several days.
Look at the monster volume today. Highest in the last year. MACD cross. Looking bullish.
One of the important ratio in PM sector is Silver to Gold ratio.
Although on FED day gold dropped but silver did not drop but was volatile.
The ratio closed positive and above 9 dema. Daily chart ADX looks positive for coming out of consolidation above 20.
SGR that is bullish short term for PM.
Strange things happening in PM sector.
May be it is Rahu/Ketu???
Got an astrological update..
$ASTROLOGY$
Bullions will only show a clear trend between monday and wednesday next week…
Disclaimer*
bullish trend?
Thanks Lara for an update on oil market..
It scared bears yesterday…
It appears that the $USD is breaking upwards, but we still need a full day above the line to confirm.
Detailed Rambus currency post. Bullish $USD.
Wednesday Report…The Chartology of The Currency Wars …What If
http://rambus1.com/2015/10/28/wednesday-report-92/
Dreamer
His report is stunning!!!! Jaw dropping. What to come. USD to 121??? wow.
Gold will be in cycle wave a for some time.