
In the short term, a little upwards movement was expected to 1,164 or 1,171 (with the higher target at 1,171 favoured). Thereafter, more downwards movement was expected.
Upwards movement ended at 1,162.79 and was followed by downwards movement.
Summary: All wave counts expect more downwards movement. The middle of a third wave may end about 1,132. The following fourth wave correction may be brief and shallow and may not move above 1,152.43. If targets are wrong, they may not be low enough. The bear wave count is valid and may see explosive downwards movement, so look out for surprises to the downside.
To see weekly charts for bull and bear click here.
New updates to this analysis are in bold.
BULL ELLIOTT WAVE COUNT
DAILY – COMBINATION
Click chart to enlarge.
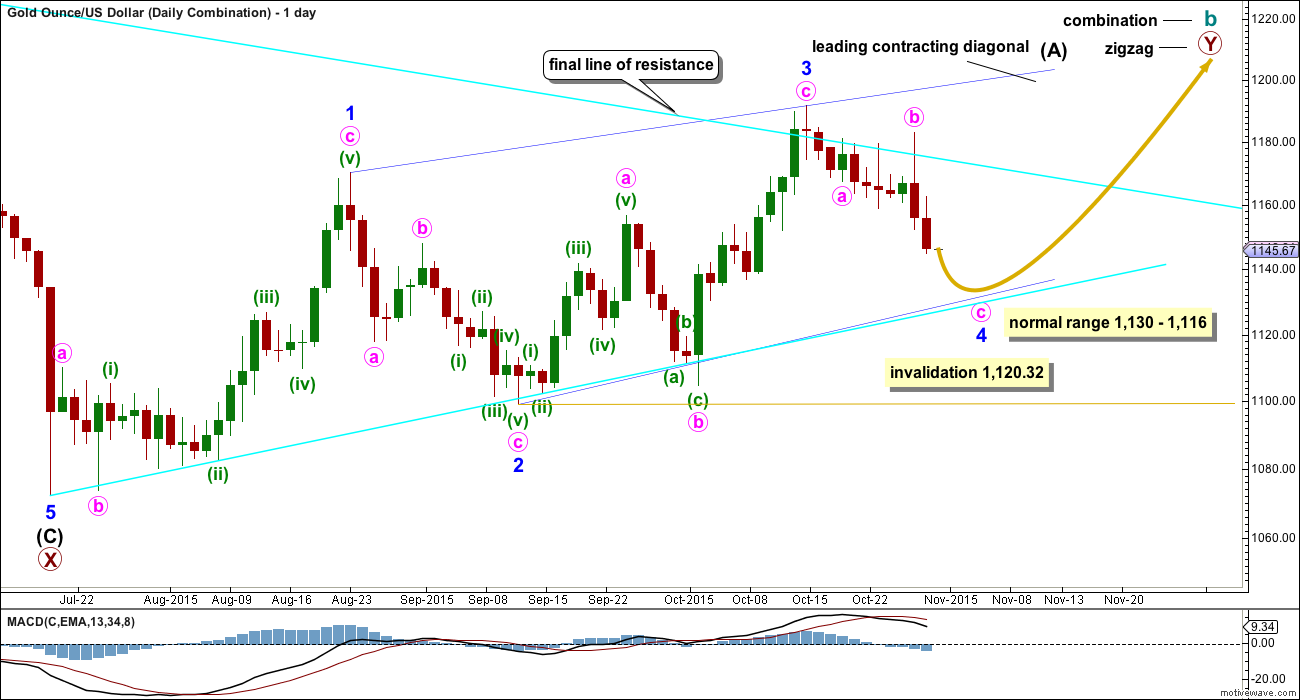
If cycle wave b is a combination, then the first structure in the double combination (or double flat) was an expanded flat. The double is joined by a three in the opposite direction labelled primary wave X which was a zigzag.
A five wave structure would be developing upwards for this wave count as a leading contracting diagonal. Because primary wave Y would be beginning with a five wave structure, this reduces the possible structures to a zigzag. Cycle wave b as a combination would be a flat – X – zigzag.
Minor wave 3 is a complete zigzag of a leading diagonal. Minor wave 3 is shorter than minor wave 1, so the diagonal would be contracting which is the most common type particularly for a leading diagonal. This limits minor wave 4 to no longer than equality in length with minor wave 2. Minor wave 4 may not move below 1,120.32.
The normal range for a fourth and second wave within a diagonal is between 0.66 to 0.81 the prior actionary wave. That gives a normal range for minor wave 4 from 1,130 to 1,116. Minor wave 4 must end at the upper edge of the normal range (or above) to remain above the invalidation point.
DAILY – EXPANDED FLAT
Click chart to enlarge.
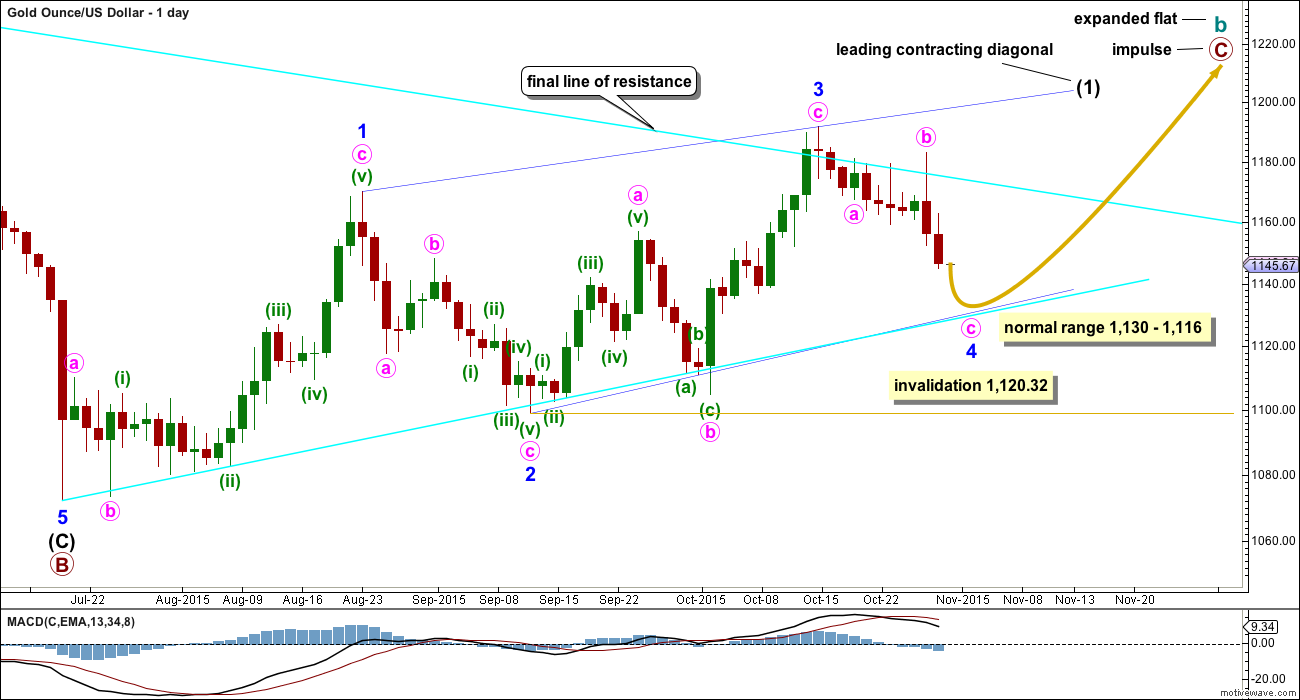
Cycle wave b may also be a flat.
If cycle wave b is an expanded flat, then primary wave C must be a five wave structure. The current upwards wave may be unfolding as a leading contracting diagonal, so this would be minor wave (1) within primary wave C.
There are two possible structures for a C wave within a flat correction: an impulse or an ending diagonal. If the first wave is a five and not a zigzag, then an ending diagonal may be ruled out because ending diagonals require all sub waves to be zigzags. Primary wave C may now only be an impulse.
A leading diagonal requires the second and fourth waves to subdivide as zigzags. The first, third and fifth waves are most commonly zigzags, but sometimes may appear to be impulses. So far minor waves 1 and 3 both fit well as zigzags.
Minor wave 2 is 0.73 the depth of minor wave 1, nicely within the normal range of between 0.66 to 0.81 for a second wave within a diagonal.
The hourly chart below works for both these first two daily charts.
HOURLY CHART
Click chart to enlarge.
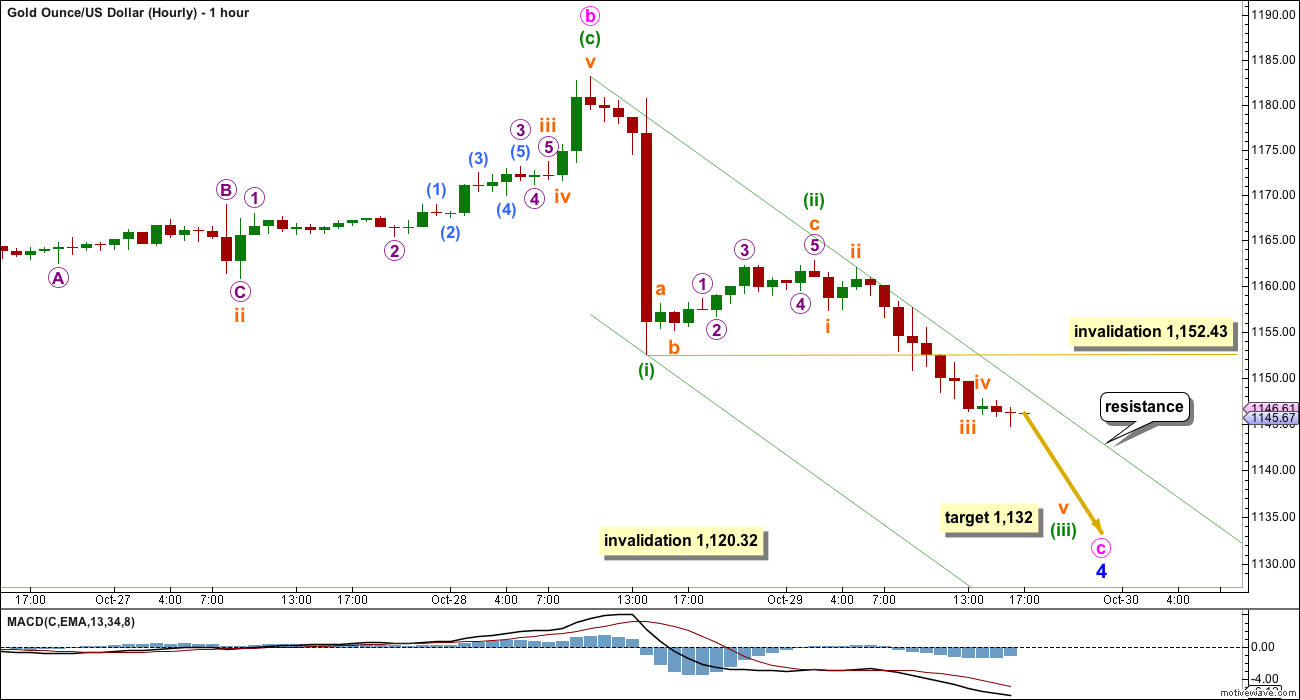
An impulse is unfolding downwards. Minute wave c must complete as a five wave structure.
Downwards movement is showing an increase in momentum and looks so far like a typical third wave. Minuette wave (i) will subdivide as a five wave impulse on the five minute chart. So far it looks like minuette wave (iii) is incomplete. At 1,132 minuette wave (iii) would reach equality in length with minuette wave (i). This is the ratio I am using for this target because minuette wave (ii) was shallow.
The green channel is a best fit. The upper edge may provide resistance along the way down. When minuette wave (iii) is complete upwards movement may breach the upper edge of the channel.
Minuette wave (iv) may not move into minuette wave (i) price territory above 1,152.43.
I will calculate a target for minute wave c to end at minuette degree when minuette waves (iii) and (iv) are complete.
DAILY – TRIANGLE
Click chart to enlarge.
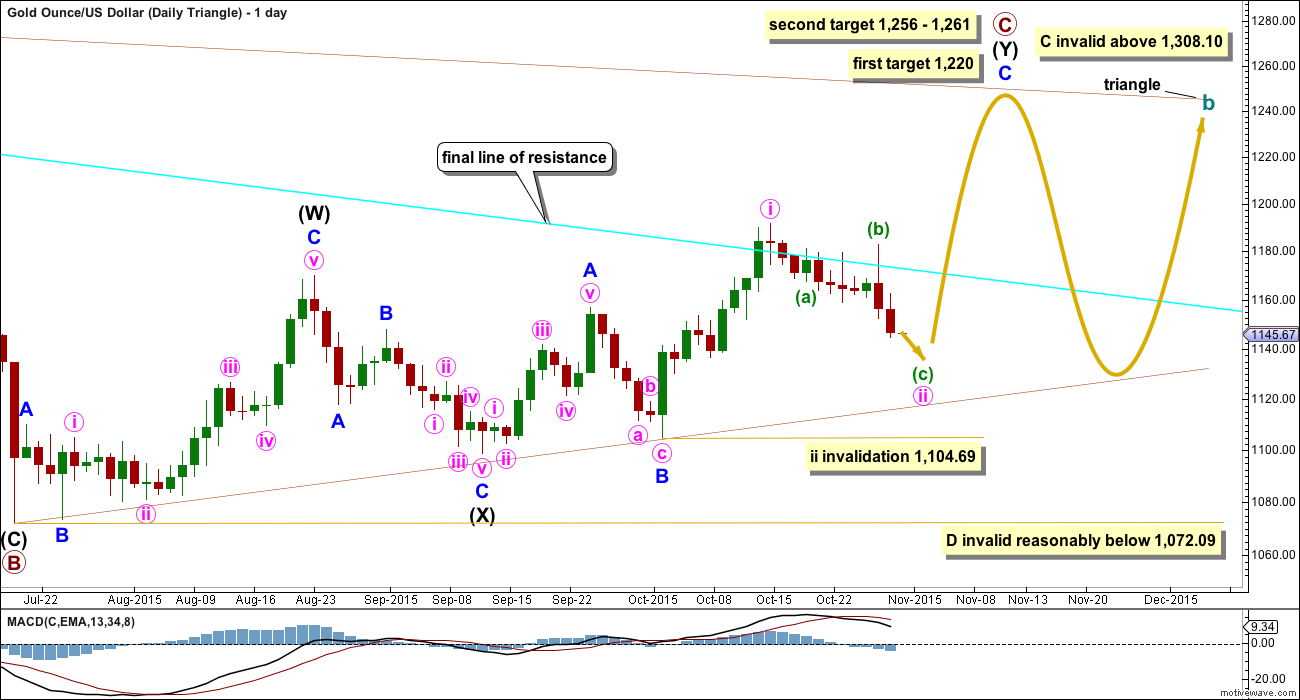
This daily chart looks at what a triangle would look like for cycle wave b. The triangle would be a running contracting or barrier triangle. Within the triangle, primary wave C up must be a single or multiple zigzag. Primary wave C may not move beyond the end of primary wave A above 1,308.10.
This idea slightly diverges from the other two ideas for cycle wave b as an expanded flat or combination.
If a triangle is unfolding, then at the weekly chart level primary wave C looks unlikely to be complete and should move higher for the triangle to have the right look. This wave count sees upwards movement as incomplete for minor wave C. At 1,220 primary wave C end close to 0.618 the length of primary wave B. One of the five sub waves of a triangle is commonly about 0.618 the length of its predecessor.
The second target at 1,256 is where minor wave C would reach 2.618 the length of minor wave A, and at 1,261 primary wave C would reach 0.8 the length of primary wave A.
For the triangle idea, for cycle wave b, a five wave impulsive structure only needs to complete upwards. The next wave down for primary wave D should be fairly time consuming, lasting about 2 to 6 months. Primary wave D may not move beyond the end of primary wave B at 1,072.09 for a contracting triangle. Alternatively, primary wave D may end about the same level as primary wave B at 1,072.09 for a barrier triangle, as long as the B-D trend line remains essentially flat. In practice this means primary wave D can end slightly below 1,072.09 and this wave count remains valid. This is the only Elliott wave rule which is not black and white.
HOURLY – TRIANGLE
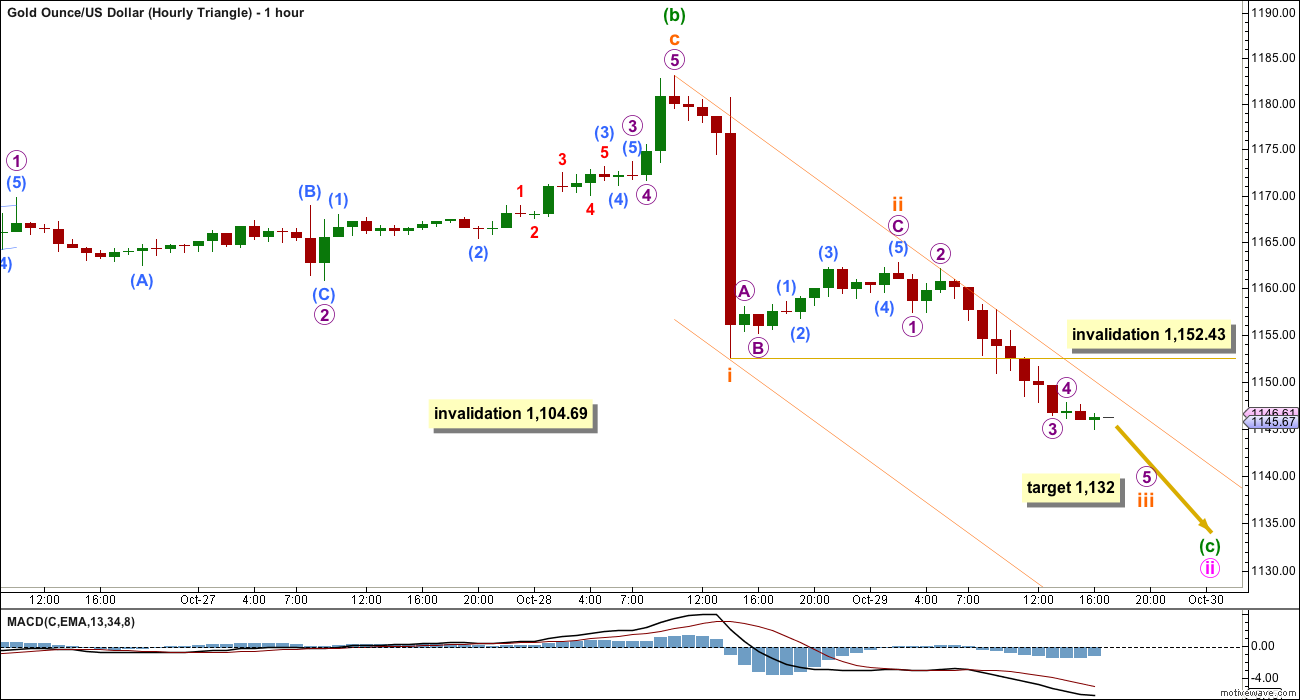
Click chart to enlarge.
A five wave impulse is unfolding downwards for all hourly wave counts today. The structure and subdivisions are seen in exactly the same way. More downwards movement is expected.
BEAR ELLIOTT WAVE COUNT
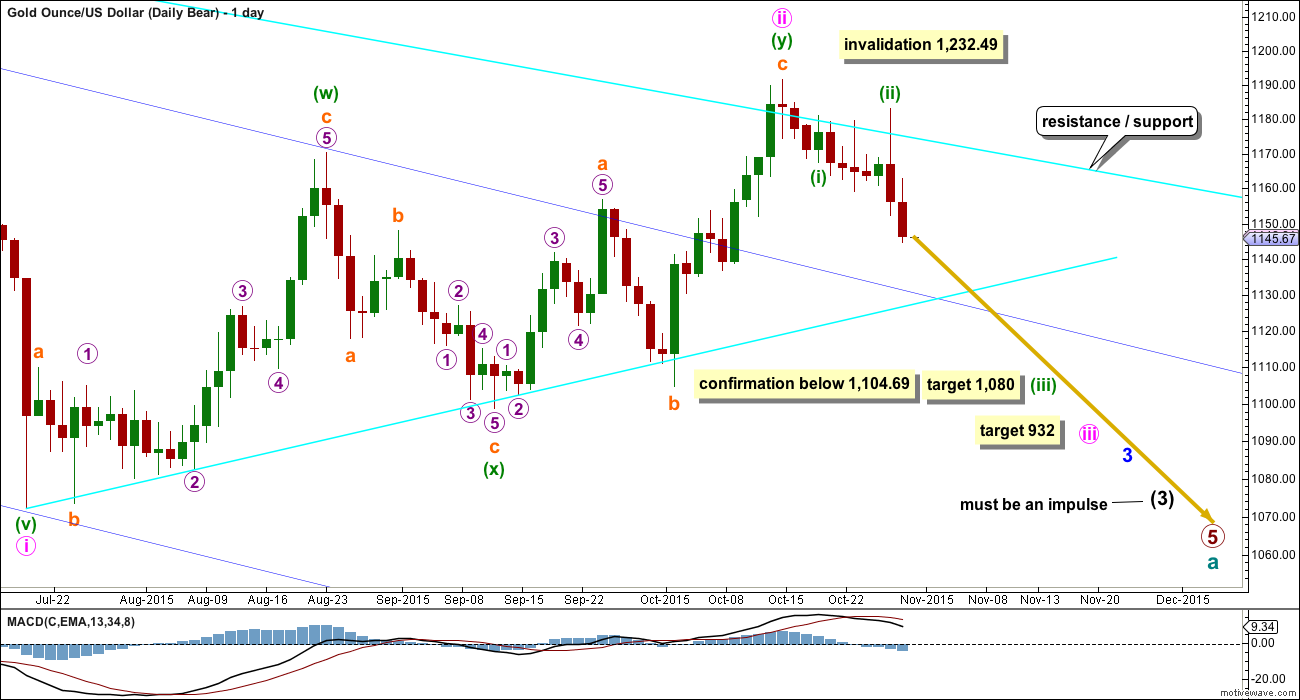
Click chart to enlarge.
The final line of resistance (bright aqua blue line copied over from weekly charts) is only overshot and not so far properly breached. While this line is not breached the bear wave count will remain possible. Simple is best, and the simplest method to confirm a trend change is a trend line. While price remains below this line, it must be accepted that Gold has been in a bear market since 2011 and we don’t have technical confirmation that the bear market has ended.
The most likely possibility is that minute wave ii is a complete double zigzag and deep at 0.75 the length of minute wave i for the bear wave count. It has breached the dark blue base channel drawn about minor waves 1 and 2, one degree higher. When a lower degree second wave correction does this it reduces the probability of the wave count but does not invalidate it. Base channels most often work to show where following corrections find support or resistance, but not always.
At 932 minute wave iii would reach 1.618 the length of minute wave i.
If minute wave ii were to continue further, it may not move beyond the start of minute wave i above 1,232.49. A new high above that price point would be final price invalidation of any bear wave count. That would fully eliminate the concept that Gold remains in a bear market. No bear wave count should be considered above that point.
Although the subdivisions at the hourly chart level are the same for all wave counts, I will provide a separate hourly chart for this bear wave count to avoid any confusion. At this stage, it does not mean I consider this wave count to have a higher probability because I do not, but I do wish to stress it is entirely technically possible and we do not have technical confirmation that Gold has changed from bear to bull. All wave counts should be considered while the situation remains unclear for Gold.
At this stage, for this bear wave count, Gold may be ready to move towards a strong middle of a third wave. Gold often exhibits swift strong fifth waves, particularly its fifth waves within its third waves. When price moves towards subminuette wave v of minuette wave (iii) it may be explosive. For this wave count look out for surprises to be to the downside.
At 1,080 minuette wave (iii) would reach 4.236 the length of minuette wave (i).
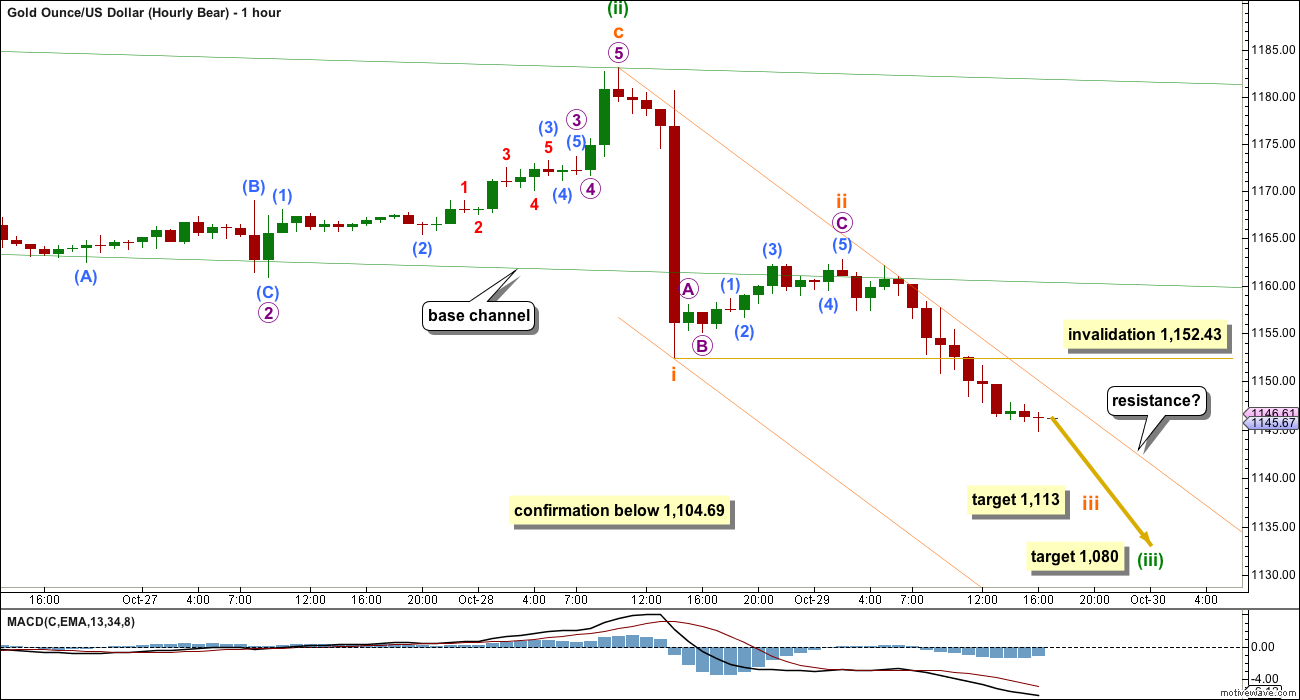
Click chart to enlarge.
The biggest difference here is targets are lower.
Because downwards movement is showing an increase in momentum it looks like a third wave. The only problem with this view is that price remains in the upper half of the best fit channel.
At 1,113 subminuette wave iii would reach 1.618 the length of subminuette wave i.
A new low below 1,120.32 would provide some confidence in the bear wave count because it would invalidate the combination and expanded flat ideas for the bull wave count. A new low below 1,104.69 would invalidate the triangle idea for the bull wave count leaving only this one bear wave count valid, so at that stage full confidence may be had that Gold remains within a bear market.
TECHNICAL ANALYSIS
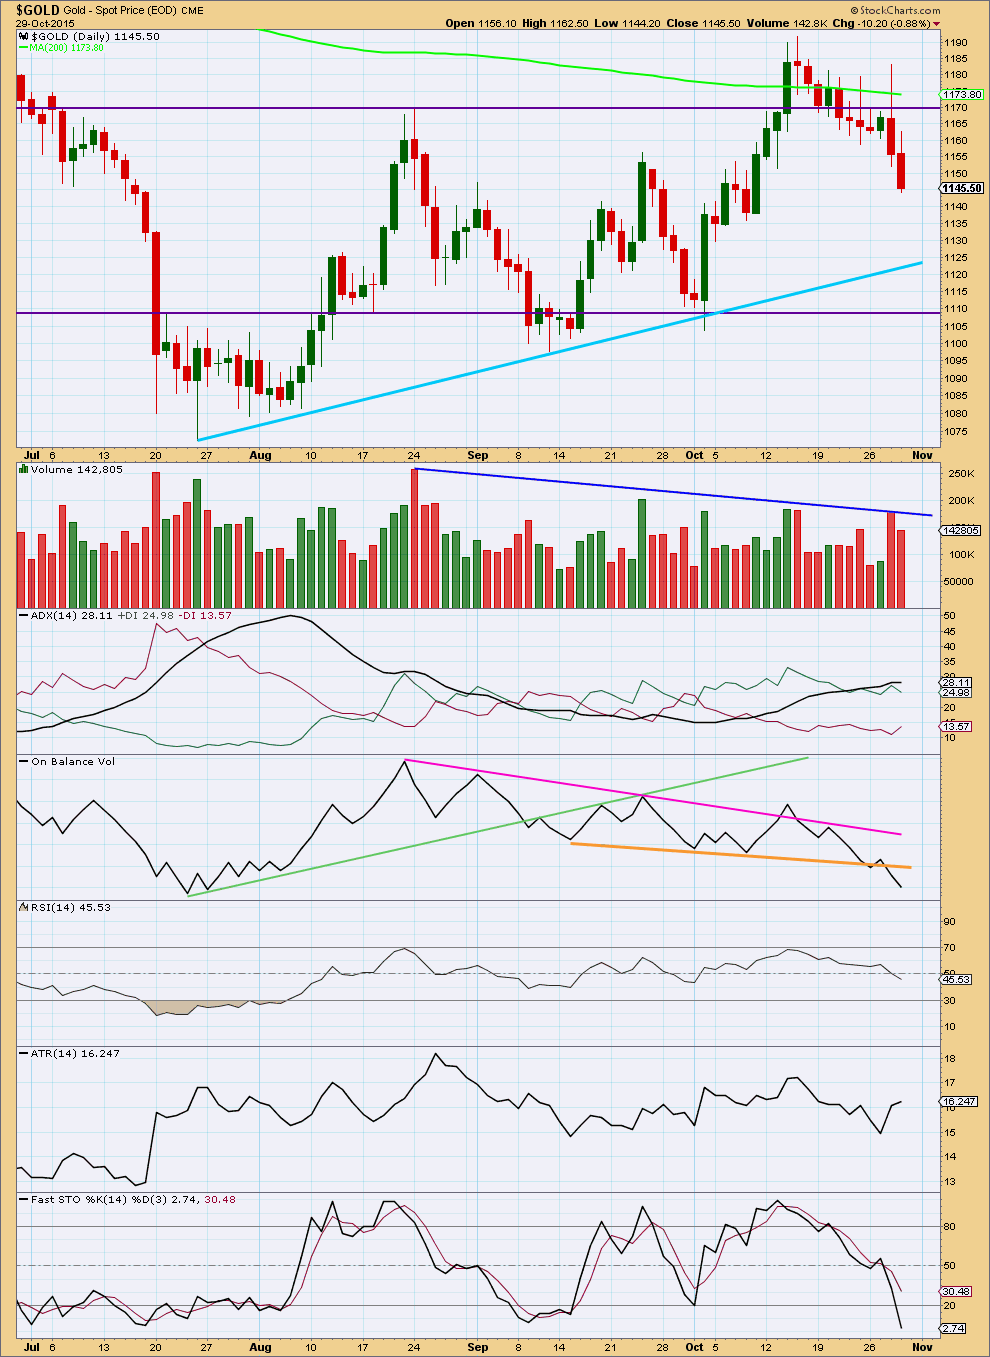
Click chart to enlarge. Chart courtesy of StockCharts.com.
Daily: Downwards movement comes on lighter volume. The fall in price is not supported by volume today.
ADX still indicates an upwards trend is in place, but price keeps moving lower. This illustrates the biggest problem with ADX, because it uses 14 days of data it is a lagging indicator. If the trend has changed from up to down (as trend lines indicate it has), then ADX will not catch up with the change for about two weeks, so I am supplementing this indicator with ATR.
ATR is showing two days in a row of increased range. This may be the beginning of a new trend.
RSI indicates there is room for the market to rise or fall; RSI is neither overbought or oversold.
Stochastics is beginning to move towards oversold.
If a downwards trend is not developing and if the market remains range bound (and a breakout has not yet happened while price remains above the lower trend lines of support), then more downwards movement would be expected until Stochastics is oversold and price reaches support at the same time.
On Balance Volume is bearish. The break below the short orange trend line is bearish, and the downwards trend of OBV while price made the last swing high is also bearish.
It still looks like the potential upwards breakout of 14th October was false. Price has returned to the consolidation zone. ADX may be lagging, a hangover from the last upwards swing within this consolidation which overshot resistance. It remains a downwards day which has strongest volume during this consolidation. This in conjunction with OBV indicates a downwards breakout is more likely than upwards.
This analysis is published about 06:27 p.m. EST.
Lara,
Any thoughts on the USD? I am curious if it has broken out of the triangle you were mentioning a few days ago. If the USD starts it’s next run up, this could be the oil/gold trigger to their next lows.
Wave D of the triangle may have ended two days ago.
It’s slightly above B so it may be a barrier triangle.
At this stage the triangle looks okay. I’ve tried to see if minor 4 could be something else…. a combination? but it just doesn’t fit.
And so I expect USD to move lower while Gold moves higher for a few days next week. That will complete the triangle on USD and the leading contracting diagonal on Gold.
My updated COT analysis.
My take is that this looks bearish, and tells me we will exceed the prior trough low in gold. Based on Lara’s analysis, maybe we get a wave ii up next week, which would be a great place to position a short with a stop above, I will be on the look out for that opportunity.
Lara, great timing with your 2 comments and charts. Thank you.
A bought a little GDX at the low at the close.
I know there is no confirmation yet that wave down has ended, however I think it is more probable considering how much gold dropped the last 3 days.
And the risk / reward ratio could be pretty good.
You may lose, but shouldn’t lose too much
And the bear hourly chart here….
Most interesting, when a channel is drawn about this impulse down using Elliott’s first technique (1 to 3, copy on 2) it absolutely perfectly shows where 5 ended. Just perfect.
Hopefully that channel will be useful to indicate a trend change.
It must be accepted that while there has been no channel breach we most certainly could see more downward movement (from bull and bear).
These hourly charts come with the strong caveat that the end of this impulse is unconfirmed, the channel must be breached by upwards movement before confidence may be had that downwards movement is over for now.
All experts adviced to sell crude in morning…but crude rallied…hattsss offf Lara..
Yay. Happy I’ve got that right.
Will have a new alternate idea though for US Oil; it may be a leading diagonal. That has to be considered. But I would expect it to have a lower probability.
If we’ve got a drop in the US dollar for a few days, that could be the correction gold and oil are looking for, maybe into the labor report on Friday.
I’ll be looking for your S&P update tonight also. I read today that from the low of 669.79 on 3/6/2009 multiplied by Pi comes to to 2094.32. We peaked today at 2094.78.
old is bullish right now 1 minute to 195 minute at 1:19 pm.
Not sure how soon that will change.
Gold have have hit the low for today at 11:59 am at 1140.10
That may have been a 5 wave down and now in retrace before deeper wave down.
Any wave counts?
I think that may be it for the downturn for Gold now Richard.
I can see a clear five wave structure downwards. It may be minute wave c, or for the bear subminuette i.
There is some divergence with MACD and price on the hourly chart at this last low.
I’ll use a channel about this impulse; when it’s breached by upwards movement then it’s probably over and the next wave up is probably underway.
A new high above 1,183.09 would now invalidate the bear at the hourly chart level. That would provide confirmation for the bull.
The bull is limited to no higher than 1,232 if this is indeed a leading contracting diagonal. The fifth wave may not be longer than the third. It’s most likely to be a zigzag.
Chart attached for the hourly bull wave counts; flat and combination. The triangle will be a little different, and the bear will be different. The bear would now expect a second wave correction to move higher, it can’t move above 1,183.09.
Low 1,139.38 at 11:59 am
$ASTROLOGY$
We made handsome gains in this bear move.
Now build some positions gradually in gold and crude till monday.Period between 4th nov and 11th nov will b skyrocketing for both..
Disclaimer*
Be careful with gold bull 3X ETF over the weekend if you are considering it.
1146.54 is my retrace of night high 1150.18 at 3:43 am down to low of 1140.66 at 8:54 am.
Any wave counts or comments?
Methinks it is only the first of five waves down.
Yes I would expect gold to drop much lower such at Lara target 1,132 or lower.
However would it still retrace up to 1146.54 or does than .618 retrace rule not apply here?
Ted
RAMUS is not a day trader. Buys and sell are on intermediate time frame.
You get the benefit of forum as well where many members posts charts and articles of investments and trade interest.
Below is a link of free forum for traders in general market as well as PM sectors.
http://goldtadise.com/
For EW analysis this (EWG site) is the only best one and there are not much in the public arena.
Good trading.
Thanks Papudi and Dreamer…will check out the TENT..
Dreamer….your GDX and DUST targets are lining up nicely with the gaps.
I’ve heard it said that TA is a probability game…
everything works some of the time…
So the idea is that the more eyeballs you get…
looking at a particular price point…
using all of their different methods and strategies and tactics…
the greater the probability of a price EVENT…
So EW counts + trendline support + gaps to be filled + FIBs + MFI divergence + Volume At Price …..= many eyeballs at DUST 17.50
I’m raising a tighter DUST stop loss above 17.50…this thing whips it good…
GDX short term target
DUST short term target