
More downwards movement was expected for all wave counts.
Targets were inadequate, but price did move lower and remained below the invalidation point which was close by.
Summary: All wave counts will now expect upwards movement for some or all of next week. A new high above 1,183.09 would favour the bull wave counts over the bear. The bear needs a new low below 1,104.69 for confirmation.
To see weekly charts for bull and bear click here.
New updates to this analysis are in bold.
BULL ELLIOTT WAVE COUNT
DAILY – COMBINATION
Click chart to enlarge.
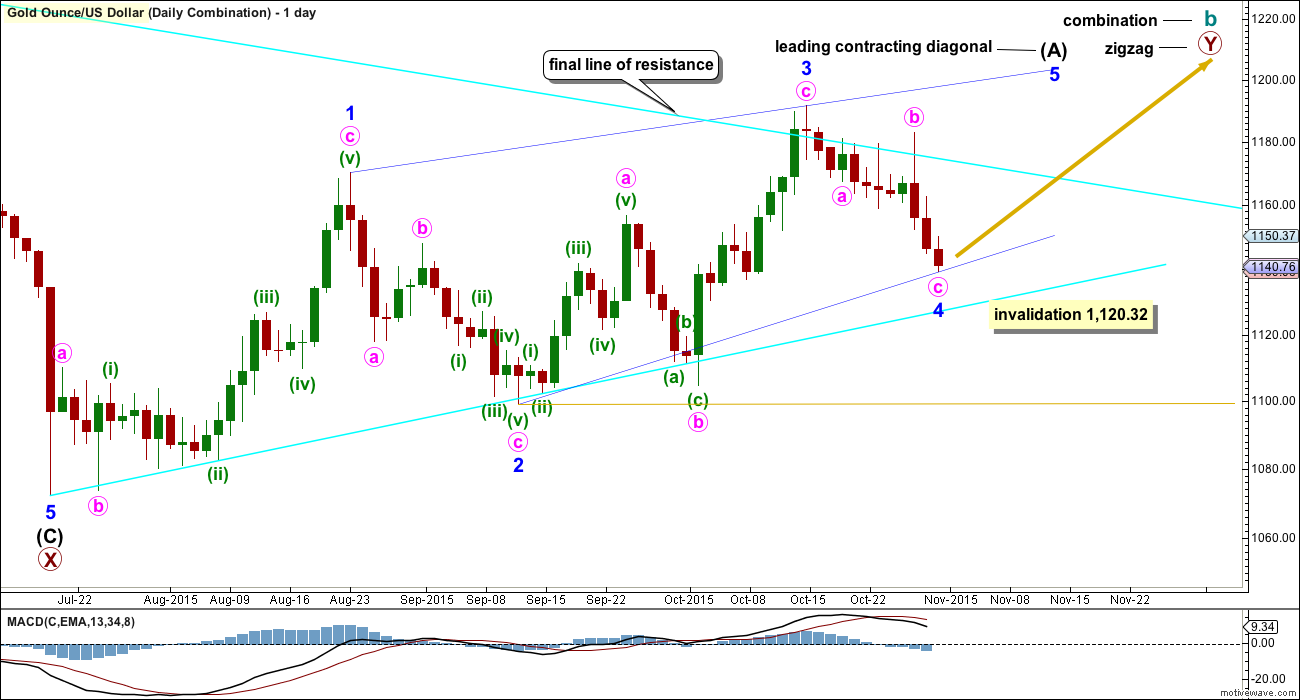
If cycle wave b is a combination, then the first structure in the double combination (or double flat) was an expanded flat. The double is joined by a three in the opposite direction labelled primary wave X which was a zigzag.
A five wave structure would be developing upwards for this wave count as a leading contracting diagonal. Because primary wave Y would be beginning with a five wave structure, this reduces the possible structures to a zigzag. Cycle wave b as a combination would be a flat – X – zigzag.
Minor wave 3 is a complete zigzag of a leading diagonal. Minor wave 3 is shorter than minor wave 1, so the diagonal would be contracting which is the most common type particularly for a leading diagonal. This limits minor wave 4 to no longer than equality in length with minor wave 2. Minor wave 4 may not move below 1,120.32.
The normal range for a fourth and second wave within a diagonal is between 0.66 to 0.81 the prior actionary wave. That gives a normal range for minor wave 4 from 1,130 to 1,116. Minor wave 4 must end at the upper edge of the normal range (or above) to remain above the invalidation point.
If my hourly chart analysis is wrong and price moves lower to begin next week, look for price to find support at the lower bright aqua blue trend line.
DAILY – EXPANDED FLAT
Click chart to enlarge.
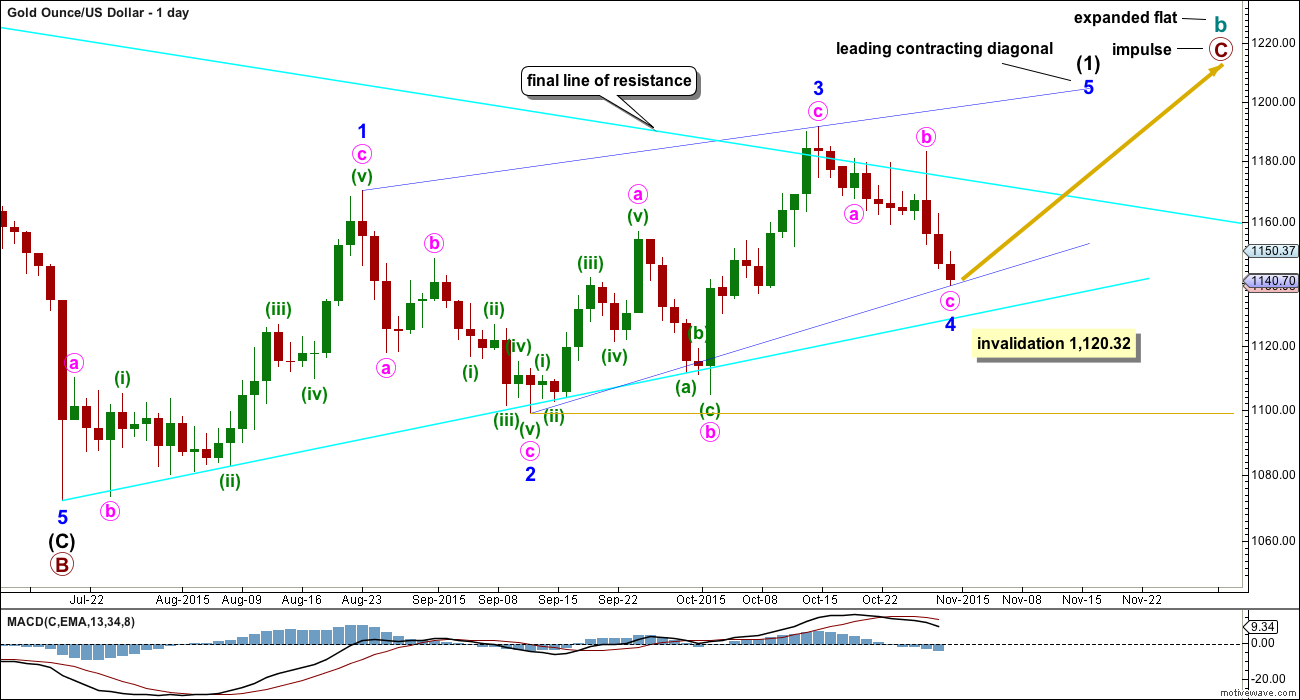
Cycle wave b may also be a flat.
If cycle wave b is an expanded flat, then primary wave C must be a five wave structure. The current upwards wave may be unfolding as a leading contracting diagonal, so this would be minor wave (1) within primary wave C.
There are two possible structures for a C wave within a flat correction: an impulse or an ending diagonal. If the first wave is a five and not a zigzag, then an ending diagonal may be ruled out because ending diagonals require all sub waves to be zigzags. Primary wave C may now only be an impulse.
A leading diagonal requires the second and fourth waves to subdivide as zigzags. The first, third and fifth waves are most commonly zigzags, but sometimes may appear to be impulses. So far minor waves 1 and 3 both fit well as zigzags.
Minor wave 2 is 0.73 the depth of minor wave 1, nicely within the normal range of between 0.66 to 0.81 for a second wave within a diagonal.
Minor wave 4 is now a complete zigzag structure. It is 0.56 the depth of minor wave 3, so it is more shallow than the normal depth, but it is still deep enough for the diagonal to have the right look. The trend lines converge.
The hourly chart below works for both these first two daily charts.
HOURLY CHART
Click chart to enlarge.
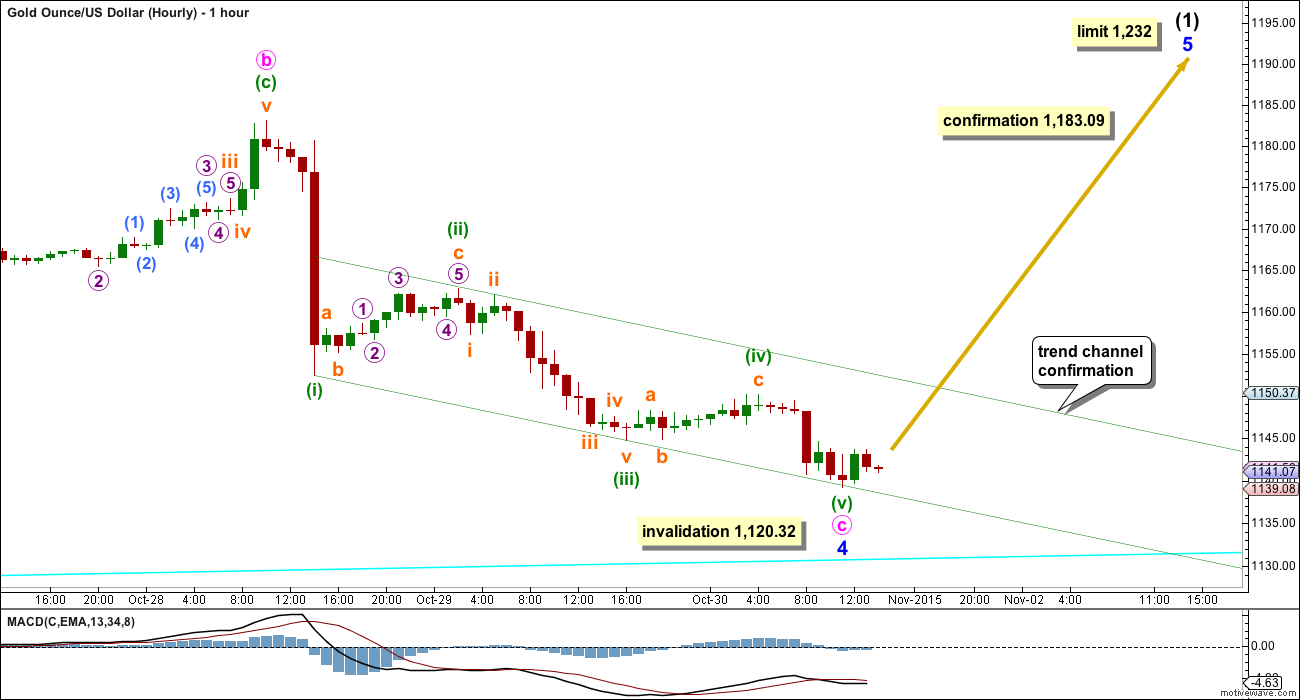
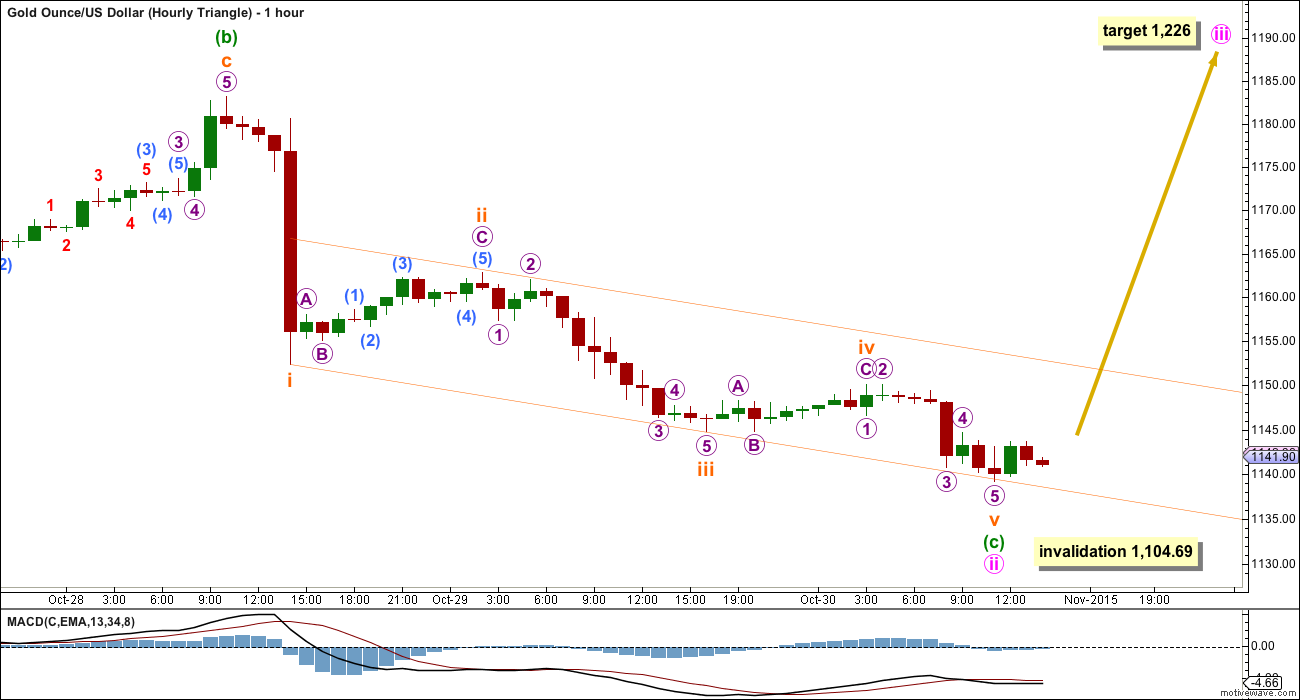
The target calculated for minuette wave (iii) at 1,132 was too low; minuette wave (iii) was shorter than minuette wave (i).
Ratios within minute wave c are: subminuette wave iii is 0.92 shorter than 0.618 the length of subminuette wave i, and subminuette wave v is 0.20 shorter than 0.618 the length of subminuette wave iii.
There is some alternation between minuette waves (ii) and (iv) within minute wave c: minuette wave (ii) was a shallow 0.34 zigzag and minuette wave (iv) was a shallow 0.30 regular flat.
Draw a channel about minute wave c using Elliott’s first technique: draw the first trend line from the ends of minuette waves (i) to (iii), then place a parallel copy on the end of minuette wave (ii). This perfectly shows where minuette wave (v) may have ended at the lower edge. When this channel is breached by upwards movement, then it shall provide trend channel confirmation that minute wave c is likely to be over and the next wave up is likely to be underway.
There is some divergence between price and MACD at the end of Friday on the hourly chart: while price made a new low MACD did not. This supports the idea of a trend change either here or soon.
This analysis comes with the strong caveat that a trend change is unconfirmed while price remains within (or below) the channel.
A new high above 1,183.09 would invalidate the bear wave count at the hourly chart level and provide some confidence in this bull wave count.
The final fifth wave of minor wave 5 may not be longer than equality in length with minor wave 3 because the diagonal is contracting. This gives a limit for the next wave up at 1,232.
Minor wave 5 would most likely subdivide as a zigzag. It must move above the end of minor wave 3 at 1,191.66 because the fifth wave of a leading diagonal may not be truncated.
Actionary waves of diagonals do not usually exhibit Fibonacci ratios to each other. The best way to calculate the final target for minor wave 5 would be to use the ratios of minute waves a and c within the zigzag. This cannot be done until minute waves a and b are complete and the start of minute wave c is known. For now the target for minor wave 5 will be a range: it must move above 1,191.66 but not above 1,232.
DAILY – TRIANGLE
Click chart to enlarge.
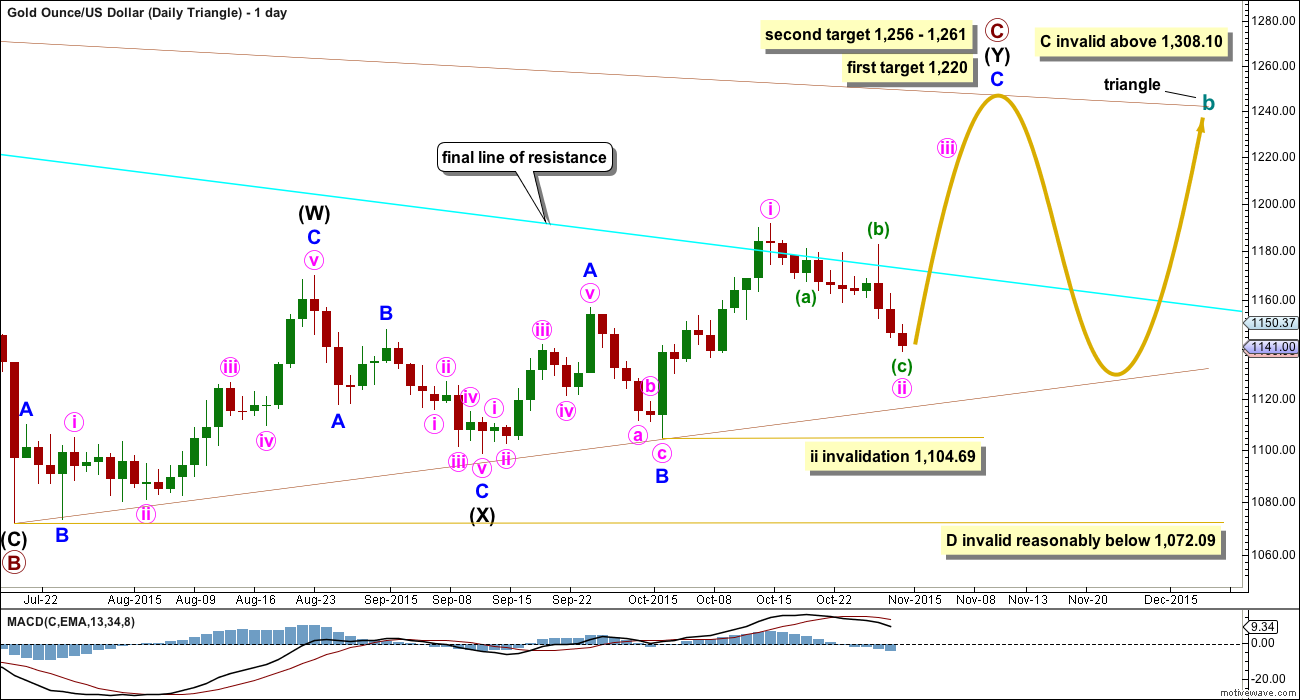
This daily chart looks at what a triangle would look like for cycle wave b. The triangle would be a running contracting or barrier triangle. Within the triangle, primary wave C up must be a single or multiple zigzag. Primary wave C may not move beyond the end of primary wave A above 1,308.10.
Primary wave C may also be a single zigzag with a leading contracting diagonal unfolding for intermediate wave (A). That idea would look exactly the same as the daily combination chart. If a leading contracting diagonal completes in the next week or two, then that is how this triangle idea would be labelled also. For now I will consider the double zigzag idea to consider all possibilities.
This idea slightly diverges from the other two ideas for cycle wave b as an expanded flat or combination.
If a triangle is unfolding, then at the weekly chart level primary wave C looks unlikely to be complete and should move higher for the triangle to have the right look. This wave count sees upwards movement as incomplete for minor wave C. At 1,220 primary wave C end close to 0.618 the length of primary wave B. One of the five sub waves of a triangle is commonly about 0.618 the length of its predecessor.
The second target at 1,256 is where minor wave C would reach 2.618 the length of minor wave A, and at 1,261 primary wave C would reach 0.8 the length of primary wave A.
For the triangle idea, for cycle wave b, a five wave impulsive structure only needs to complete upwards. The next wave down for primary wave D should be fairly time consuming, lasting about 2 to 6 months. Primary wave D may not move beyond the end of primary wave B at 1,072.09 for a contracting triangle. Alternatively, primary wave D may end about the same level as primary wave B at 1,072.09 for a barrier triangle, as long as the B-D trend line remains essentially flat. In practice this means primary wave D can end slightly below 1,072.09 and this wave count remains valid. This is the only Elliott wave rule which is not black and white.
HOURLY – TRIANGLE
Click chart to enlarge.
Minute wave ii may be over. The subdivisions within this zigzag are still exactly the same as the first hourly wave count. The degree of labelling is one lower.
At 1,226 minute wave iii would reach equality in length with minute wave i.
As for the first hourly wave count, this idea too also requires a breach of the channel before any confidence may be had that downwards movement is over for now.
If the next wave up is a third wave and not a fifth wave of a leading diagonal, then it should show an increase in upwards momentum and it must subdivide as an impulse.
The structure of the next wave up, momentum, and how high it goes may indicate which wave count is correct.
BEAR ELLIOTT WAVE COUNT
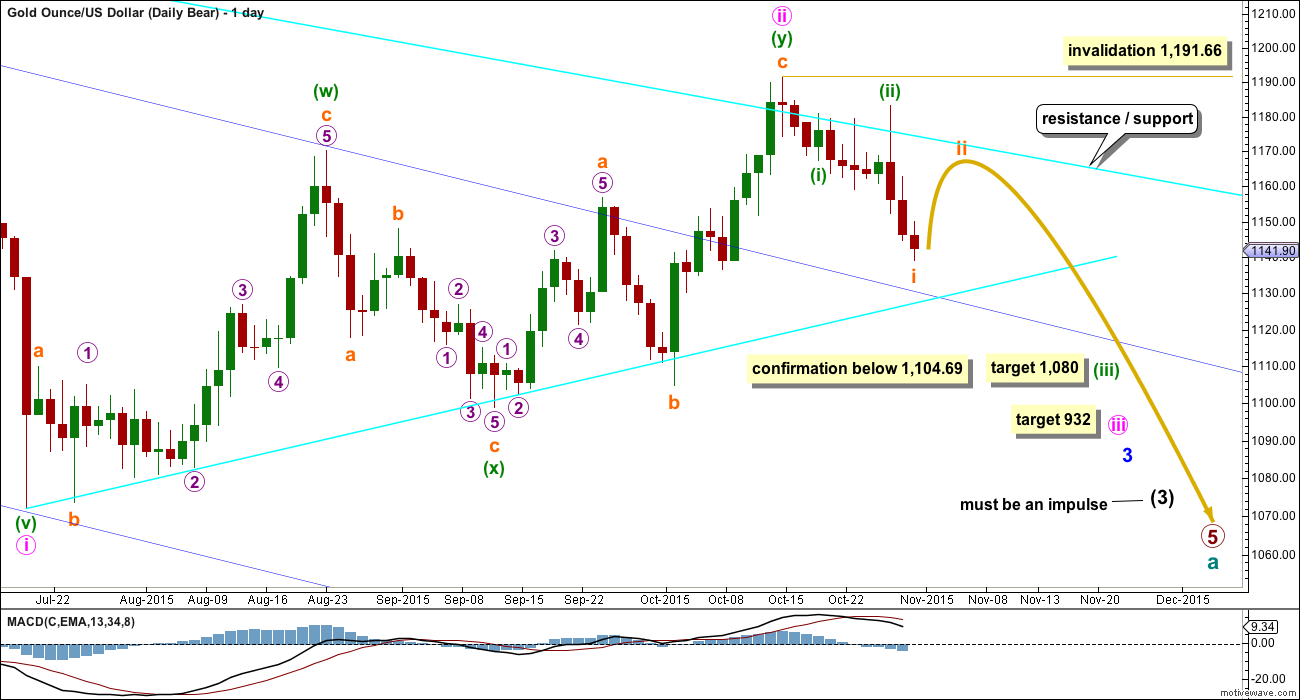
Click chart to enlarge.
The final line of resistance (bright aqua blue line copied over from weekly charts) is only overshot and not so far properly breached. While this line is not breached the bear wave count will remain possible. Simple is best, and the simplest method to confirm a trend change is a trend line. While price remains below this line, it must be accepted that Gold has been in a bear market since 2011 and we don’t have technical confirmation that the bear market has ended.
The most likely possibility is that minute wave ii is a complete double zigzag and deep at 0.75 the length of minute wave i for the bear wave count. It has breached the dark blue base channel drawn about minor waves 1 and 2, one degree higher. When a lower degree second wave correction does this it reduces the probability of the wave count but does not invalidate it. Base channels most often work to show where following corrections find support or resistance, but not always.
At 932 minute wave iii would reach 1.618 the length of minute wave i.
This week I will move the invalidation point down for the bear wave count. A new high above 1,191.66 would necessarily come with a clear breach of the bear market trend line, and so at that stage a bear wave count should be discarded. Within minute wave iii, no second wave correction may move beyond its start above 1,191.66.
Although the subdivisions at the hourly chart level are the same for all wave counts, I will provide a separate hourly chart for this bear wave count to avoid any confusion. At this stage, it does not mean I consider this wave count to have a higher probability because I do not, but I do wish to stress it is entirely technically possible and we do not have technical confirmation that Gold has changed from bear to bull. All wave counts should be considered while the situation remains unclear for Gold.
Gold often exhibits swift strong fifth waves, particularly its fifth waves within its third waves. When price moves towards subminuette wave v of minuette wave (iii) it may be explosive. For this wave count look out for surprises to be to the downside.
At 1,080 minuette wave (iii) would reach 4.236 the length of minuette wave (i).
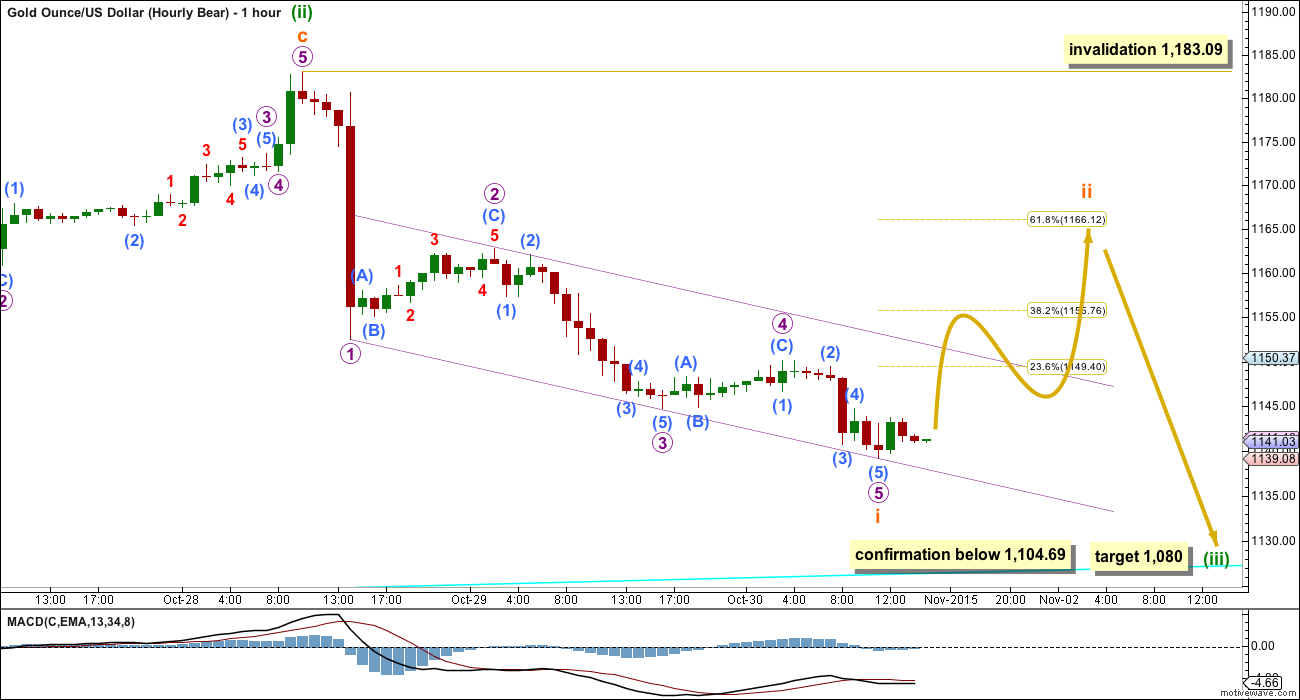
Click chart to enlarge.
The bear wave count also expects to see some upwards movement to begin the new trading week.
Subminuette wave ii may end about either the 0.382 or 0.618 Fibonacci ratios, with the 0.618 Fibonacci ratio slightly favoured. Subminuette wave ii should be choppy and overlapping and may include a new low below its start at 1,139.19, if it unfolds as an expanded flat or combination.
Subminuette wave ii may not move beyond the start of submineutte wave i above 1,183.09.
Subminuette wave ii may take one to three days to unfold.
TECHNICAL ANALYSIS
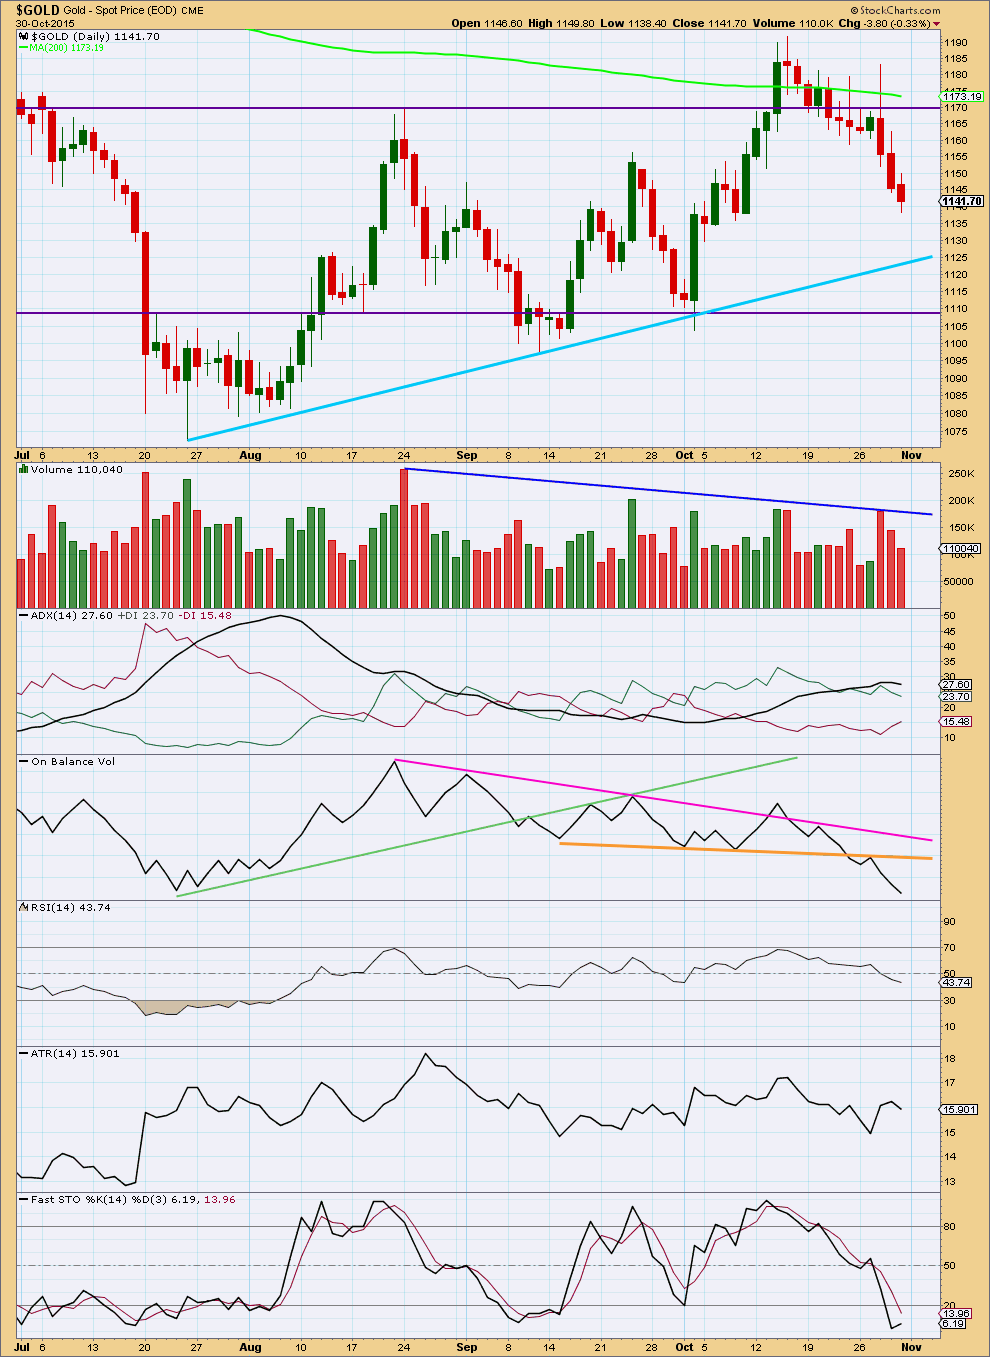
Click chart to enlarge. Chart courtesy of StockCharts.com.
Daily: Downwards movement for three days in a row comes on clearly declining volume. The fall in price is suspicious and is not supported by volume.
Today ADX no longer indicates an upwards trend is in place, the black ADX line is pointing downwards. This may be indication of a correction within a trend.
ATR no longer is clear and is also pointing lower.
The range price travelled in for Friday was smaller; volume was lower and momentum declined. This all indicates weakness for this downwards movement. This supports the Elliott wave counts which expect some upwards movement from here.
On Balance Volume is bearish. The break below the short orange trend line is bearish, and the downwards trend of OBV while price made the last swing high is also bearish.
The potential upwards breakout of 14th October still looks false. Price has returned to within the consolidation zone. A range bound trading system may expect price to keep moving lower from here until it finds support. That approach conflicts with the Elliott wave counts today, and conflicts with volume and momentum analysis. But range bound price movements rarely move in straight lines; price tends to whipsaw about a mean and moves in choppy overlapping waves. Some upwards movement could certainly unfold about here and a range bound system needs to encompass that.
This analysis is published about 09:25 p.m. EST.
Gold may have just bottomed near term at 1,132.70 at 4:27 pm, which was the new low of the day and above 1,132.12 limit.
Lara – “I think it needs one final fifth wave down… the fifth wave is limited to no longer than equality with the third. That limit is at 1,132.12.”
I bought some GDX at the the closing low $15.03.
This is a response to Matt’s comment from 12:54 pm. Matt has considerable experience, and since I am long I need to consider his bearish call carefully.
Regarding Matt’s statement that price on the weekly chart since the July low looks corrective, I’d say that is a reasonable view of that pattern. However, diagonals tend to have a corrective look also and so the leading diagonal in the bull case is also plausible.
From an EW point of view, Matt’s 3-wave corrective structure since the July low would need to be 5-3-5 or 3-3-5 to support his bear case. On the daily chart, that third wave looks like a 3 to me and that lends support to the case for a leading diagonal.
Regarding the COT, I agree it is developing an ominous bearish tone. The thing about a bearish (or bullish) COT is that it does not need to get resolved immediately. If we get wave 5 of the leading diagonal running up to 1200-1230 over the next few weeks, the COT will likely get even more bearish. After the leading diagonal completes, EW would expect a significant decline, perhaps 10% or more, in the price of gold. That decline could allow the COT to shift back to bullish.
I am taking this a day at a time, watching the behavior of the miners very carefully. At the moment, the miners do not appear to me to be eager to go down.
And one more thing….the $ASTROLOGY$ guy is on a roll and I don’t dare be on the wrong side of that.
With more downwards movement minute c clearly isn’t over and is continuing lower.
If the labelling of minuette (iii) remains where I have it on the first hourly chart above then there is a limit to this downwards movement for minuette (v). Because minuette (iii) was shorter than (i), and a third wave may never be the shortest, so the fifth wave is limited to no longer than equality with the third. That limit is at 1,132.12.
I will keep the labelling of minuette (iii) and (v) the same because it agrees with MACD; the strongest part of downwards movement is the third wave.
MACD now strongly diverges with price. The downwards trend is weak. It is highly likely to end very soon.
Looking at the subdivisions within minuette (v) I am not yet able to see it as compete. I think it needs one final fifth wave down.
The channel on the hourly chart will be drawn the same way. It needs to be breached before confidence may be had that this downwards move is over.
Gold price had a soft landing on the lower Bollinger band at 1133-32 and currently struggling to rise past 1136-37…. It will be interesting to see if Gold price can rise through and above 100dma/50dma range 1139-41 with 1142-43 seen as limiting… Gold price would need to begin coasting above 1139 to give itself a chance for a shot at 1146-47 with 20weekMA at 1154 seen as curtailing with 20dma at 1160 above there…. Lets see how this pans out, I would probably look to set up a Sell short above 1142-43….
GDX is bullish on 1, 3, 5, 15, 39, 78 and 195 minute time frames now at 1:36 pm.
Another astro update..lets c this wrks or not..
$ASTROLOGY$
As mentioned in the last updaye on friday.
This was time to build positions…now anytime upside rally from tommorow..
With the current drop to 1133.03 (and counting), it is quite clear on a 1-day chart that the rise from the low of 1072.01 on July 15 takes on the form of a leading diagonal. The current drop is the fourth wave which means that when it is over, the fifth wave will bring price beyond 1191.64, the high of the third wave.
The larger implication is that THE BEAR COUNT WILL THEN BE INVALIDATED.
Alan thanks for your analysis.
That is a long term diagonal.
Do you have any idea where and when the current bottom might end the 4th of the third wave and where and when might be the 1191.64 the top of 5th of the third wave?
I do have a little GDX now and willing to switch to DUST or NUGT at any moment if need be.
Hi Richard. From the channels drawn for the LD, the current wave should not move lower than 1120. (At 0.8 retrace, the price would reach 1117.38).
I was just about to say your 4th wave correction is very big for a diagonal. To me it doesn’t have the right look for an ending d when pulled back on a larger scale.
Alan I think you meant above 1,191.66 Lara’s invalidation point of the daily bear.
Lara does mention. “If a leading contracting diagonal completes in the next week or two, then that is how this triangle idea would be labelled also.”
I took the data from pmbull. They both mean the same point.
I respectfully disagree with you and would highly recommend adding to shorts on any bounce.
Looking at gold on a weekly chart should clearly show that the move up from the July low was a 3 wave structure and corrective.
COTs confirm that this was a bull rally in a bear market.
The invalidation points are not too far away, so we should have our answer this month.
Matt, what do you anticipate for bounce target?
Considering that gold just made another new low in the last few minutes, I am not so sure that a bounce is coming now.
My personal stance is not to play this on the long side at all – too dangerous! – and just keep my powder dry to add to my short position should gold get back into the 1150s. Gold could make it to the low 1160s, but the chances are diminishing the lower gold goes. I don’t think we’ll see the 1170s again for a long, long time.
Thanks Matt.
Gold 1,133.03 at 10:25 am may have been the bottom as looked like a pulse finished a 5th wave down. If gold goes lower than 1133.03 than I am wrong.
Any wave counts or comments?
When the green hourly channel at about 1,150 is breached by upwards movement, then it shall provide trend channel confirmation that minute wave c down is likely to be over and the next wave up is likely to be underway.
If my hourly chart analysis is wrong and price moves lower to begin next week, look for price to find support at the lower bright aqua blue trend line.
( My guess is at about 1,132.)
“History suggests the current bear market could last another nine to ten months”
http://thedailygold.com/bearish-reversal-in-precious-metals-at-resistance-again/
Dreamer
In reality gold has been in bear market from 1980 till 1999. In between there were Bear market Rallies (BMR).
From 2000 to 2011 was gold’s bull market.
I am impressed with Lara’s gold’s historic Elliott Wave count.
That should put any gold bug on watch. Gold is not going to 2000/3000/5000/or 10000 any soon.
Some people have written book titled Gold $10000.
Good point. Chart shows duration of first Cycle wave down.
US Dollar weakens after China manufacturing disappoints – Nov 2, 2015 1:10 a.m. ET
http://www.marketwatch.com/story/dollar-weakens-after-china-manufacturing-disappoints-2015-11-02?mod=MW_story_latest_news
This is bullish for Gold.
Gold parabola.
After 4th turn gold shall turn down soon with momentum. Just like in the last 4th turning point gold dropped and rally for few days and then went down sharply.
Next week few days gold may go higher per EW counts and then beware it is may turn down. COT for gold and silver are very bearish.
Bob Hoye from Institutional Advisory service : On PM Sector calling that bottom is in.
——————————————————————————————
“This would show up as the GDX began to out perform the bullion price. Our September 29th Pivot noted that GDX/GLD index rising above the 50-Day would be constructive. 130 and the rally has continued to 150. GDX has rallied from the base at 13 established from early August to the last low at 13.19 at the end of September. At 17 now , gold stocks have accomplished a big momentum swing.
A correction for the sector has been earned.
The base that is building will likely be the end of the bear that started in 2011. It is setting up a cyclical bull market whereby the precious metals become a premier sector.”
http://www.321gold.com/editorials/hoye/hoye102115.pdf
Gr8
Gold COT. Commercial shorts increased slightly after the prior weeks large increase. I agree with MTLSD that with Commercial shorts so high, it seems like there should be more down for gold, although there could be some up first as Lara’s bear count shows.
Silver COT. Commercial shorts are at the high point of the last year.
This reminds me of Wily E. Coyote! I’m going to stop referring to this as a bull or bear and start calling it a Bugs Bunny Market.
Lara, I know that (a) wave is distorted, but since this is broker generated data and not coming from an exchange, I weigh the probability toward the data being distorted and the wave pattern closer to telling the truth. That (e) wave is positively orgasmic. Morning after isn’t so pretty though.
The green dashed vector arrow is equal in magnitude percentage wise to wave (2) and on the same bearing. Notice how wave (w) tracks it. The bull trap I was referring to 2 weeks ago is the first peak after wave (3), the (b) in wave (w)’s zig zag.
Have you ever seen an expanding triangle in an (x) wave before?
I think I have once seen an expanding triangle for an X wave, and they certainly can be expanding triangles.
But expanding triangles are the single most rare Elliott wave structure. So if you’re going to label any movement an expanding triangle it absolutely must fit. All of it.
Your truncated end for the a wave means it is extremely, excessively unlikely that there is an expanding triangle in there.
Most likely there is another explanation that avoids truncations and rare structures. If you can find such a solution then go with it.
Lara, how does it look on your data using FXCM? Can you force it to fit?
Using GLD interday (yahoogle feed) I have it as an expanding flat and stooq daily a perfect “right look” expanding triangle with no issues.
I partially agree with you about simplest is best, but only in a bull market. For bear markets I always start with the most complex count I can find and then only simplify it enough to get something that makes sense.