
Upwards movement was expected by the bull Elliott wave count overall, but the pathway there was not what was expected.
Price still has not invalidated or confirmed either Elliott wave count.
Summary: It looks most likely we shall see some downwards movement from here. Price is finding resistance and this upwards move was not supported at all by volume. Momentum shows divergence. The bear wave count expects a third wave down to 1,067. The bull may allow for continued upwards movement, or it may continue lower for a correction to 1,123.
Changes to last analysis are bold.
To see the bigger picture on weekly charts click here.
BEAR ELLIOTT WAVE COUNT
Click chart to enlarge.
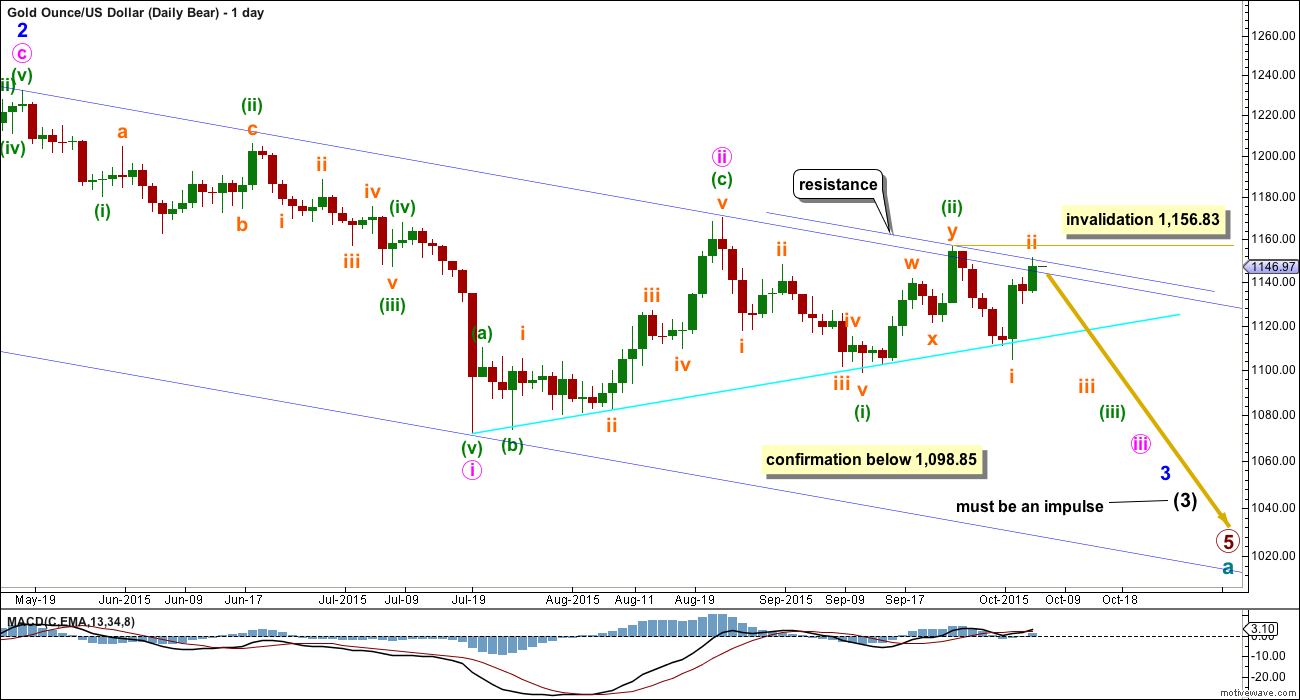
Gold has been in a bear market since September 2011. There has not yet been confirmation of a change from bear to bull, and so at this stage any bull wave count would be trying to pick a low which is not advised. Price remains below the 200 day moving average and below the blue trend line (copied over from the weekly chart). The bear market should be expected to be intact until we have technical confirmation of a big trend change.
This wave count now sees a series of five overlapping first and second waves: intermediate waves (1) and (2), minor waves 1 and 2, minute waves i and ii, minuette waves (i) and (ii), and now subminuette waves i and ii. Minute wave iii should show a strong increase in downwards momentum beyond that seen for minute wave i. If price moves higher, then it should find very strong resistance at the blue trend line. If that line is breached, then a bear wave count should be discarded.
The blue channel is drawn in the same way on both wave counts. The upper edge will be critical. Here the blue channel is a base channel drawn about minor waves 1 and 2. A lower degree second wave correction should not breach a base channel drawn about a first and second wave one or more degrees higher. If this blue line is breached by one full daily candlestick above it and not touching it, then this wave count will substantially reduce in probability.
If subminuette wave ii continues any higher then it may not move beyond the start of subminuette wave i above 1,156.83.
Downwards movement from 1,170.19 will subdivide as a complete five wave impulse on the hourly chart, but on the daily chart it does not have a clear five wave look. Subminuette wave iii has disproportionate second and fourth waves within it giving this movement a three wave look on the daily chart.
Minuette wave (ii) will subdivide as a double zigzag, but it has a five wave look on the daily chart, not a three. Both the wave down labelled minuette wave (i) and the wave up labelled minuette wave (ii) have a better fit and look for the bull wave count than the bear at the daily chart level.
Gold has the most textbook looking structures and waves of all the markets I have analysed over the years, probably due to the high volume of this global market. And so I am quite concerned with the look of minuette waves (i) and (ii). Sometimes Gold has movements which don’t look perfect on the daily chart, but this is uncommon.
Sometimes Gold’s impulse waves start out slowly. There is a good example on this daily chart for minute wave i. When the fifth wave approaches that is when momentum sharply increases, and it often ends on a price shock with a volume spike. This is an even more common tendency for Gold’s third wave impulses. The strongest downwards movement is ahead, and it should be expected to arrive when subminuette wave v within minuette wave (iii) begins.
This bear wave count expects Gold is within a third wave at five wave degrees. Expect any surprises to be to the downside for this wave count.
Within minuette wave (iii), subminuette wave ii now shows up very clearly on the daily chart. This was expected, and will give minuette wave (iii) the right look. Minuette wave (iii) may only subdivide as an impulse.
Full and final confirmation of this wave count would come now with a new low below 1,098.85.
I will remove the final target for primary wave 5 at this stage. If it were to reach only equality with primary wave 1 , then this wave count would end about 985. But it has begun with three big overlapping first and second waves, so the target no longer looks low enough. I will calculate a target for primary wave 5 to end at intermediate degree when intermediate waves (3) and (4) are complete. Primary wave 5 may not exhibit a Fibonacci ratio at primary degree.
Click chart to enlarge.
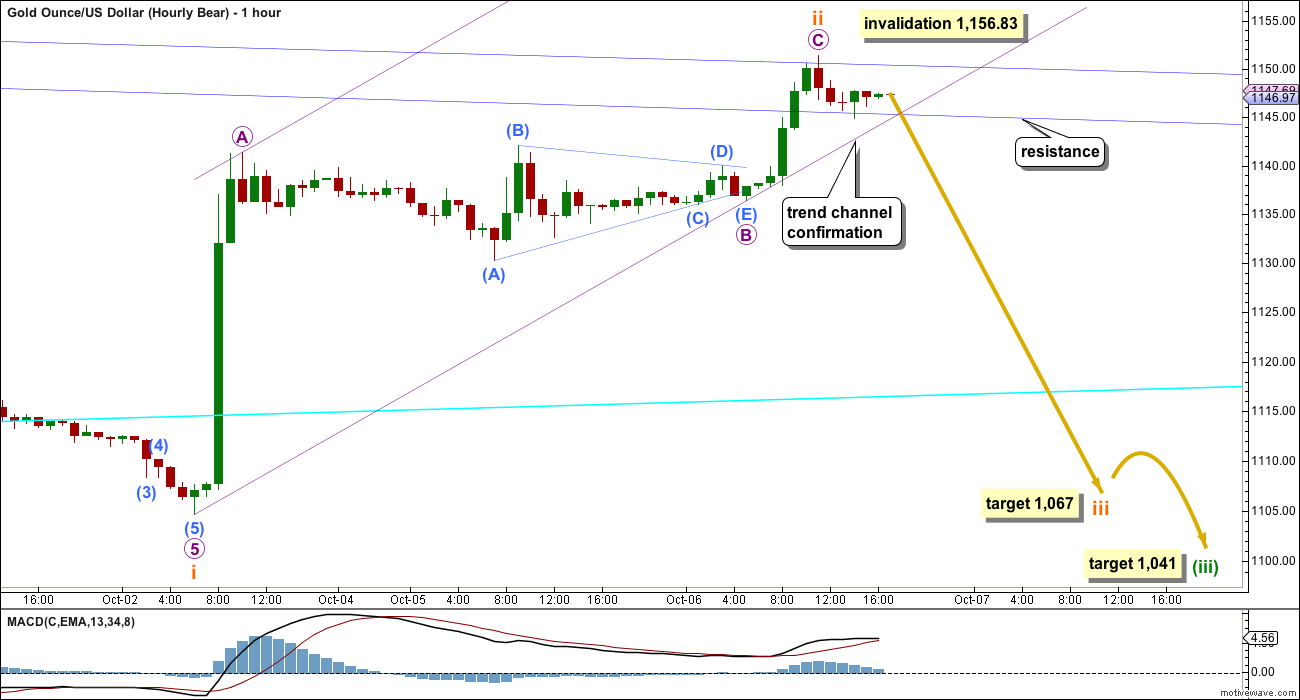
Subminuette wave ii moved higher as a single zigzag and not as a double zigzag which was mentioned in last analysis. Micro wave B within it continued sideways as a triangle. This upwards movement so far still has a strong three wave look to it on both hourly and daily charts.
I have created a parallel copy of the upper edge of the blue channel and placed it on the high of minuette wave (ii) (seen on the daily chart). This is again where price is finding resistance, with an overshoot of the first blue trend line (overshot on the daily chart). If price continues upwards from here, then the channel will be breached clearly at the daily chart level and this wave count should then be discarded. I will discard this wave count if price breaks above 1,156.83 AND breaches the channel at the same time. If that happens on increased volume, then this bear wave count would clearly be wrong.
Subminuette wave ii may yet continue higher as a double zigzag. This has an exceptionally low probability, but it is possible. For this reason I leave the invalidation point at 1,156.83. Subminuette wave ii may not move beyond the start of subminuette wave i.
At today’s high there is now clear bearish divergence between price and MACD. I would expect downwards movement from here with price again at the upper blue trend lines.
This wave count now expects a big third wave to begin downwards. At 1,067 subminuette wave iii would reach 1.618 the length of subminuette wave i. If this target is wrong, it will be not low enough. When there is some structure within subminuette wave iii to analyse the target may change and may probably be lower.
The upwards sloping maroon channel is drawn using Elliott’s technique for a correction about this zigzag of subminuette wave ii. When the lower edge is clearly breached by downwards (not sideways) movement that may provide some confirmation that the correction is over and the next wave down should be underway.
The next interruption to the downwards trend for this bear wave count would come when subminuette wave iii is over and subminuette wave iv arrives.
During subminuette wave iii, the fifth wave for micro wave 5 may exhibit particularly swift strong downwards momentum, maybe a price shock to the downside.
At 1,041 minuette wave (iii) would reach 1.618 the length of minuette wave (i). This target would be still at least two weeks away.
BULL ELLIOTT WAVE COUNT
Click chart to enlarge.
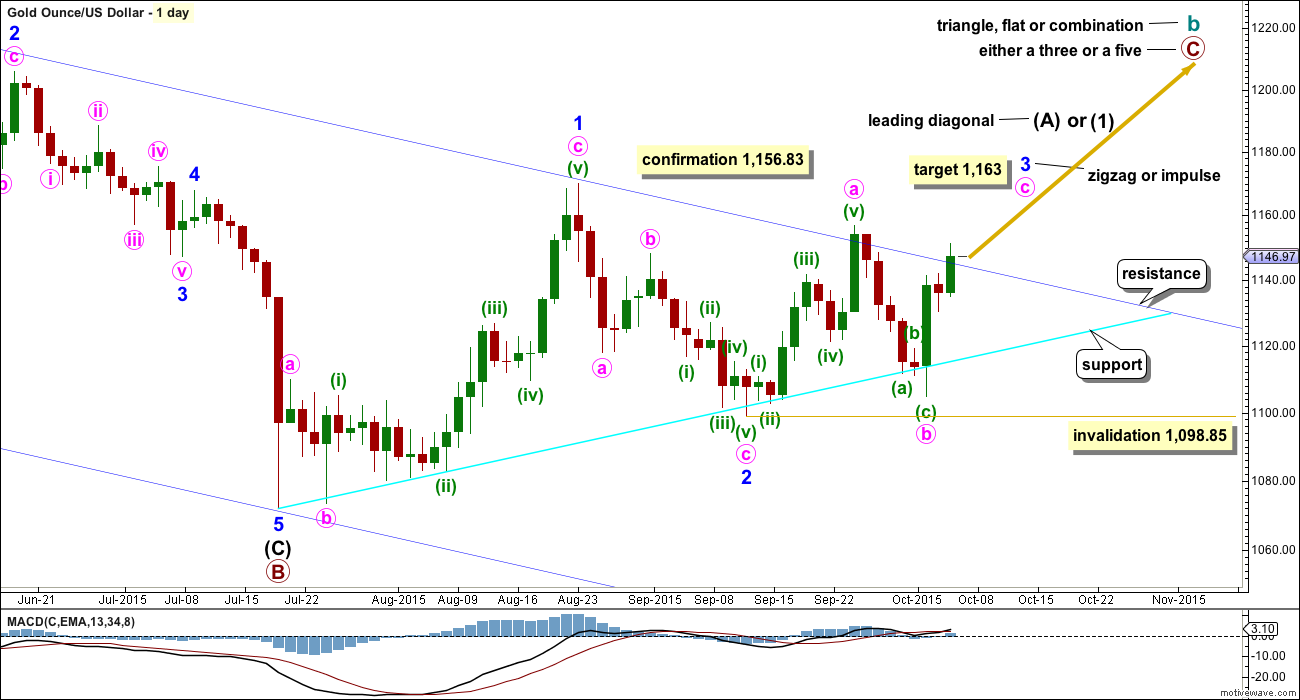
The bull wave count sees cycle wave a complete and cycle wave b underway as either an expanded flat, running triangle or combination. This daily chart works for all three ideas at the weekly chart level.
For all three ideas, a five up should unfold at the daily chart level for a movement at primary degree. This is so far incomplete. With the first wave up being a complete zigzag the only structure left now for intermediate wave (1) or (A) would be a leading diagonal. While leading diagonals are not rare they are not very common either. This reduces the probability of this bull wave count.
A leading diagonal requires the second and fourth waves to subdivide as zigzags. The first, third and fifth waves are most commonly zigzags, the but sometimes may appear to be impulses. So far minor wave 1 fits well as a zigzag.
To the upside, a new high above 1,156.83 would invalidate the bear wave count and provide strong confirmation for this bull wave count.
Upwards movement is finding resistance at the upper edge of the blue channel and may continue to do so. Use that trend line for resistance, and if it is breached, then expect a throwback to find support there.
Price has again come down to touch the bright aqua blue trend line and bounced up from here. If price continues any higher, then it should find very strong resistance at the upper dark blue trend line.
Minor wave 2 can now be seen as a complete zigzag. It is 0.73 the depth of minor wave 1, nicely within the normal range of between 0.66 to 0.81 for a second wave within a diagonal.
Third waves within leading diagonals are most commonly zigzags, but sometimes they may be impulses. Minor wave 3 should show some increase in upwards momentum beyond that seen for minor wave 1. Minor wave 3 must move above the end of minor wave 1 above 1,170.19.
Within minor wave 3, now at 1,163 minute wave c would reach equality in length with minute wave a. This would see minor wave 3 shorter than minor wave 1, so the leading diagonal would be contracting and that is the more common variety than expanding for a leading diagonal. This would be a reasonable expectation.
There now looks like a five up on the daily chart within minor wave 3. This may be minute wave a within a zigzag, or it may also be minute wave i within an impulse. It is difficult at this stage to see how minute wave b could continue any lower; it is likely to be over now as labelled. I will leave the invalidation point at 1,098.85 to consider the unlikely possibility that it could continue. If it does, then it may not move beyond the start of minute wave a.
Click chart to enlarge.
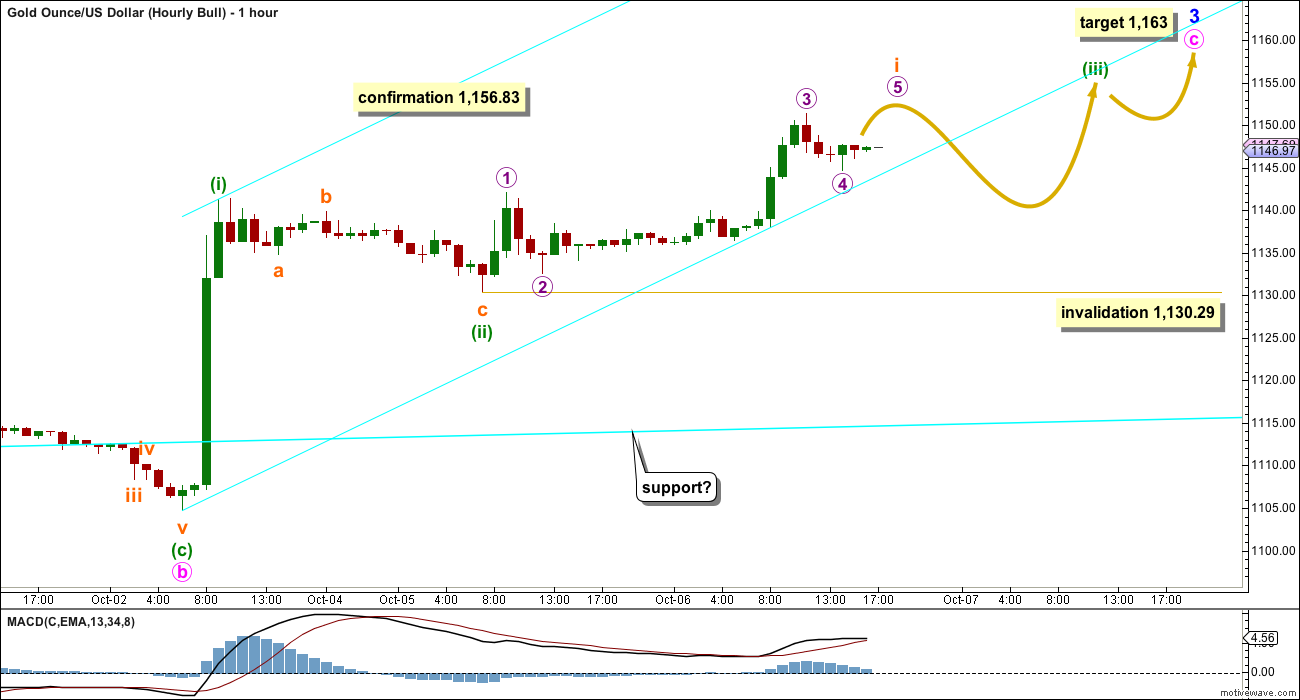
I have two ideas at the hourly chart level today for the bull wave count. Neither have a very good look to them; both have problems.
This first idea expects that minuette wave (ii) was complete as a quick very shallow 0.31 zigzag. This is entirely possible and it does show up on the daily chart as one red candlestick, but it is more shallow than second wave corrections normally are.
If a base channel is drawn about minuette waves (i) and (ii), then it would be clearly breached to the downside by subsequent upwards and sideways movement. That reduces the probability of this wave count. Base channels almost always work to show where subsequent corrections find support or resistance, but almost always is not the same as always.
If minuette wave (ii) is over, then minuette wave (iii) should have begun. It should show an increase in momentum beyond that seen for minuette wave (i), but so far momentum is decreasing. It may be because only subminuette wave i within minuette wave (iii) is unfolding.
Subminuette wave ii may not move beyond the start of subminuette wave i below 1,130.29.
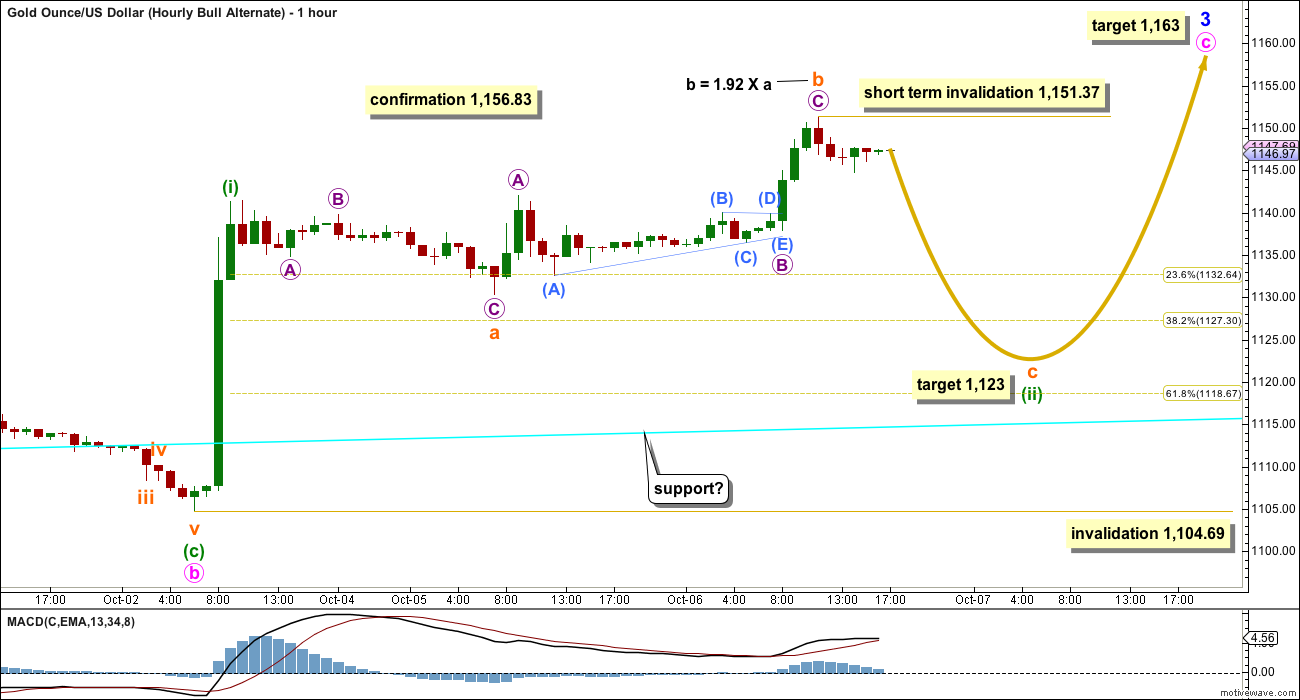
Click chart to enlarge.
Another equally valid idea is to see minuette wave (ii) continuing further as an expanded flat. The problem here is the depth of subminuette wave b. At 1.92 the length of subminuette wave a it is much longer than the normal range of 1 – 1.38, but just less than accepted convention of 2 times the length of subminuette wave a. The subdivisions fit nicely and it does show a decrease in momentum.
This idea does not look right at the daily chart level. Tuesday’s green candlestick does not look like part of a correction.
At 1,123 subminuette wave c would reach 2.618 the length of subminuette wave a.
Minuette wave (ii) may not move beyond the start of minuette wave (i) below 1,104.69. If price gets down that low, then it may again find some support about the aqua blue trend line (overshoots are acceptable at the daily chart level).
TECHNICAL ANALYSIS
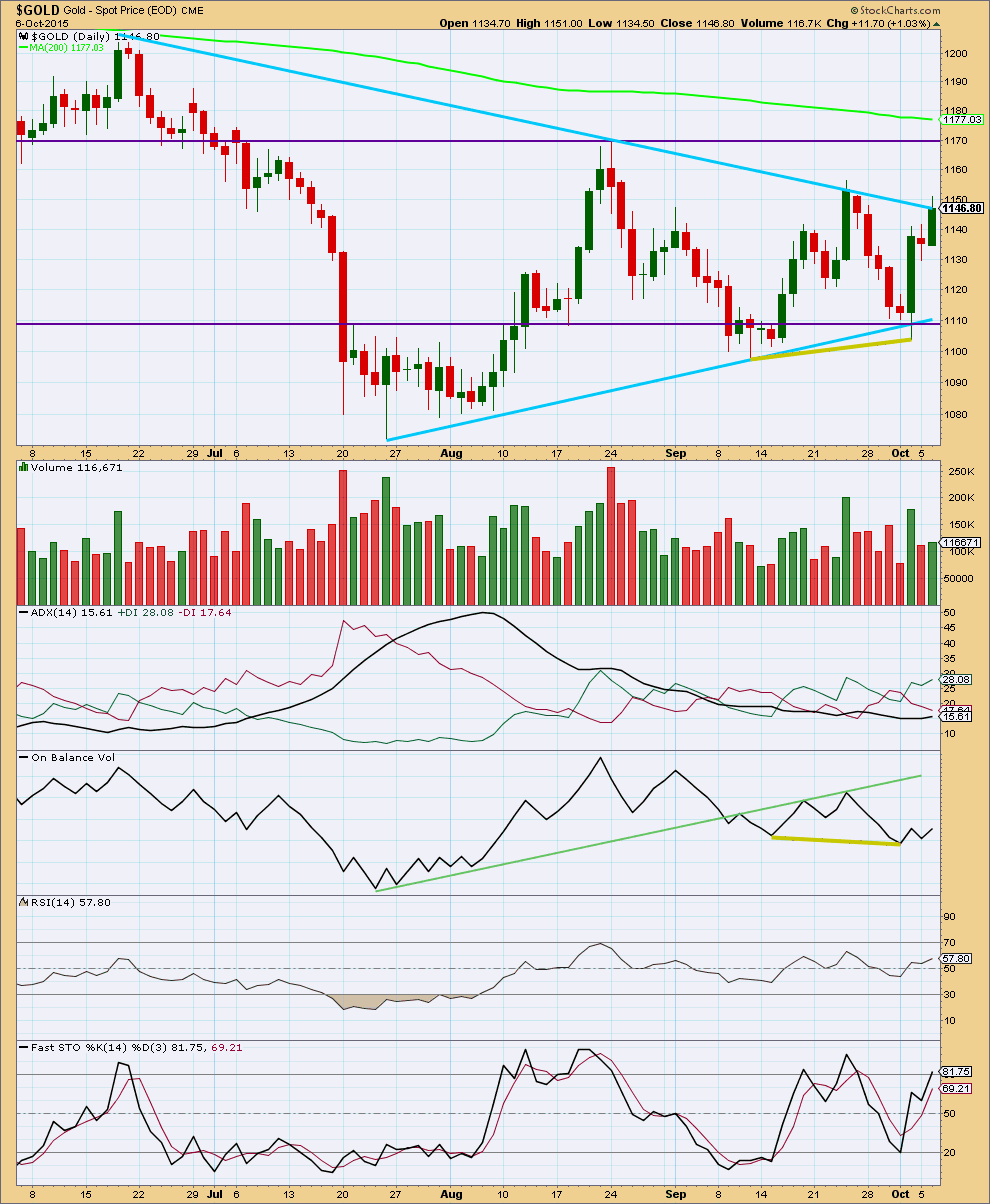
Click chart to enlarge. Chart courtesy of StockCharts.com.
Daily: What is very clear today is the rise in price is not supported by volume. Although volume is very slightly higher than the prior red candlestick it is much lower than the strong upwards day of Friday.
This rise in price over three days may be enough to resolve the bullish divergence between price and On Balance Volume.
The black ADX line is now pointing upwards. With it above 15, this may be an early indication of a new trend. For the signal to be stronger it should be above 20. If there is a new trend developing, then it would be upwards because the green +DX line is above the red -DX line.
With price now slightly overshooting the upper blue trend line, which has previously provided resistance, and Stochastics moving into overbought territory some downwards movement may be highly likely from here.
RSI at the daily chart level is neither overbought or oversold. There is room for the market to rise or fall.
Overall, at this stage, volume analysis indicates the bear wave count may be more likely than the bull.
This analysis is published about 06:37 p.m. EST.
Is anyone interested in Avi Gilburt’s – EW – Gold article just came out today?
yes please
Confessions of a Gold Analyst: How The Metals Market Has Come Full Circle
Wednesday October 07, 2015 12:57 – Avi Gilburt EW
http://www.kitco.com/commentaries/2015-10-02/Confessions-of-a-Gold-Analyst-How-The-Metals-Market-Has-Come-Full-Circle.html
My apologies as this article dated Oct 7th is a duplicate of the Oct 3rd article I posted earlier today with the same title, sorry.
Me also, please!
Done see above also his last two ones I posted earlier here today.
I’ll be watching the close of todays candlestick closely. If it closes red that would be more bearish than bullish. The tail is already slightly below the upper edge of the blue channel so today cannot end with a breach of the channel. Volume data from Stockcharts when available will add to whether or not today is more bearish than bullish.
The next 2 days will be interesting. If the bulls cannot manage to push price above that trend line and keep it there, and if they can’t manage to push price above the last swing high of 1,156.83 that would be bearish. If the bears manage a big downwards move from here then the bear wave count would still be favoured, only because we would not have confirmation of a trend change from bear to bull.
If the bull wave count is correct then the bulls really have to show themselves soon. This should be a third wave! That should have the power to increase momentum and slice through resistance. So far resistance is holding and upwards momentum is declining. So far it doesn’t look like a typical start to a third wave. The next couple of days may tell, because occasionally third waves do start off a bit slow and then explode. The bull wave count is still viable.
I am aiming to get GDX done for you all today, but please note, my exam is next week (seven days away!). So I may not be able to get extras done in the next few days. When thats over I’ll have more time for members requests. I thank you for your patience.
Lara yes please ensure you do plenty of studying for your exam ‘Chartered Market Technician’ as it will benefits you and all your subscribers. Thanks for your dedication to your profession.
What I’m doing now is more like cramming than studying….
Some things never change. I thought as I was older (than when I did my degree) I’d have better habits. Nope 🙂
Still, it works.
Most importantly today I see todays candlestick has its tail ending below the blue line.
This cannot close fully above the upper edge of the channel. It cannot be a breach. More upwards movement would still be required to eliminate the bear.
However, this very deep second wave correction is concerning for the bear wave count.
We just don’t have clarity yet.
Possible small 5 down from the high and 3 up completing now.
On a daily level, gold is still touching the blue line.
Hi Matt. I think from an e wave perspective, the charts are still a bit ambiguous. For the bulls, you might see that 5 wave down as the C wave of an expanded flat correction for subminuette wave ii. And that would mean we have a series of 1’s and 2’s setting up.
I can also see the bear count as still possible, however, one can’t deny that price has so far held above the important blue trend line. That shouldn’t be happening. It hasn’t really blasted away from it on high volume, which i think is necessary to make a final determination, but that may (or may not) happen tomorrow. There are important economic releases tomorrow, namely weekly jobless claims and FOMC minutes. Market may be waiting for that before breaking one way or another.
Yes, FOMC minutes will impact prices tomorrow.
I’ll be the first to admit that the bear case, in this form here, is hanging on a thread.
Not sure if it can pass the EW test, but I mentioned an alternate bear scenario in the comments section on Sept 25. Basically suggesting that gold could conceivably move up to a higher trendline that contains this entire bear market. That line comes in near the 200 day moving average and is close to .618 of the May high to July low.
Maybe I am taking this too far, but wouldn’t a triangle be one of those moments where false breakouts can occur? Like a quick blast higher, only to draw in the final bullish bets, before gold tanks. Just wishful thinking….
It looks like we will have to wait at least until tomorrow to get the answer 🙂
One thing is fairly certain and that is that the next directional move will be very powerful.
Indeed
Trend channel confirmation that minuette wave ii is over has occurred on the Hourly Bear wave count with more than 1 hour below the violet trend line slopped upwards as it was breached by several hours since about 4 am today. Also resistance line at 1,144 has been breached.
Hourly bull alternate wave count was invalidated last night with movement above 1151.37.
Added JDST at close and in premarket. About $28.10 avg right now.
Both Bull and bear count still valid. Gold moved up to 1151 but did not move above 1156.
Lonely bear now!!!!
There’s a small 5 down on the 15 minute chart since the last high now. If that high holds, the Bears still have a chance!
Yes gold takes out 1144 according to Lara: trend confirmation line.
Also, the C wave is fairly close to having a 0.618 ratio to A. With the exception of this correction being excessively deep, which we really should not ignore, it looks perfect (clear 3 waves, ratio of C to A and volume drying up).
Now looks like two 5 wave declines from overnight high. Watching closely.
Now with 5 waves up from the low. I am flat and watching.
OCTOBER 1ST Thursday may have been the start of a new bullish trend for gold and miners. October 1st GDX low was $13.35
Long term indicators bullish GDX
gave a BUY on these time frames
Daily ‘Buy’ October 1st
Weekly ‘Buy’ September 14th
Monthly ‘Buy’ October
GDX low since before 2010 so far was $12.62 September 11th, 2015
Let’s see if Elliott Wave confirms Bullish wave count and invalidates Bearish wave count this week.
This isn’t to say that gold and the miners have hit final bottom.
Are We Seeing A Paradigm Shift in Metals – Avi Gilburt – October 6, 2015
http://www.gold-eagle.com/article/are-we-seeing-paradigm-shift-metals
Avi Gilburt – Confessions Of A Gold Analyst: How The Metals Market Has Come Full Circle – October 3, 2015
http://www.gold-eagle.com/article/confessions-gold-analyst-how-metals-market-has-come-full-circle
These move Gold up – US economy weak, Fed increase rate less likely, US dollar down, oil up, stock market up.
Can The Gold Rally Continue? – Avi Gilburt -Elliott Wave
http://www.gold-eagle.com/article/can-rally-continue
Gold just reached up to 1.151.98 at 1:46 am and invalidated the hourly bull alternate wave count above 1,151.37.
Lara thank you for your update and video.
You provide the most detail I have ever seen in a gold analysis.
You’re welcome 🙂
Someone placed a BIG bet on GLD today …
http://www.bottarelliresearch.com/trades/2015/10/06/bull-betting-11-million-gold
Just a View: With a low of 1146-45 already, expecting upwards movement / good advance from CMP for 1153-60+… Lets see.