
Upwards movement to a target at 51.14 to 51.2 was expected.
Price moved higher and so far has turned at 50.93 just short of the target zone.
Summary: Downwards movement is expected as likely from here but is not yet confirmed. Only when price breaks below the lower edge of the upwards sloping blue channel on the daily chart will I have confidence that the upwards wave is over and the next wave down is underway.
New updates to last analysis are bold.
MONTHLY ELLIOTT WAVE COUNT
Click chart to enlarge.
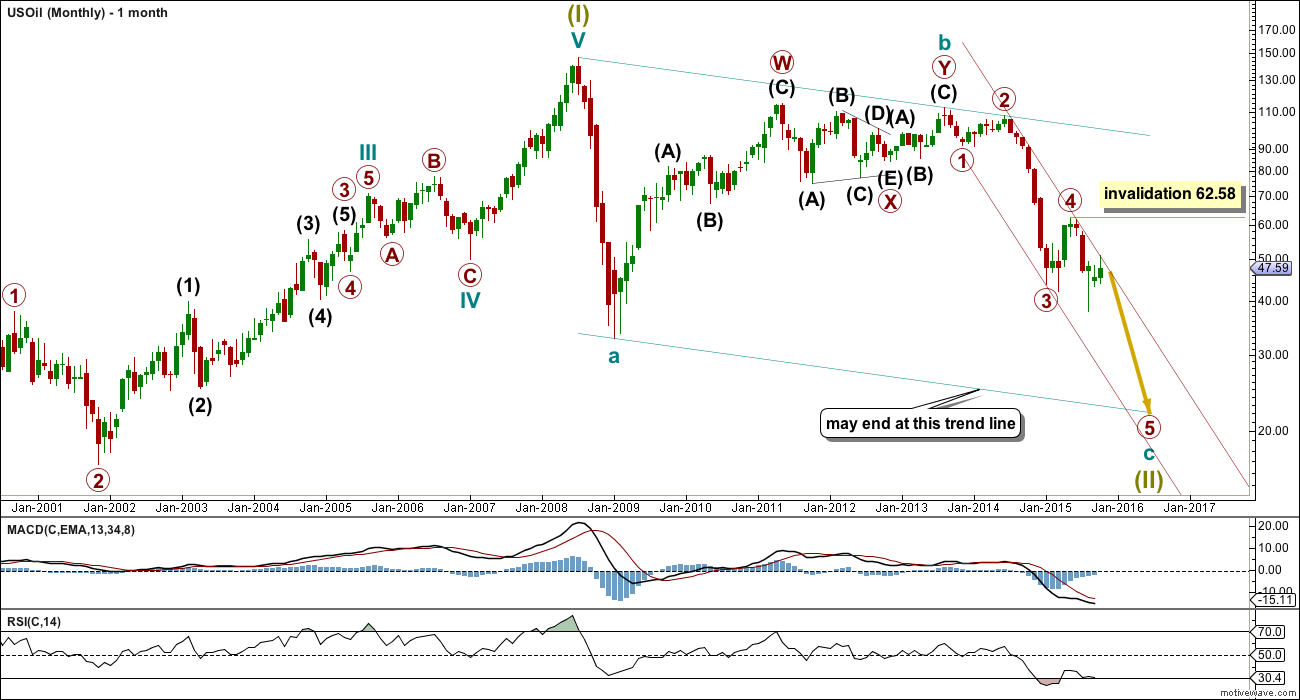
US Oil has been in a bear market since August 2013. While price remains below the upper edge of the maroon channel drawn here and below the 200 day simple moving average it must be accepted that the bear market most likely remains intact. I will not publish a bull wave count while this is the case and while there is no technical confirmation of a trend change from bear to bull.
The structure of cycle wave c is incomplete.
This wave count sees US Oil as within a big super cycle wave (II) zigzag. Cycle wave c is highly likely to move at least slightly below the end of cycle wave a at 32.70 to avoid a truncation. Cycle wave c may end when price touches the lower edge of the big teal channel about this zigzag.
It is just possible that cycle wave c could be complete at the last low of 37.75. However, that would see cycle wave c truncated by 5.05, which is a large truncation. I would consider this possibility only if it is confirmed with a clear breach of the maroon channel on the monthly chart.
Within cycle wave c, primary wave 5 is expected to be extended which is common for commodities.
Within primary wave 5, no second wave correction may move beyond its start above 62.58.
Draw a channel about this unfolding impulse downwards. Draw the first trend line from the highs labelled primary waves 2 and 4 then place a parallel copy on the end of primary wave 3. Next push up the upper trend line slightly to contain all of primary waves 3 and 4. Copy this channel over to the daily chart. The upper edge should provide resistance.
DAILY ELLIOTT WAVE COUNT
Click chart to enlarge.
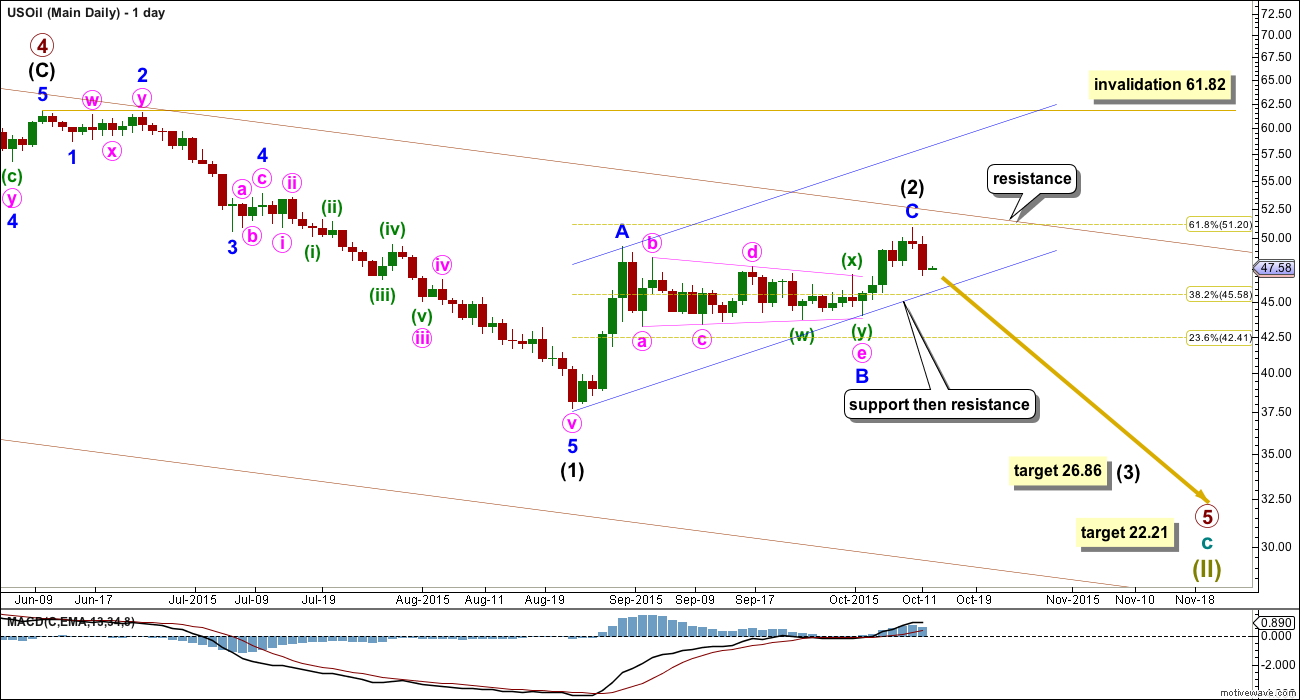
The intermediate degree corrections were brief and shallow within primary wave 3 down. Now, within primary wave 5, this correction for intermediate wave (2) is neither brief nor shallow.
Within the zigzag of intermediate wave (2), minor wave C is 0.21 short of 0.618 the length of minor wave A. Intermediate wave (2) has reached up almost to the 0.618 Fibonacci ratio of intermediate wave (1). It is very likely that it is over here.
If it continues any further, intermediate wave (2) is likely to find resistance at the upper edge of the maroon channel copied over from the monthly chart.
Intermediate wave (2) may not move beyond the start of intermediate wave (1) above 61.82.
Draw a channel about intermediate wave (2) using Elliott’s technique for a correction: draw the first trend line from the start of minor wave A to the end of minor wave B, then place a parallel copy on the end of minor wave A. At this stage, there is no confirmation that intermediate wave (2) is complete. Only when there is a full daily candlestick below the lower edge of the channel and not touching that lower trend line would there be confirmation that the upwards wave is over and the next wave down has begun. While price remains within that channel the risk that upwards movement could continue will remain high and the invalidation point will remain at 61.82.
If price turns down as expected, then look for some support initially about the lower edge of the blue channel. If price breaks below support there, then look for a throwback to that trend line. If a throwback to the line ends at resistance, at the line, then the trend line strength is reinforced. When price behaves like that it provides a perfect opportunity to join a trend.
Over the next few days, I will wait patiently for the lower blue line to be breached and then I shall wait patiently for a throwback.
At 26.86 intermediate wave (3) would reach equality in length with intermediate wave (1).
TECHNICAL ANALYSIS
DAILY CHART
Click chart to enlarge. Chart courtesy of StockCharts.com.
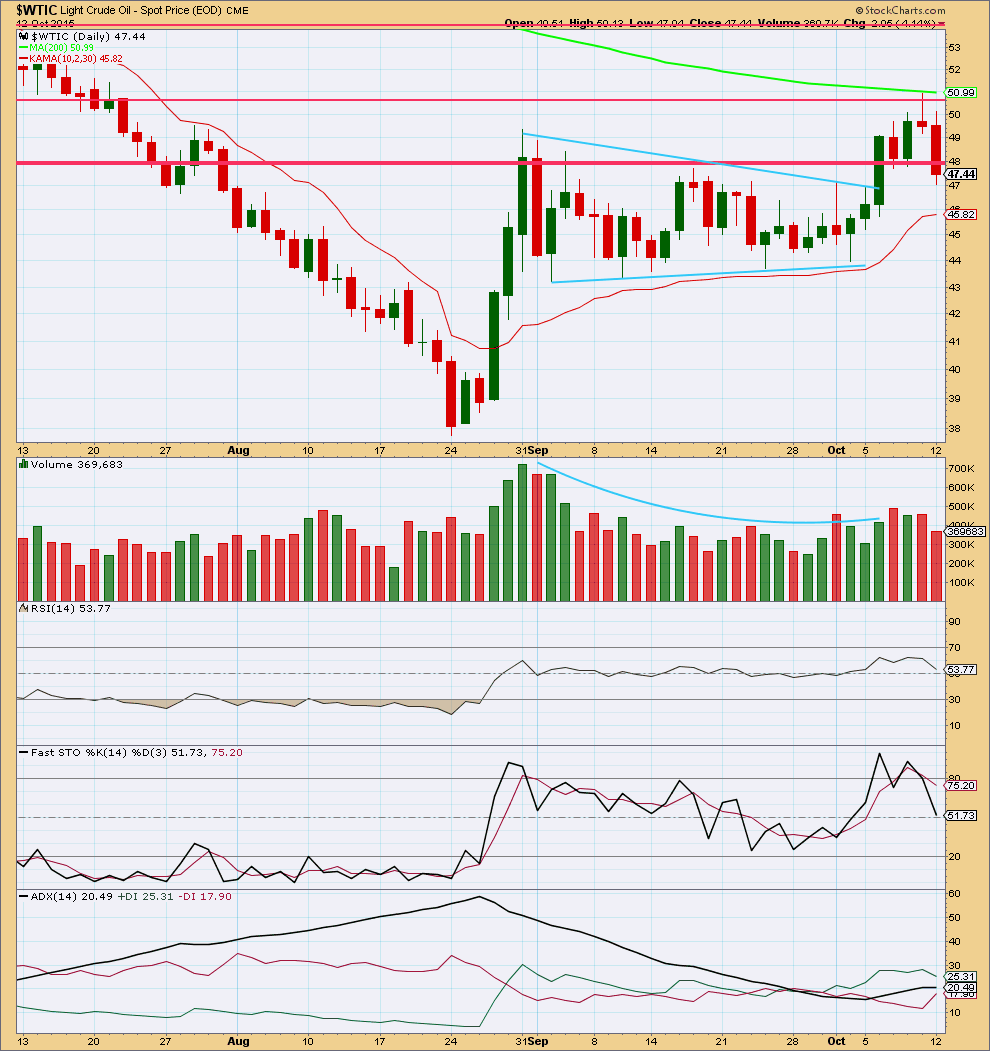
Since 27th August the black ADX line has pointed downwards indicating at first an expiring trend and now a consolidation. Last week, as price moved higher, ADX began to indicate a new upwards trend. Today the black ADX line is again flat indicating no clear trend.
Price broke above the first horizontal line of resistance to find resistance at the next horizontal line and turn down from there.
An evening doji star has formed with the last three daily candlesticks. This is a bearish reversal pattern.
It looks like the market remains range bound with price finding resistance at the upper horizontal line. The bearish candlestick pattern and resistance indicate some downwards movement should develop from here. There still has not been a breakout from this consolidation. A downwards swing may be expected to continue until price finds support and Stochastics is oversold.
This analysis is published about 10:02 p.m. EST.
October 16
Lara Stockchart oil data shows US oil low for the day was 46.64. But on PMBull wtic oil was trading as low as 45.31.
What is the price range on FXCM for oil?
Price disparity or inaccurate data makes difficult to analise the chart.
Thanks.
Was expecting a reversal white candle (hammer) that’s what happen. At critical apex oil fell below and closed inside trading range.
Had a chance to buy UCO or UWTI at the bottom but held back.
Corrective wave 2 is complete and did not want to take the chance.
Still prudent to wait for a clear breakout below blue line for short.
Wave 2 duration is with in the range 34 days for wave 2 to complete.
Currently US Oil is barely hanging at blue line 46.06.
Yes, looks like we are heading in the right direction!
It looks like oil broke support at 46!
US oil is backtesting the BO line. Once it bounces off long oil is in oder for short term trade???
If the wave count is right the trend is down.
Your call. But the “trend is your friend”. Any trades to the upside should understand the risk that the trend may be down.
And I may also be wrong in my wave count.
Lara: you are not wrong. Looking for US oil to fluctuate and close below the blue line. Awaiting for wave 3 to begin.
Thanks.
Hi Lara , thanks for the update do you have target for the down trend please ?!
Yes, it’s on the chart. 26.86.
Excellent analysis Lara. I had a few Oil trades over the past week, that C wave had some very nice momentum.
I will be looking for an entry on the short side soon.
Nice. Always nice to hear members are able to profit using my analysis.
Me too, I had a few Oil trades as well + USD/RUB.(from 65 to 61) Double kill.
Thanks a bunch:)
You’re welcome!