
Yesterday’s alternate hourly Elliott wave count was confirmed with a slight new low. Thereafter, price is behaving as expected.
Summary: This correction is longer lasting than originally anticipated. It is possible it may end in just one more day, but more likely another four days of overall upwards movement is expected to 1,101 – 1,103 or 1,127 to complete an expanded flat for a second wave.
New updates to this analysis are in bold.
To see weekly charts and the difference between the two wave counts go here.
MAIN ELLIOTT WAVE COUNT
Click chart to enlarge.
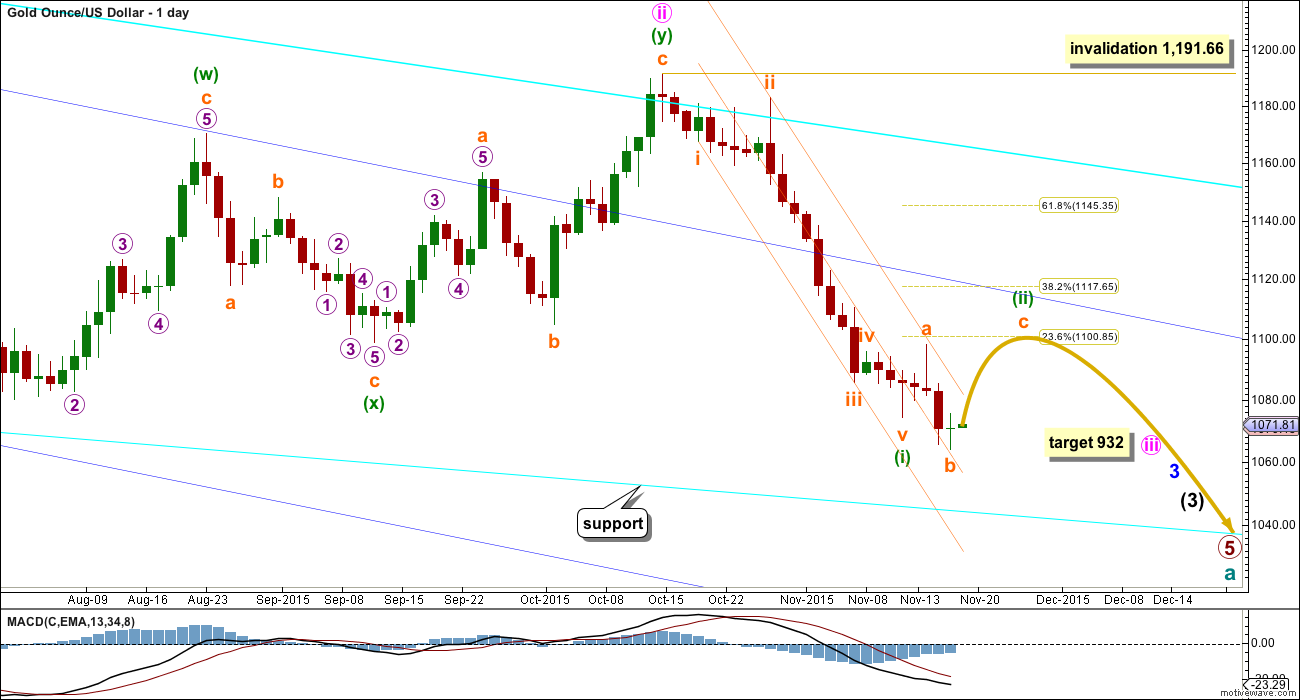
Gold has been in a bear market since September 2011. There has not yet been confirmation of a change from bear to bull, and so at this stage any bull wave count would be trying to pick a low which is not advised. Price remains below the 200 day moving average and below the blue trend line (copied over from the weekly chart). The bear market should be expected to be intact until we have technical confirmation of a big trend change.
The final line of resistance (cyan line copied over from weekly charts) is only overshot and not so far properly breached. While this line is not breached the bear wave count will remain possible. Simple is best, and the simplest method to confirm a trend change is a trend line.
Minute wave ii is a complete double zigzag and deep at 0.75 the length of minute wave i. It has breached the dark blue base channel drawn about minor waves 1 and 2, one degree higher. When a lower degree second wave correction does this it reduces the probability of the wave count but does not invalidate it. Base channels most often work to show where following corrections find support or resistance, but not always.
Draw a channel about this downwards movement using Elliott’s first technique: draw the first trend line from the end of minuette wave (i) to minuette wave (iii), then place a parallel copy on the high of minuette wave (ii).
Minuette wave (ii) should show up on the daily chart and may last a total Fibonacci five or eight days. It may be longer lasting, but at this early stage a quicker end should be expected. The middle of a big third wave is still approaching which may force corrections to be more brief and shallow than otherwise.
Minuette wave (ii) should first breach the orange channel containing minuette wave (i). If it ends at resistance at the dark blue line, it may reach only up to the 0.382 Fibonacci ratio of minuette wave (i) at 1,118. Final resistance would be at the final bear market trend line.
This may resolve RSI being oversold.
MAIN HOURLY WAVE COUNT
Click chart to enlarge.
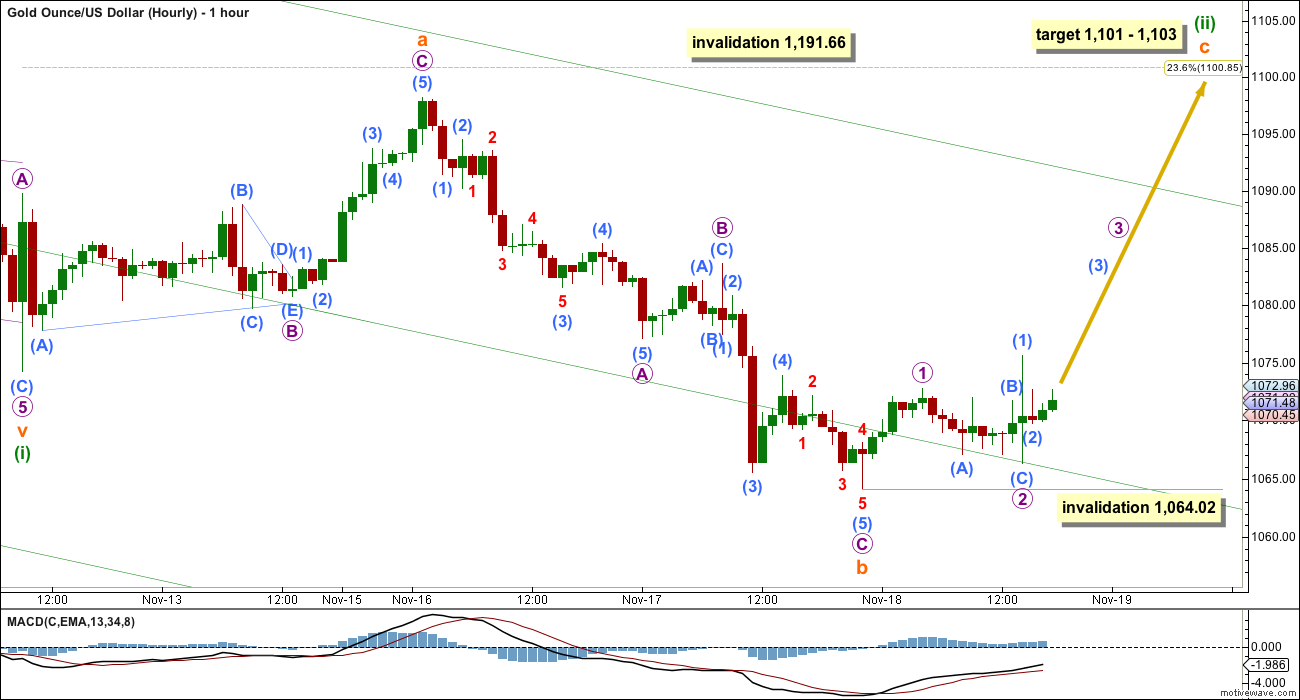
There are technically still several structural possibilities for minuette wave (ii): it may be an expanded flat correction as labelled or it may be a combination. A combination looks to be unlikely though because normally their X waves are not this deep. This looks like a typical expanded flat.
Subminuette wave b is now 1.43 times the length of subminuette wave a. This is longer than the normal length of up to 1.38, but well within the allowable convention of 2 times the length of A.
Subminuette wave c is highly likely to move at least slightly above the end of subminuette wave a at 1,098.25 to avoid a truncation and a very rare running flat.
At 1,103 subminuette wave c would reach 1.618 the length of subminuette wave a. This is close to the 0.236 Fibonacci ratio at 1,101 giving a $2 target zone.
If upwards movement continues through the first target, or if when price gets there the structure of subminuette wave c is incomplete, then a second target would be at 1,127 where subminuette wave c would reach 2.618 the length of subminuette wave a.
Subminuette wave c must subdivide as a five wave structure, either an ending diagonal or an impulse.
So far minuette wave (ii) has lasted four days. It is just possible it may complete in one more day to total a Fibonacci five. If it does not manage to do that, then the next expectation would be a further four days to total a Fibonacci eight.
Minuette wave (ii) may not move beyond the start of minuette wave (i) above 1,191.66.
At this stage, a new low below 1,064.02 would invalidate this main hourly wave count and confirm the alternate below. If micro wave 2 continues further as a double flat or combination, then it may not move beyond the start of micro wave 1.
ALTERNATE HOURLY WAVE COUNT
Click chart to enlarge.
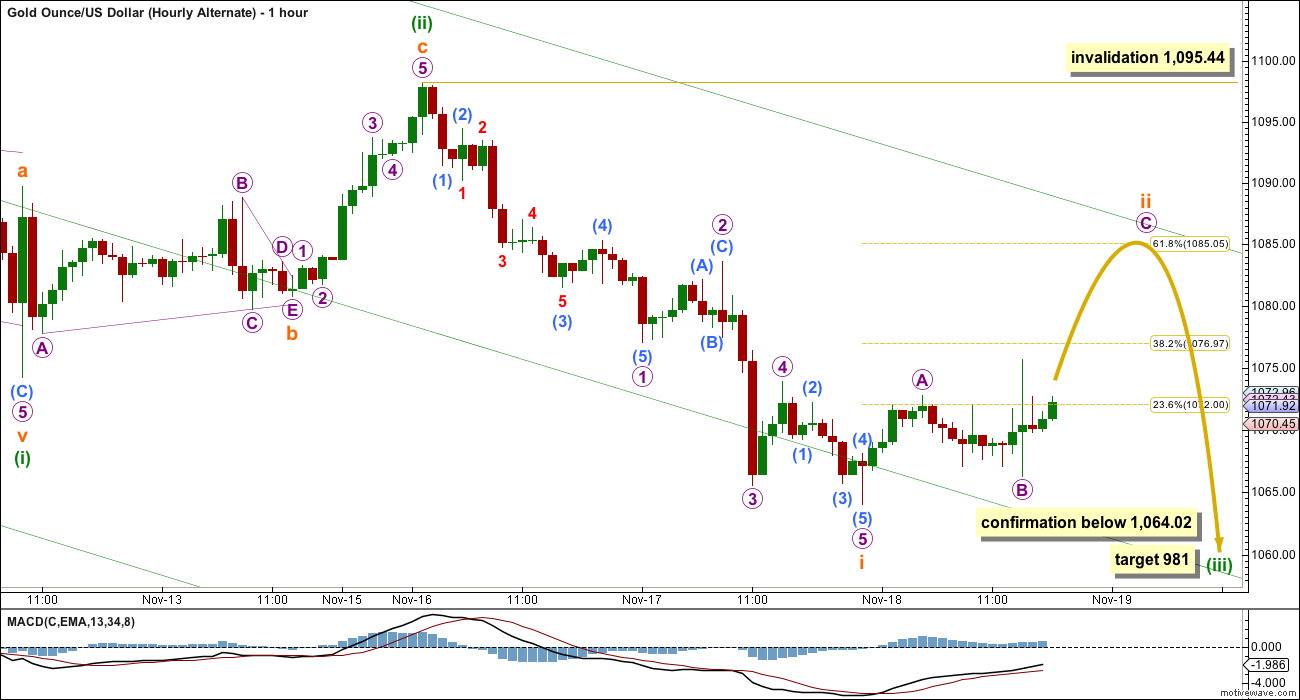
If the degree of labelling within the zigzag upwards to 1,095.44 is moved up one degree, then minuette wave (ii) may be over as a quick shallow zigzag lasting only two days and falling just short of the 0.236 Fibonacci ratio.
The wave down labelled here subminuette wave i will subdivide as either a three wave zigzag (main hourly wave count) or a five wave impulse (this alternate hourly wave count). It is ambiguous; it is impossible to determine with certainty which of the two structures this is. Both must be considered. It does have a slightly better fit as a three wave zigzag which favours the main hourly wave count.
This is technically possible and so must be considered, but it is less likely than the main hourly wave count. Minuette wave (ii) should breach the channel containing minuette wave (i), but here it has not.
At 981 minuette wave (iii) would reach equality in length with minuette wave (i).
Within minuette wave (iii), subminuette wave ii may end about the 0.382 Fibonacci ratio at 1,077 or the 0.618 Fibonacci ratio at 1,085. Subminuette wave ii may not move beyond the start of subminuette wave i above 1,095.44.
Only if there is a new low in the next 24 hours below 1,064.02 should this idea be seriously considered.
ALTERNATE ELLIOTT WAVE COUNT
Click chart to enlarge.
I am aware that this is the wave count which EWI and Danerics have. The implications are important, so I will follow this wave count daily for members here too.
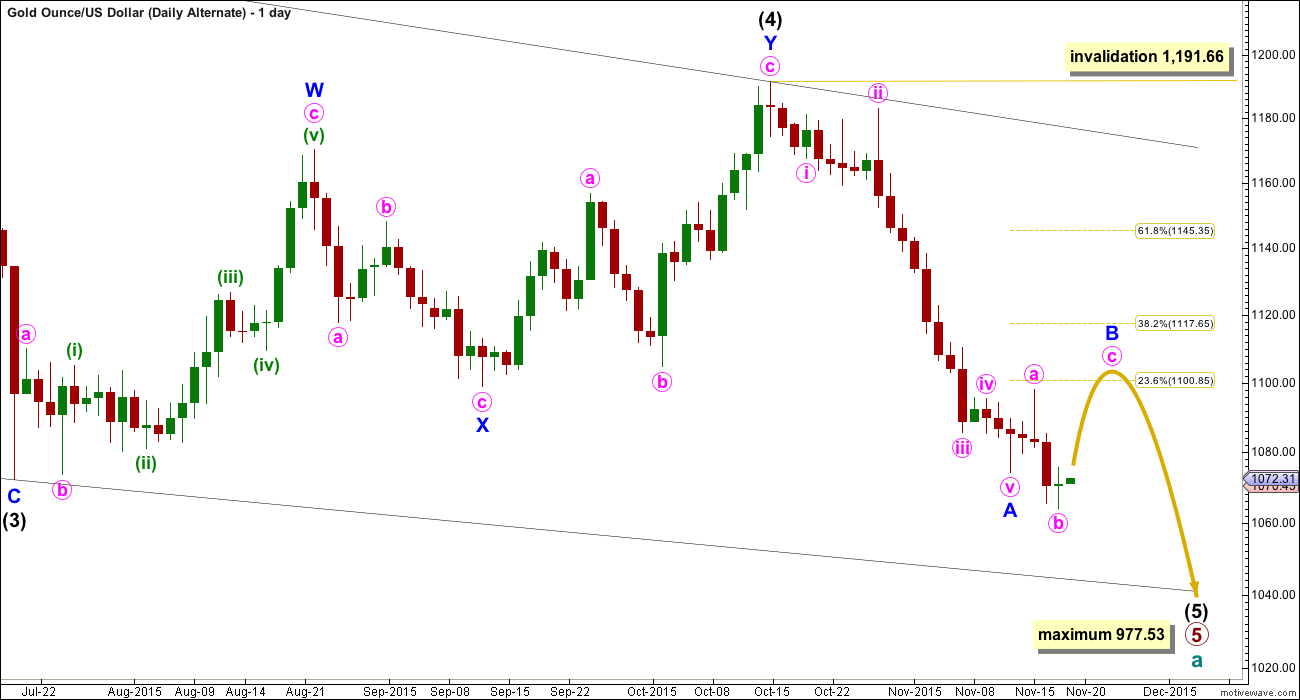
Everything is the same up to the end of the triangle for primary wave 4. Thereafter, primary wave 5 is seen as an ending contracting diagonal.
Within the ending contracting diagonal, it is not possible to see intermediate wave (2) as a zigzag and meet all Elliott wave rules. To see an explanation of why see this video at 10:25.
The same problem exists for the ending diagonal of primary wave 5 itself. Intermediate wave (3) is longer than intermediate wave (1) which would suggest an expanding diagonal, but intermediate wave (4) is shorter than intermediate wave (2) and the trend lines converge which suggests a contracting diagonal.
From “Elliott Wave Principle” by Frost and Prechter, 10th edition, page 88: “In the contracting variety, wave 3 is always shorter than wave 1, wave 4 is always shorter than wave 2, and wave 5 is always shorter than wave 3. In the expanding variety, wave 3 is always longer than wave 1, wave 4 is always longer than wave 2, and wave 5 is always longer than wave 3.”
This structure violates the rules for both a contracting and expanding variety. If the rules in Frost and Prechter are accepted, then this is an invalid wave count.
It may be that the rules need to be rewritten to add “sometimes a third wave may be the longest within a contracting or expanding diagonal”. But I have never seen Robert Prechter publish such a rule, I do not know that it exists.
I cannot reconcile this wave count from EWI with the rules in Frost and Prechter.
If an ending contracting diagonal is unfolding, then the (1) – (3) trend line may be overshot signalling the end of intermediate wave (5). If price behaves thus and turns around and moves strongly higher, then this wave count must be accepted and the rules for diagonals will need to be rewritten.
I will continue to follow this possibility as price moves lower.
Intermediate wave (5) should be shorter than intermediate wave (1). At 977.53 intermediate wave (5) would reach equality in length with intermediate wave (1). A new low below this point would take this possible diagonal structure too far from the rules. At that stage, it really should be finally discarded.
All sub waves within ending diagonals must subdivide as zigzags. Within the zigzag of intermediate wave (5), minor wave B should unfold over several days. At this stage, there is no divergence between this idea and the main Elliott wave count.
Minor wave B may not move beyond the start of minor wave A above 1,191.66.
I am uncomfortable with publishing this wave count and I only do so because it has been published by Elliott Wave International. I am not comfortable with publishing any wave count which violates the rules in Frost and Prechter. However, when looking at primary wave 5 on the weekly chart it does look like a diagonal is unfolding.
Short to mid term there is no divergence in expected direction between this wave count and the main wave count.
TECHNICAL ANALYSIS
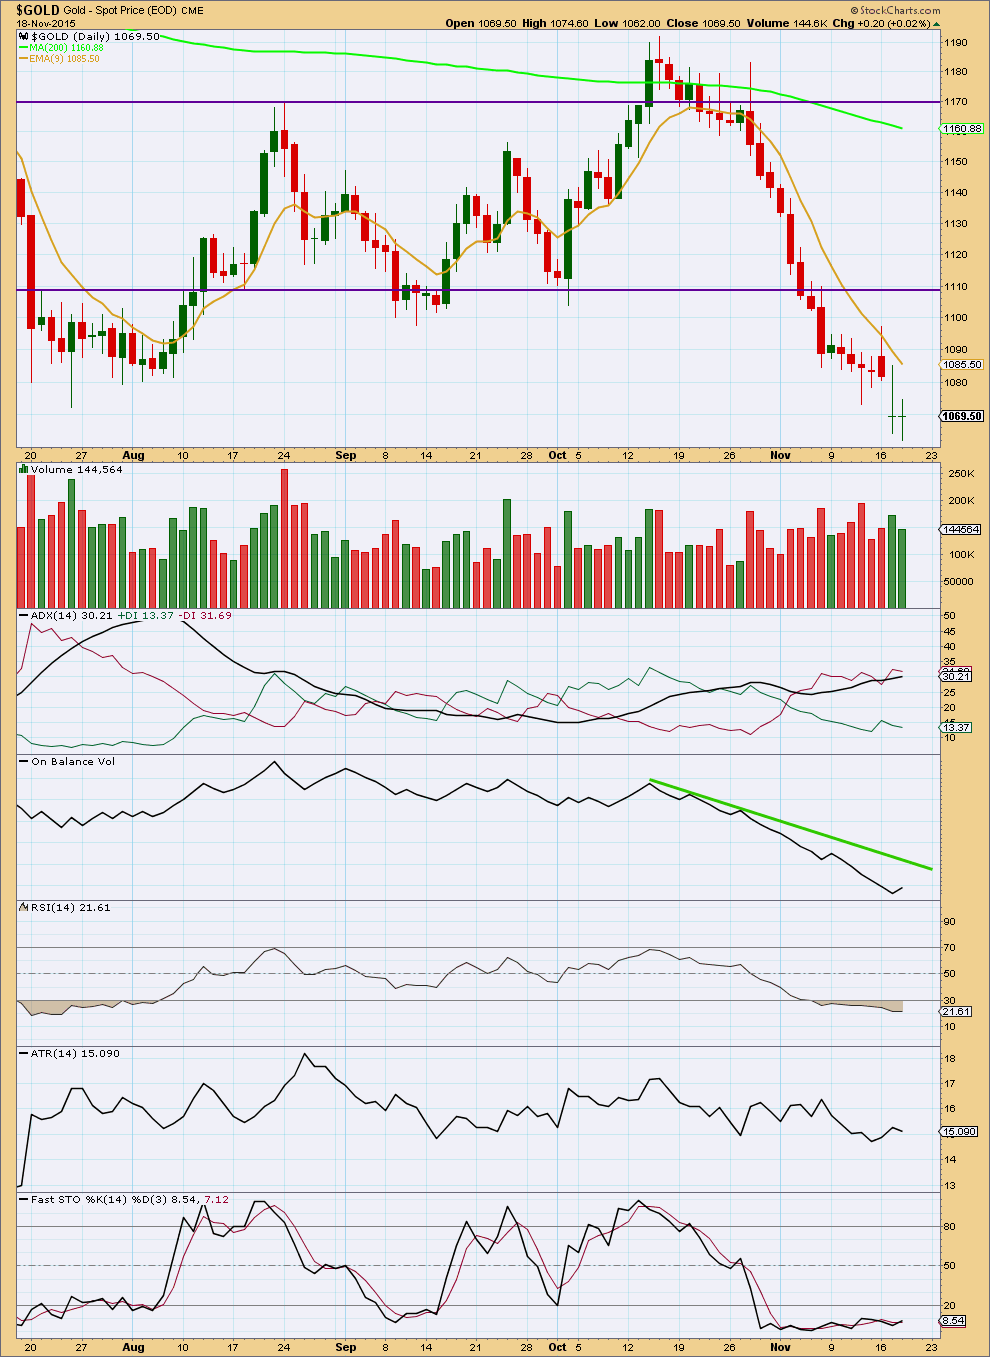
Click chart to enlarge. Chart courtesy of StockCharts.com.
Daily: Two green doji in a row looks very corrective. Wednesday’s doji comes with some decline in volume, and the small upwards balance of price movement was not supported by volume. Price is finding resistance at the 9 day EMA.
ADX still indicates the market is in a downwards trend. On Balance Volume remains very bearish.
RSI is still oversold, so this has not been resolved. There is very slight bullish divergence today between price and RSI; price made a slight new low while RSI did not. This often comes at a trend change and indicates some upwards movement from here may be likely.
There is also small slight bullish divergence between price and Stochastics.
At least one upwards day is indicated. This supports the main hourly Elliott wave count.
This analysis is published about 07:18 p.m. EST.
Price is finding resistance at the upper edge of the channel about minuette (i) which is drawn on the daily chart and copied over to the hourly.
When price manages to break above that trend line then look for a throwback, support at that line.
Price is moving higher but it’s choppy and overlapping.
Subminuette c can be one of two structures; an impulse as I have it labelled or an ending diagonal.
I’m going to chart both today and I may favour the ending diagonal.
I’m still going to be expecting a new high above 1,098.25 as most likely. As soon as price gets above that point then look out for subminuette c to be over. If at that stage the structure is clearly complete I’ll expect it to be over, but if the structure is not complete then price should keep going up until it is.
Targets remain exactly the same. At this stage we may see another three days maybe of upwards movement to total a Fibonacci 8 for minuette (ii). That looks to be maybe too long in duration… but if subminuette c is an ending diagonal that may be necessary.
Ending diagonals subdivide into a series of zigzags. They’re choppy and overlapping but have a slope, they’re not sideways. A rising wedge is the regular TA equivalent.
I’m just guessing, would we be nearing the end of micro 3 about now?
Is Alan Tham here today?
If subminuette c is an impulse: we now have a series of three overlapping first and second waves. Invalidation point 1,069.57; minuscule wave 2 may not move beyond the start of minuscule wave 1.
If subminuette c is an ending diagonal: micro wave 1 is complete, micro wave 3 is halfway through, it must be a zigzag. Submicro (A) is complete and this downwards movement is currently sub micro (B). Submicro (B) may not move beyond the start of sub micro (A) below 1,069.57.
Overall still upwards movement required for both ideas, the invalidation points at this time would also be the same.
Thank you Lara for that awesome update!
I would say that we have started submicro 5 of micro 3 at 1:20 pm. It would take a while to complete. The movement had been very choppy but is on track to Lara’s lower target of 1101, unless the fifth wave (micro 5) shows a phenomenal increase.
Thanks for your opinion and wave count Alan.
Submicro 5 within Micro 3 was my second guess. Had to run out to an appointment, didn’t take time to respond but appreciated your post. It was good to hear from you. (You make it simple).
Have you ever thought of doing EW on CHFUSD? I feel badly I leaked another businesses secret out the other day, but oh well now its out. Kimble Charting is using the CHFUSD as a major indicator for gold price movement. Wondering what EW looks like on that. I really should send a post to Lara. She so good at this.
Gold Rebounds on Short Covering, Bargain Hunting, Weaker U.S. Dollar Index
Thursday November 19, 2015 10:02
http://www.kitco.com/news/2015-11-19/Gold-Rebounds-on-Short-Covering-Bargain-Hunting-Weaker-U-S-Dollar-Index.html
Nugt is Screaming. Many Thanks Lara!
You’re most welcome 🙂
The time-lapse stock trading game.
Test your TA skills.
http://chartgame.com/
There is a possibility of wave c ending today per fib duration.
Lara: Subminuette wave c is highly likely to move at least slightly above the end of subminuette wave a at 1,098.25 to avoid a truncation and a very rare running flat.
Watch 1098.25 price point.
Is it worth playing for few days???
Lara: It is just possible it (wave ii) may complete in one more day to total a Fibonacci five. If it does not manage to do that, then the next expectation would be a further four days to total a Fibonacci eight.
If you do then you would most likely be playing against the trend.
If you’re experienced and nimble you may manage it. Manage risk carefully, expect losses and make sure they’re not too large would be my unsolicited advice on that 🙂
Did any one notice yesterday FOMC day there was no surprise in gold price. It followed lara’s wave count . Gold price was contained in the range and validated the wave c.
Gold range 1076 -1066.
Yes Lara called it well it went above confidence point and was bullish.
I notice that “news” announcements often fit wave counts very nicely indeed.
If I have the right count before the announcement then I’ll get the prediction right.
If I have the wrong count before the announcement then I’ll get it wrong.
But it will always fit into the restrictive EW rules.