
A correction was expected to most likely continue, which is what has happened.
Summary: A new high above 1,088.22 would provide confidence that this correction is not over, which at this stage is very likely. The target remains at 1,101 – 1,103. A new low below 1,067.33 would confirm the correction is over and the downwards trend has resumed. The middle of a strong third wave down may be approaching. Again, expect any surprises to be to the downside.
New updates to this analysis are in bold.
To see weekly charts and the difference between the two wave counts go here.
MAIN ELLIOTT WAVE COUNT
Click chart to enlarge.
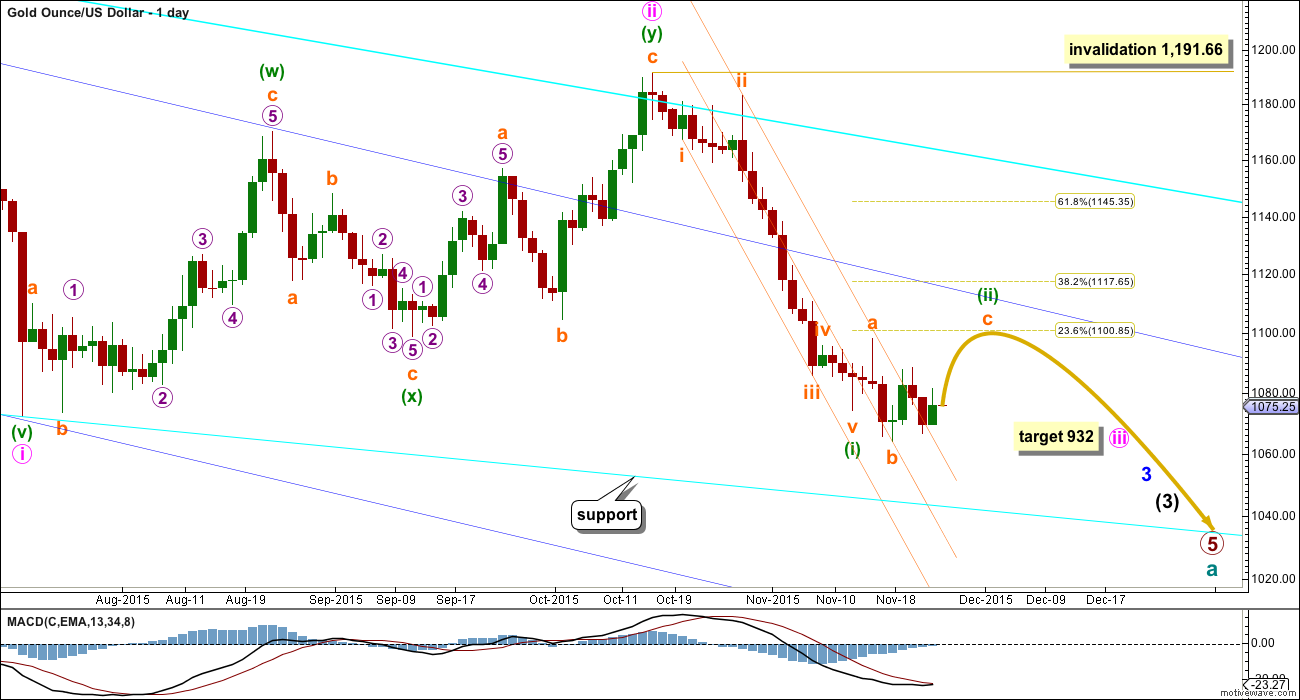
Gold has been in a bear market since September 2011. There has not yet been confirmation of a change from bear to bull, and so at this stage any bull wave count would be trying to pick a low which is not advised. Price remains below the 200 day moving average and below the blue trend line (copied over from the weekly chart). The bear market should be expected to be intact until we have technical confirmation of a big trend change.
The final line of resistance (cyan line copied over from weekly charts) is only overshot and not so far properly breached. While this line is not breached the bear wave count will remain possible. Simple is best, and the simplest method to confirm a trend change is a trend line.
Minute wave ii is a complete double zigzag and deep at 0.75 the length of minute wave i. It has breached the dark blue base channel drawn about minor waves 1 and 2, one degree higher. When a lower degree second wave correction does this it reduces the probability of the wave count but does not invalidate it. Base channels most often work to show where following corrections find support or resistance, but not always.
Draw a channel about this downwards movement using Elliott’s first technique: draw the first trend line from the end of minuette wave (i) to minuette wave (iii), then place a parallel copy on the high of minuette wave (ii).
Minuette wave (ii) is showing up on the daily chart and so far has lasted eight days. It may now complete in a total Fibonacci thirteen days, so a further five days of choppy overlapping upwards movement is expected.
Minuette wave (ii) has now breached the orange channel containing minuette wave (i). If it ends at resistance at the dark blue line, it may reach only up to the 0.382 Fibonacci ratio of minuette wave (i) at 1,118. Final resistance would be at the final bear market trend line.
This may resolve RSI being oversold.
Using FXCM data there is a morning doji star at the last low. This supports the idea of some more upwards movement from here.
Today I have only two hourly wave counts. The second wave count from yesterday must now be discarded because minuette wave (ii) may not be a double combination; the second structure in the possible double should be a flat, but the possible B wave within it did not meet the minimum requirement of 90% the length of its A wave.
Minuette wave (ii) must be completing as an expanded flat and within it subminuette wave c is unfolding as a time consuming ending diagonal. The alternate looks at the unlikely possibility that minuette wave (ii) is over already.
MAIN HOURLY WAVE COUNT
Click chart to enlarge.
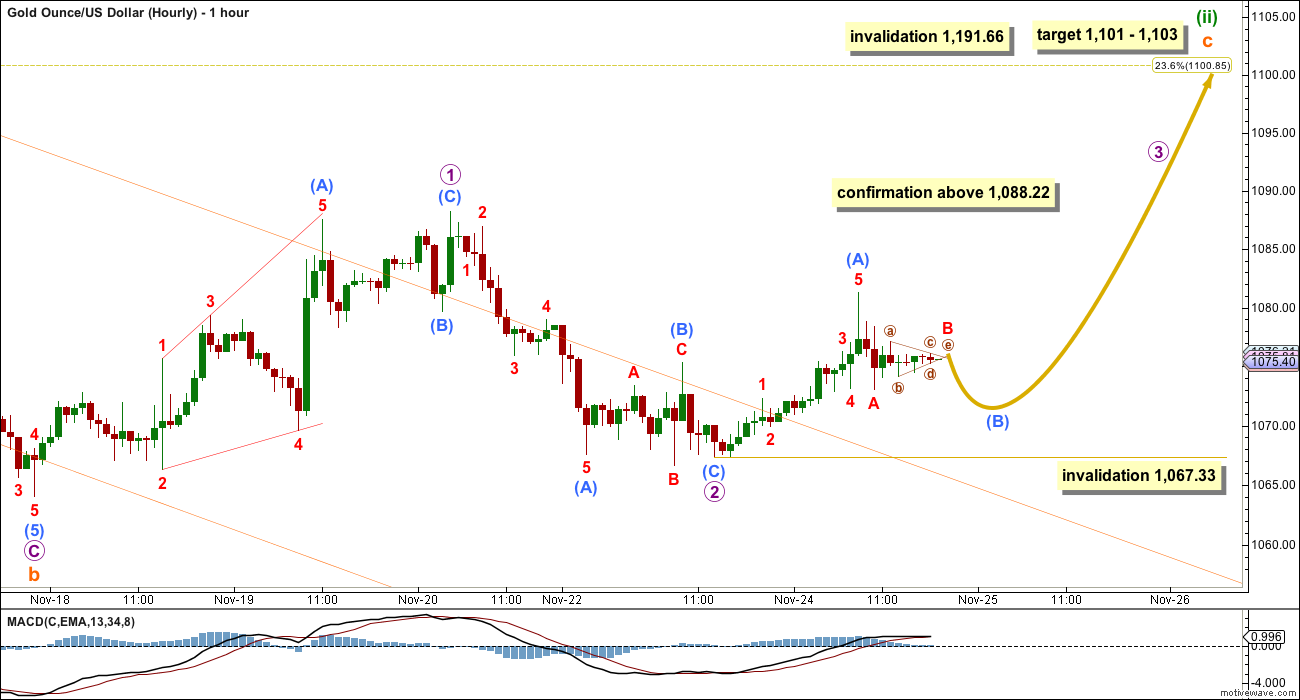
At this stage, there is only one possible structure for minuette wave (ii), an expanded flat correction.
At 1,103 subminuette wave c would reach 1.618 the length of subminuette wave a. This is close to the 0.236 Fibonacci ratio at 1,101.
Subminuette wave c is unfolding as an ending diagonal. The diagonal would most likely be contracting, which is the most common type. Micro wave 3 would reach equality in length with micro wave 1 at 1,091.53. If it ends before this point, the diagonal would be contracting. If it ends above this point, the diagonal should be expanding.
All the sub waves must subdivide as zigzags (double and triple zigzags may take the place of single zigzags) within an ending diagonal. Second and fourth waves are normally deep, and the fourth wave must overlap back into first wave price territory. The third wave must move above the end of the first wave; micro wave 3 must take price above 1,088.22. That would invalidate the alternate below and provide more confidence in this wave count.
Sub micro wave (B) may not move beyond the start of sub micro wave (A) below 1,067.33 within the zigzag of micro wave 3.
Diagonals are choppy and overlapping. This wave count expects now five more days of choppy upwards movement. Give or take one day either side of this expectation would see minuette wave (ii) end close to a Fibonacci thirteen days in total.
ALTERNATE HOURLY WAVE COUNT
Click chart to enlarge.
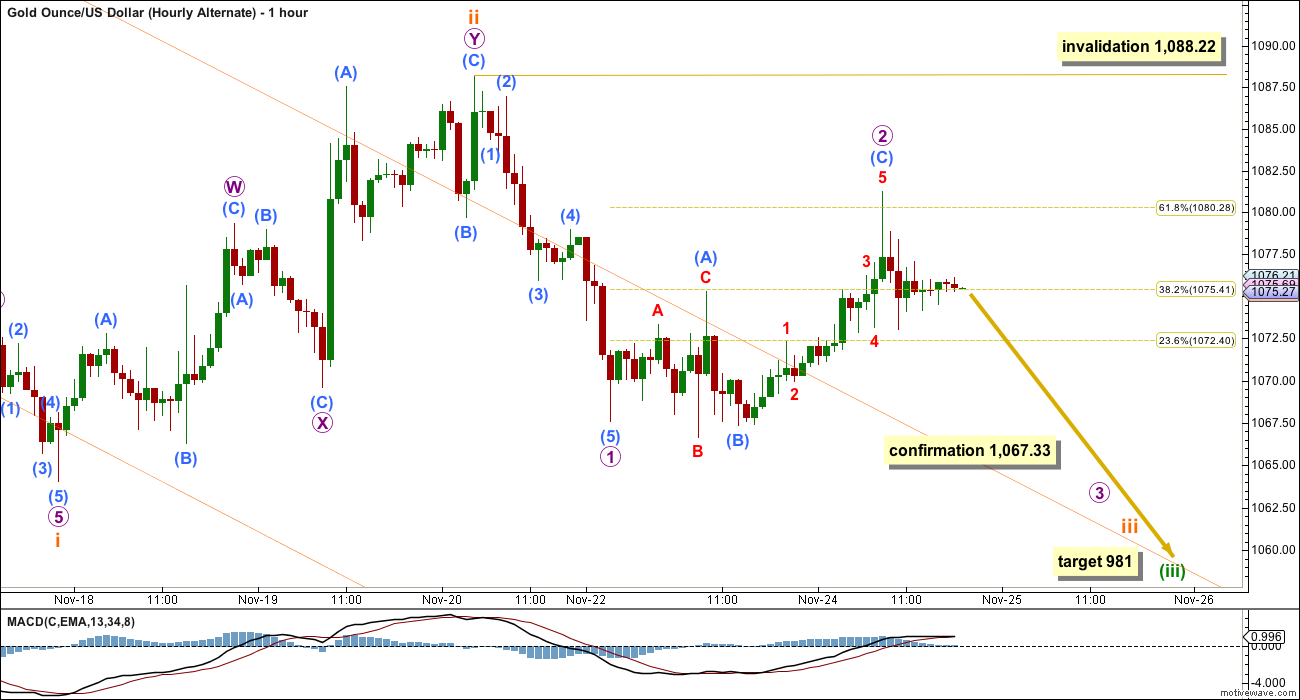
What if minuette wave (ii) was over as a brief shallow zigzag? This is technically possible, but it is extremely unlikely for the following reasons:
1. Minuette wave (ii) would not contain any green candlesticks on the daily chart.
2. Minuette wave (ii) would not have breached the channel which contains minuette wave (i).
3. Subminuette wave ii, one degree lower, has breached the channel containing minuette wave (i).
4. Subminuette wave ii is deep and time consuming in comparison to subminuette wave i.
If micro wave 2 continues any further, then it may not move beyond the start of micro wave 1 above 1,088.22.
At 981 minuette wave (iii) would reach equality in length with minuette wave (i).
ALTERNATE ELLIOTT WAVE COUNT
Click chart to enlarge.
I am aware that this is the wave count which EWI and Danerics have. The implications are important, so I will follow this wave count daily for members here too.
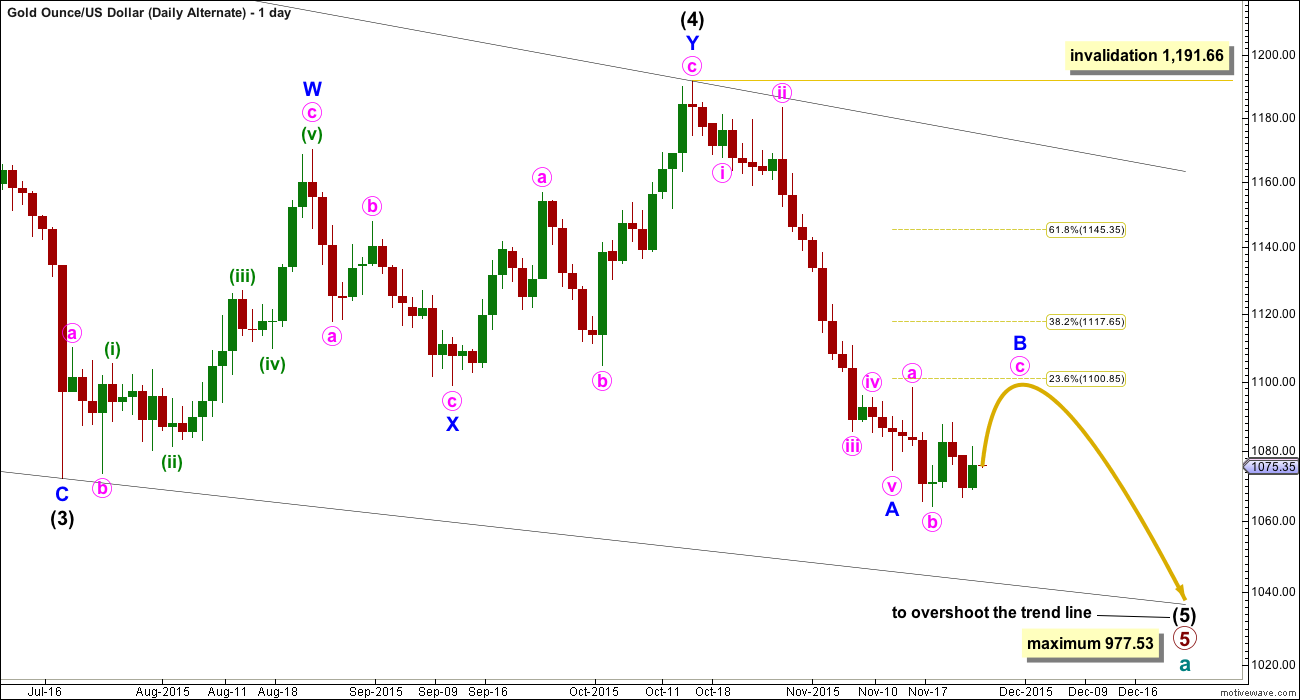
Everything is the same up to the end of the triangle for primary wave 4. Thereafter, primary wave 5 is seen as an ending contracting diagonal.
Within the ending contracting diagonal, it is not possible to see intermediate wave (2) as a zigzag and meet all Elliott wave rules. To see an explanation of why see this video at 10:25.
The same problem exists for the ending diagonal of primary wave 5 itself. Intermediate wave (3) is longer than intermediate wave (1) which would suggest an expanding diagonal, but intermediate wave (4) is shorter than intermediate wave (2) and the trend lines converge which suggests a contracting diagonal.
From “Elliott Wave Principle” by Frost and Prechter, 10th edition, page 88: “In the contracting variety, wave 3 is always shorter than wave 1, wave 4 is always shorter than wave 2, and wave 5 is always shorter than wave 3. In the expanding variety, wave 3 is always longer than wave 1, wave 4 is always longer than wave 2, and wave 5 is always longer than wave 3.”
This structure violates the rules for both a contracting and expanding variety. If the rules in Frost and Prechter are accepted, then this is an invalid wave count.
It may be that the rules need to be rewritten to add “sometimes a third wave may be the longest within a contracting or expanding diagonal”. But I have never seen Robert Prechter publish such a rule, I do not know that it exists.
I cannot reconcile this wave count from EWI with the rules in Frost and Prechter.
If an ending contracting diagonal is unfolding, then the (1) – (3) trend line may be overshot signalling the end of intermediate wave (5). If price behaves thus and turns around and moves strongly higher, then this wave count must be accepted and the rules for diagonals will need to be rewritten.
I will continue to follow this possibility as price moves lower.
Intermediate wave (5) should be shorter than intermediate wave (1). At 977.53 intermediate wave (5) would reach equality in length with intermediate wave (1). A new low below this point would take this possible diagonal structure too far from the rules. At that stage, it really should be finally discarded.
All sub waves within ending diagonals must subdivide as zigzags. Within the zigzag of intermediate wave (5), minor wave B should unfold over several days. At this stage, there is no divergence between this idea and the main Elliott wave count.
Minor wave B may not move beyond the start of minor wave A above 1,191.66.
I am uncomfortable with publishing this wave count and I only do so because it has been published by Elliott Wave International. I am not comfortable with publishing any wave count which violates the rules in Frost and Prechter. However, when looking at primary wave 5 on the weekly chart it does look like a diagonal is unfolding.
Short to mid term there is no divergence in expected direction between this wave count and the main wave count.
TECHNICAL ANALYSIS
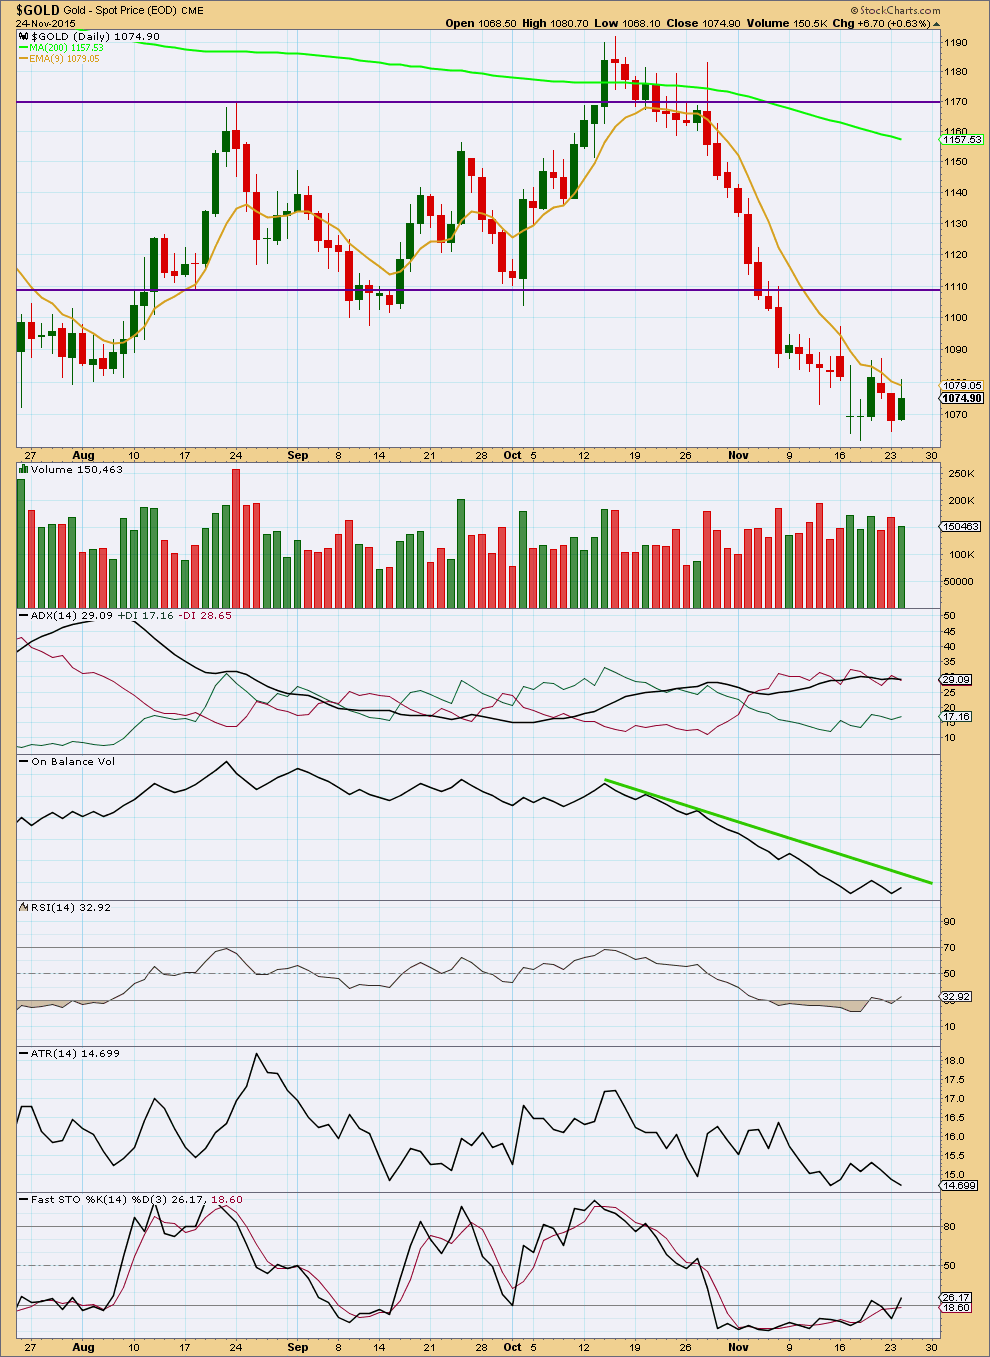
Click chart to enlarge. Chart courtesy of StockCharts.com.
Daily: Price has been drifting sideways in a small range. Overall volume is declining somewhat during the last six days which is typical of a consolidation. The 9 day EMA is so far providing some resistance, but should not be expected to continue to do so if price is consolidating; price can whipsaw about moving averages during a consolidation.
ADX is flattening off and ATR is declining, also indicative of a small consolidation.
Stochastics and RSI are returning from oversold. A little more upwards movement would further resolve these indicators and allow room again for price to fall.
If it gets that far, price should find resistance at the horizontal trend line.
If On Balance Volume comes up to touch its short green trend line, that may assist to show when any further upwards movement in price comes to end.
This consolidation will end; when price breaks above or below the current range on a day with increased volume (particularly for an upwards breakout) then a breakout would be indicated.
With On Balance Volume very bearish and volume on the weekly chart bearish, a downwards breakout looks more likely than upwards.
This analysis is published about 08:01 p.m. EST.
GDX still looks good for a bounce, just taking it’s time to get going. Chart by EagleSeagle.
I’m going to have to revive the idea of a double combination, with the second structure a flat now unfolding.
This means a new low below 1,064.02 is possible and still part of the correction.
Long weekend at the NYSE. Thursday closed and Friday closed at 1:00 pm EST
Gold and Gold Stocks – It Gets Even More Interesting
November 24, 2015 | Author Pater Tenebrarum
http://www.acting-man.com/?p=41568
Nice article. Really enjoyed comparing gold’s price to other currencies, and then the current bear market to the one of the 70’s.
And divergences affirming once again… ” positioning and sentiment are more than ripe for a good rebound”
Thanks for posting.
I’m concerned for the overall look of this ending diagonal; if I leave the labelling as is then the lower 2-4 trend line will look wrong.
I think this is micro 2 moving yet lower. That would leave the diagonal looking right within its trend lines, and it will probably be contracting (so should come to a swifter end than its start).
I’m going to change the hourly chart slightly to this. The invalidation point has to be moved back down to 1,064.02.
Next I’m going to look at alternate ideas which see subminuette b continuing further. Too many times I’ve been confused by market movement, and been adjusting the wave count too many times, only for it to turn out to be a B wave. This may be what’s happening again, and would explain the horrible choppiness of the last few days.
Thank you Lara for the update.
Once again you and I were typing at the same time. This time I caught it. 🙂
If Gold price can get there, I would look for sell short signals at 1075, 1079-81…
One More Lower Low? – Avi Gilburt EW
Wednesday, 25 November 2015
First published Sat Nov 21 for members
http://news.goldseek.com/GoldSeek/1448461200.php
Watch this clip Must!!!! No stops accepted from Feb 2016?????
Oscar Carboni Rants About No Stops
https://www.youtube.com/watch?list=UUez8uA1o_fDYsrSf4auWSjg&v=a6kHmFHC9V0
I can’t watch that video this early in my morning. I’ll be looking for links to text explaining about the new “no stops” rule.
I still cannot believe that regulators are actually that clueless that they’ll do that! Can it be so?
Okay; watched a few mins. Yes. I do tend to agree with him.
I suspect that volume will reduce after Feb 26th next year.
I wonder if that affects my British FXCM account?
I guess I’ll be restricted mostly to currencies. Oh well.
Still having a hard time getting my head around a ban on stop loss orders.
I think this will have the effect of removing many players from the market. Large institutions can employ people to watch constantly, the others can’t do that. We need to sleep and have lives.
I’m wondering why. Who benefits? How? The losers will be smaller players I think. So the winners will be…?
Lara thinks the correction is very likely not over.
I’m looking to buy either DUST or NUGT just for today since basically a long weekend as NYSE closed Thursday and closed Friday at 1 pm due to US Thanksgiving.
However gold is uncomfortably close to invalidation point of 1067.33 as it came within .70 at 1068.03 at 10:04 am EST.
Gold weakens after U.S. data maintains rate-hike expectations
http://www.marketwatch.com/story/gold-weakens-after-us-data-maintains-rate-hike-expectations-2015-11-25
US news also sounds bearish gold again.
Gold at another potential turning point?
I think that 1068.03 may have been the low for submicro wave (B) of micro wave 3.
Any wave counts?
Lara congratulations !!!!! Now you can relax and enjoy what you like to do. No more exam is a great relief. I am very happy for you. You are the best in this space.
Lara I was out of town at a funeral Tuesday and missed your great news that you passed your level III CMT exam and no more exams and in the final process of obtaining CMT.
I’m very happy for you. Way a go on your dedicated studying efforts going very well for you and your subscribers. CMT is great credentials and professionalism to add to your web page.
Thank you Richard, and Papudi.
I am greatly relieved and looking forward to a happy Christmas and holiday 🙂