
An inside day with light volume fits the Elliott wave count.
Summary: It is still most likely that a correction is continuing, but again the structure is unclear. I am expecting slow choppy overlapping movement for a further four days which may end about 1,101 – 1,103. Short term a new high above 1,073.04 would indicate an upwards swing within this consolidation.
New updates to this analysis are in bold.
To see weekly charts and the difference between the two wave counts go here.
MAIN ELLIOTT WAVE COUNT
Click chart to enlarge.
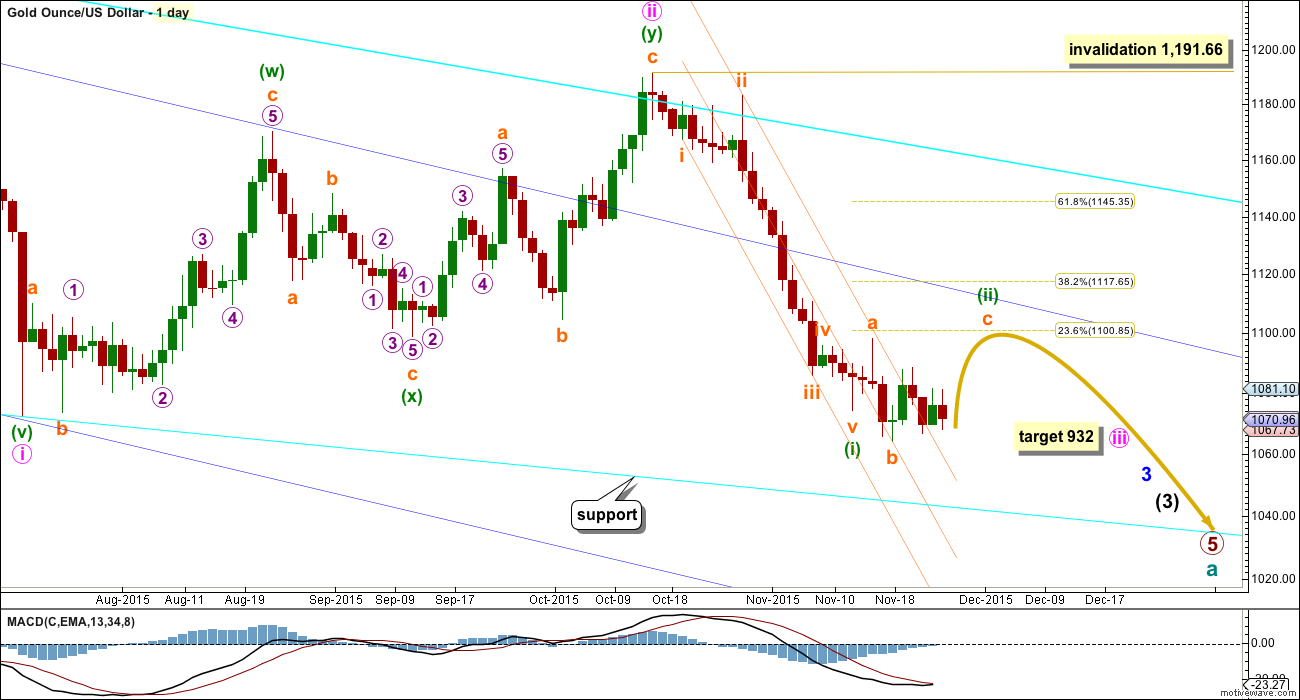
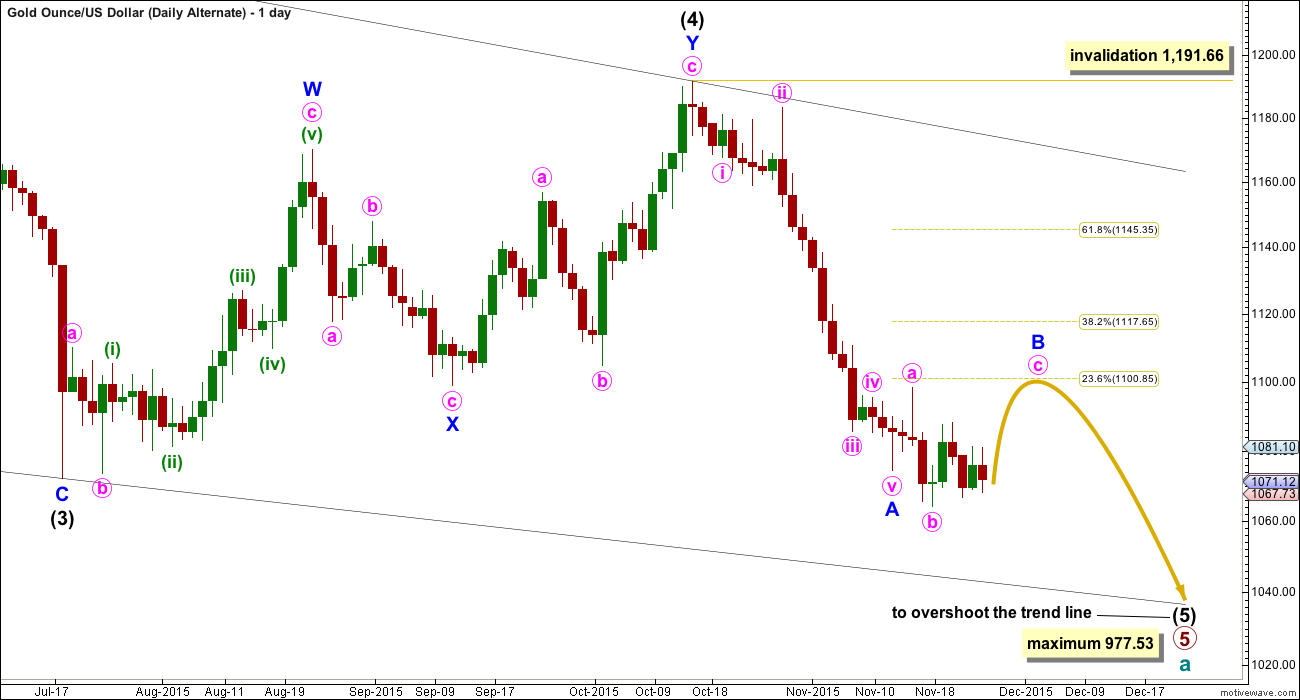
Gold has been in a bear market since September 2011. There has not yet been confirmation of a change from bear to bull, and so at this stage any bull wave count would be trying to pick a low which is not advised. Price remains below the 200 day moving average and below the blue trend line (copied over from the weekly chart). The bear market should be expected to be intact until we have technical confirmation of a big trend change.
The final line of resistance (cyan line copied over from weekly charts) is only overshot and not so far properly breached. While this line is not breached the bear wave count will remain possible. Simple is best, and the simplest method to confirm a trend change is a trend line.
Minute wave ii is a complete double zigzag and deep at 0.75 the length of minute wave i. It has breached the dark blue base channel drawn about minor waves 1 and 2, one degree higher. When a lower degree second wave correction does this it reduces the probability of the wave count but does not invalidate it. Base channels most often work to show where following corrections find support or resistance, but not always.
At 932 minute wave iii would reach 1.618 the length of minute wave i.
Draw a channel about this downwards movement using Elliott’s first technique: draw the first trend line from the end of minuette wave (i) to minuette wave (iii), then place a parallel copy on the high of minuette wave (ii).
Minuette wave (ii) is showing up on the daily chart and so far has lasted eight days. It may now complete in a total Fibonacci thirteen days, so a further four days of choppy overlapping upwards movement is expected.
This may resolve RSI being oversold.
Using FXCM data there is a morning doji star at the last low. This supports the idea of some more upwards movement from here.
Today I have two hourly wave counts looking at minuette wave (ii) as two possible structures: an expanded flat (first hourly chart) or a combination (second hourly chart). A combination is again possible.
The third hourly chart is again presented as an outside possibility which has a very low probability.
FIRST HOURLY WAVE COUNT
Click chart to enlarge.
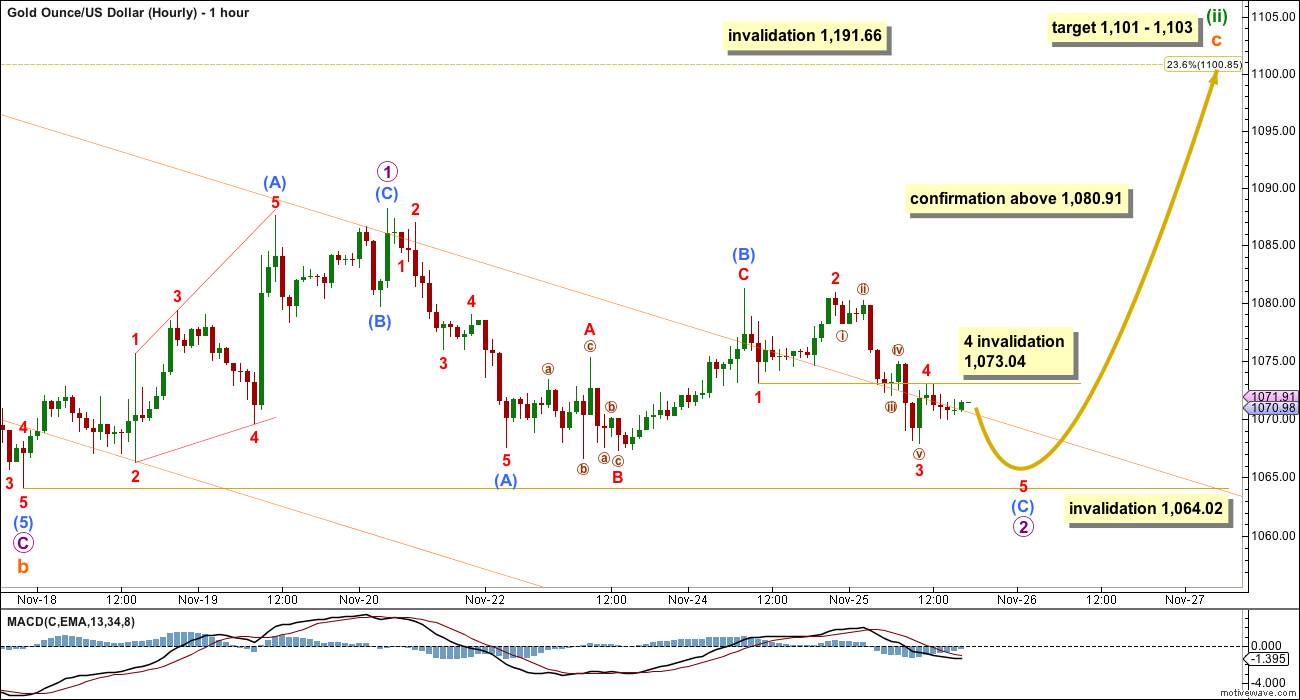
If minuette wave (ii) is an expanded flat correction, then subminuette wave c within it is unfolding as an ending diagonal.
All the sub waves must subdivide as zigzags within an ending diagonal. Micro wave 2 is an almost complete zigzag. Micro wave 2 may not move beyond the start of micro wave 1 below 1,064.02. If this first hourly wave count is invalidated, then the second hourly wave count will be the sole structure for minuette wave (ii).
The final fifth wave of minuscule wave 5 is required to complete the five wave structure within submicro wave (C). Minuscule wave 4 may be continuing sideways as a triangle and may not move into minuscule wave 1 price territory above 1,073.04.
Short term a new high above 1,073.04 would indicate an end to this current downwards swing. At that stage, upwards movement may not be a fourth wave correction within an impulse unfolding downwards, so the downwards wave must be over. Even if a new low for the end of minuscule wave 5 is not seen first, a new high above 1,064.02 would still indicate a trend change for the short term.
Micro wave 3 must subdivide as a zigzag and must move above the end of micro wave 1 at 1,088.22.
At 1,103 subminuette wave c would reach 1.618 the length of subminuette wave a. This is close to the 0.236 Fibonacci ratio at 1,101.
A new high above 1,080.91 would now invalidate the third wave count and provide confidence that Gold remains within a correction.
Minuette wave (ii) may not move beyond the start of minuette wave (i) above 1,191.66.
SECOND HOURLY WAVE COUNT
Click chart to enlarge.
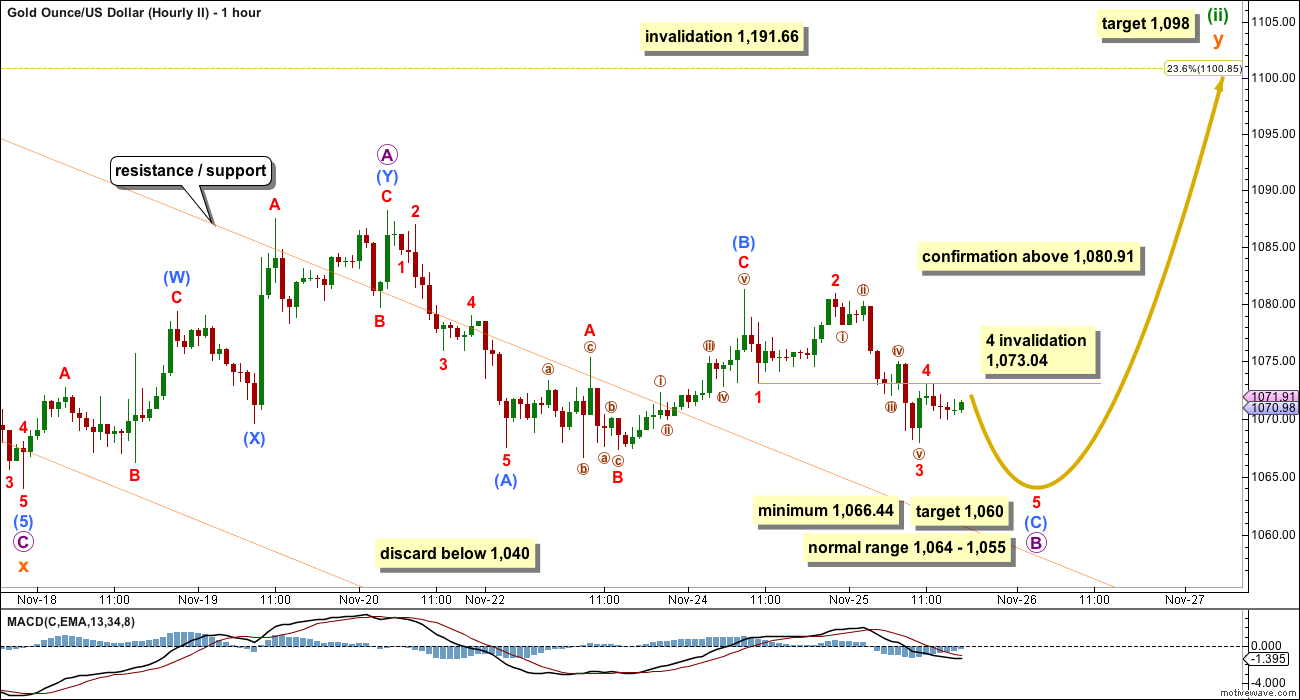
It is again possible that minuette wave (ii) is unfolding as a double combination.
The first structure in the double (off to the left of this chart now) was a zigzag labelled subminuette wave w.
The double is joined by a three in the opposite direction, a zigzag labelled subminuette wave x.
The second structure in the double would be extremely likely to be a flat correction, but it may also be a triangle. It may not be a zigzag; double zigzags normally have quick shallow X waves and this X wave is far too deep.
Within the flat correction labelled subminuette wave y, micro wave B must retrace a minimum 90% of micro wave A at 1,066.44.
The most common length for a B wave within a flat is between 1 to 1.38 times the length of the A wave. This gives a range for micro wave B from 1,064 – 1,055.
At 1,060 submicro wave (B) would reach equality in length with submicro wave (A).
Subminuette wave y should end about the same level as subminuette wave w at 1,098, so that the whole structure moves sideways. Combinations should have a sideways trend to them.
Micro wave B would reach twice the length of micro wave A at 1,040. At that point, the probability that a flat correction is unfolding would be so low it should be discarded. Only at that point should the third wave count be considered.
THIRD HOURLY WAVE COUNT
Click chart to enlarge.
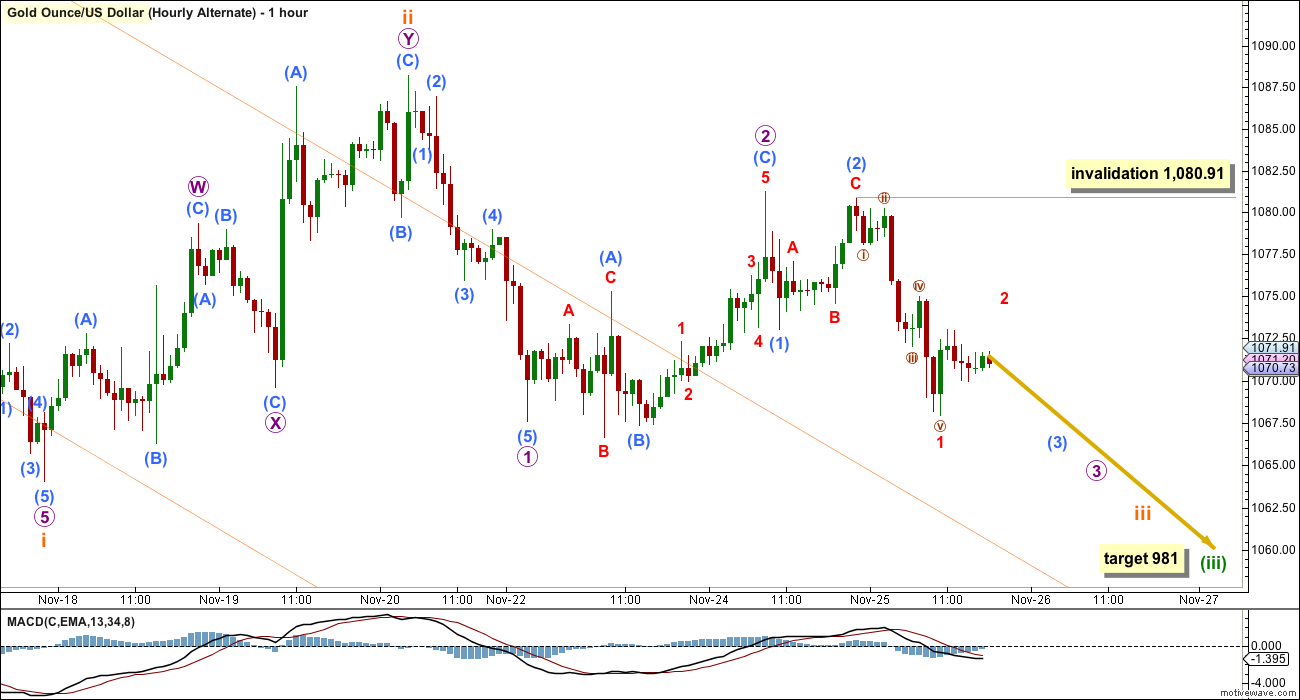
What if minuette wave (ii) was over as a brief shallow zigzag? This is technically possible, but it is extremely unlikely for the following reasons:
1. Minuette wave (ii) would not contain any green candlesticks on the daily chart.
2. Minuette wave (ii) would not have breached the channel which contains minuette wave (i).
3. Subminuette wave ii, one degree lower, has breached the channel containing minuette wave (i).
4. Subminuette wave ii is deep and time consuming in comparison to subminuette wave i.
Minuscule wave 2 may not move beyond the start of minuscule wave 1 above 1,080.91.
At 981 minuette wave (iii) would reach equality in length with minuette wave (i).
ALTERNATE ELLIOTT WAVE COUNT
Click chart to enlarge.
I am aware that this is the wave count which EWI and Danerics have. The implications are important, so I will follow this wave count daily for members here too.
Everything is the same up to the end of the triangle for primary wave 4. Thereafter, primary wave 5 is seen as an ending contracting diagonal.
Within the ending contracting diagonal, it is not possible to see intermediate wave (2) as a zigzag and meet all Elliott wave rules. To see an explanation of why see this video at 10:25.
The same problem exists for the ending diagonal of primary wave 5 itself. Intermediate wave (3) is longer than intermediate wave (1) which would suggest an expanding diagonal, but intermediate wave (4) is shorter than intermediate wave (2) and the trend lines converge which suggests a contracting diagonal.
From “Elliott Wave Principle” by Frost and Prechter, 10th edition, page 88: “In the contracting variety, wave 3 is always shorter than wave 1, wave 4 is always shorter than wave 2, and wave 5 is always shorter than wave 3. In the expanding variety, wave 3 is always longer than wave 1, wave 4 is always longer than wave 2, and wave 5 is always longer than wave 3.”
This structure violates the rules for both a contracting and expanding variety. If the rules in Frost and Prechter are accepted, then this is an invalid wave count.
It may be that the rules need to be rewritten to add “sometimes a third wave may be the longest within a contracting or expanding diagonal”. But I have never seen Robert Prechter publish such a rule, I do not know that it exists.
I cannot reconcile this wave count from EWI with the rules in Frost and Prechter.
If an ending contracting diagonal is unfolding, then the (1) – (3) trend line may be overshot signalling the end of intermediate wave (5). If price behaves thus and turns around and moves strongly higher, then this wave count must be accepted and the rules for diagonals will need to be rewritten.
I will continue to follow this possibility as price moves lower.
Intermediate wave (5) should be shorter than intermediate wave (1). At 977.53 intermediate wave (5) would reach equality in length with intermediate wave (1). A new low below this point would take this possible diagonal structure too far from the rules. At that stage, it really should be finally discarded.
All sub waves within ending diagonals must subdivide as zigzags. Within the zigzag of intermediate wave (5), minor wave B should unfold over several days. At this stage, there is no divergence between this idea and the main Elliott wave count.
Minor wave B may not move beyond the start of minor wave A above 1,191.66.
I am uncomfortable with publishing this wave count and I only do so because it has been published by Elliott Wave International. I am not comfortable with publishing any wave count which violates the rules in Frost and Prechter. However, when looking at primary wave 5 on the weekly chart it does look like a diagonal is unfolding.
Short to mid term there is no divergence in expected direction between this wave count and the main wave count.
TECHNICAL ANALYSIS
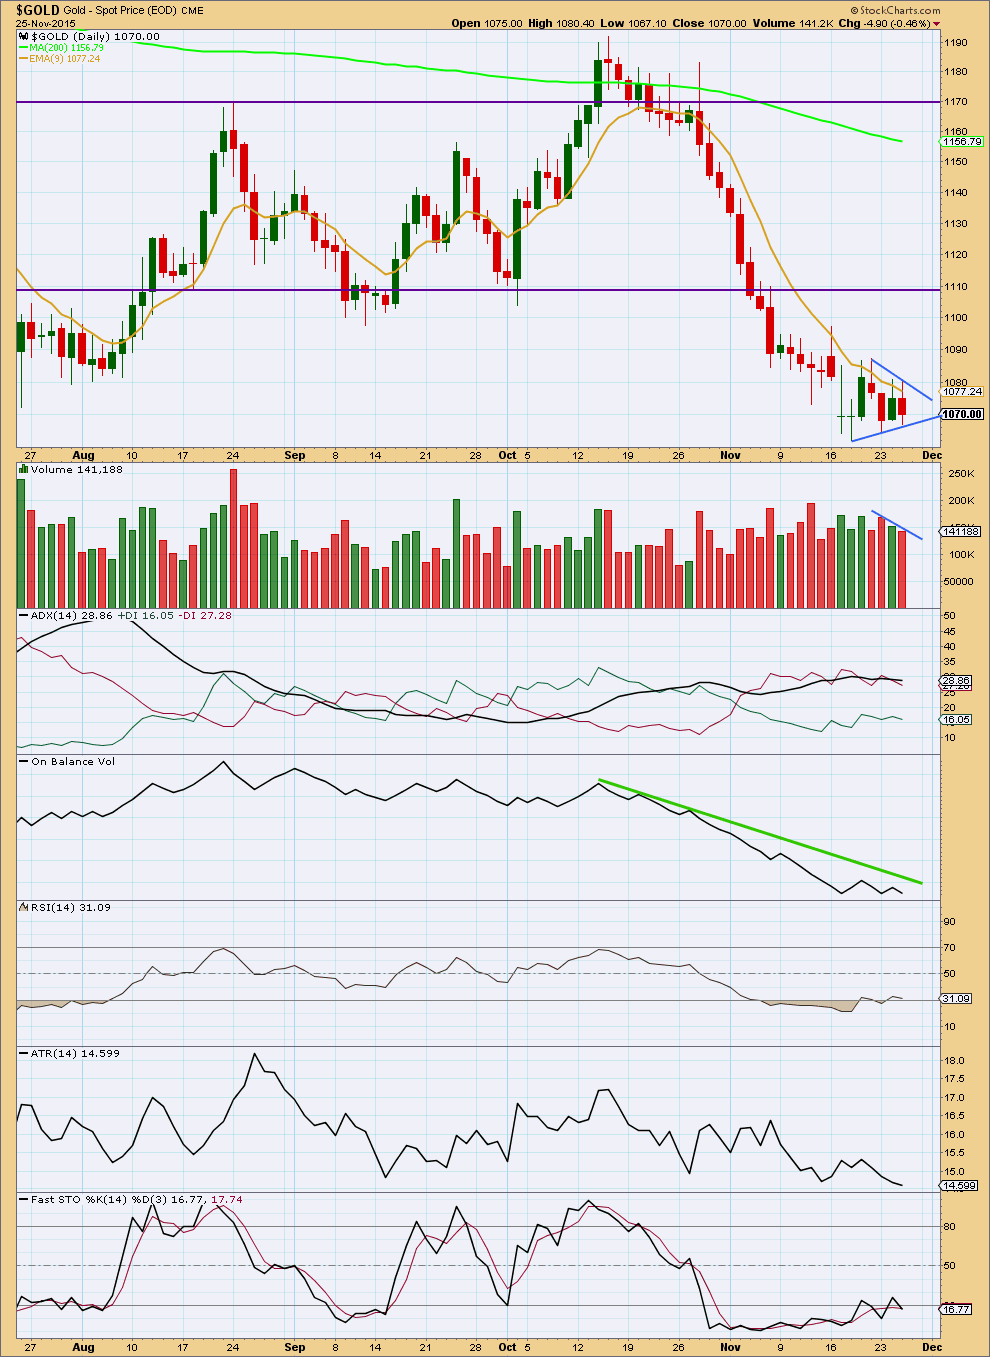
Click chart to enlarge. Chart courtesy of StockCharts.com.
Daily: A small triangle is forming. These are fairly reliable continuation patterns. This one is accompanied by declining volume which supports the pattern.
ADX is flattening off indicating no clear trend at this stage. ATR agrees as it is declining.
On Balance Volume remains below its green trend line and may find resistance again there, if we see an upwards day.
A breakout of the triangle would be indicated with a strong movement above or below the small blue trend lines. It should come on a day with an increase in volume for a breakout to be confirmed.
This correction is slowly resolving RSI being oversold.
This analysis is published about 06:50 p.m. EST.
Alessandro’s got it.
Today I’m going to publish a main wave count which sees this current sideways move as subminuette wave b as a triangle.
I’ll be labelling it as a nine wave triangle though, slightly different to Alessandro’s idea just below.
Invalidation point 1,066.63.
More sideways movement while the US markets are closed for Thanksgiving. And then an upwards breakout, which may be swift and sharp.
Target still above 1,098.25 so that C moves above A and avoids a truncation.
what you thing about this count ?
Exactly.
I’ve just finished with charts and come over to comments… and your chart is almost exactly what I’ve been working on 🙂
Lara:
In Nov 25th report you show FTSE daily chart with two red candles. It appears you are using the two days old chart. My chart has two white (green) candles.
The last candlestick on my FTSE daily chart is for 24th November, because it was published 25th Nov early NY time.
Yes, there are two green candlesticks now.
Which I think came after I published the FTSE analysis
Last time when Gold COT was bullish at the bottom side way trading lasted for 13 days and then price moved up. Yesterday was the 13 th day at the bottom and gold cot is bullish. will wait for the new COT data tomorrow. If it is bullish expect gold to move to Lara’s target next week. That seems to be the plan.
Will history repeat again? Chart by Mr Dirivatives
… at this stage, with 1074-75 and above that 1079-80 curtailing, all it takes is a break below 1071 to target 1065-60…. Lets see how this plays out~!
Hi Lara,
Is there any possibility of an ending diagonal forming from the high of 1097…if this is the case we are in 3rd diagonal of wave 5….Interesting to see your reply…
It would work I guess…. I’ll chart it and take a closer look.
If the fourth wave of subminuette iv ends at 1,098 then it doesn’t subdivide well. It would technically be a double zigzag, but the X wave within it would make a new low below the first zigzag in the double. That’s not normal.
The final fifth wave ending diagonal wouldn’t sit within the channel drawn using either of Elliott’s techniques. A breach of the upper edge is confirmation that minuette wave (i) was over.
You could make this idea fit, but it looks all wrong. On that basis I’m not going to seriously consider it any further.
A new high above 1,073.04 before making a new low below Miniscule wave 3 has invalidated the 1st two hourly counts. New hourly counts are needed to keep the short term bullish target of around 1,100 alive. If we now go down below 1,064.02 before moving up above 1,080.91, then the bear may be in control. Gold isn’t making this easy…..
Yes Agree. New wave counts for hourly is in order. Any suggestions!!!!
Hi Lara
Have been giving some (amateur) thought to the EWI count of Primary 5 being an ending diagonal.
What if Primary 4 is a running flat ending at the March 2014 high instead of July 2014 end of triangle? This would make Intermediate 1 in primary 5 longer than Intermediate 3.
Apart from your Intermediate 2 of 5 issue, the only other problem I can see is Intermediate B of 4 is slightly shorter than A. Any merit?
Technically primary 4 wouldn’t be a running flat because within it intermediate (B) does not make a new price extreme beyond the start of intermediate (A) and so it would be a regular flat with a truncated C wave
But I think this idea has an exceptionally low probability for these reasons:
– primary 2 was a flat, so primary 4 is most likely to exhibit alternation, not to be a flat as well
– there is still the problem as you point out within intermediate (2) of the ending diagonal, it does not meet all EW rules to fit as a zigzag.
– it’s ignoring a rather obvious triangle for primary 4
– within primary wave 4 flat correction the C wave would be hugely truncated, by 41.53. That’s massive, an exceptionally low probability on that problem alone