
An upwards breakout of a triangle was expected.
Price broke out downwards, which was confirmed with a new low below 1,066.63.
The Elliot wave count has changed.
Summary: An impulse downwards is most likely complete. A correction upwards should unfold next week. The target is at 1,104.
New updates to this analysis are in bold.
To see weekly charts and the difference between the two wave counts go here.
MAIN ELLIOTT WAVE COUNT
Click chart to enlarge.
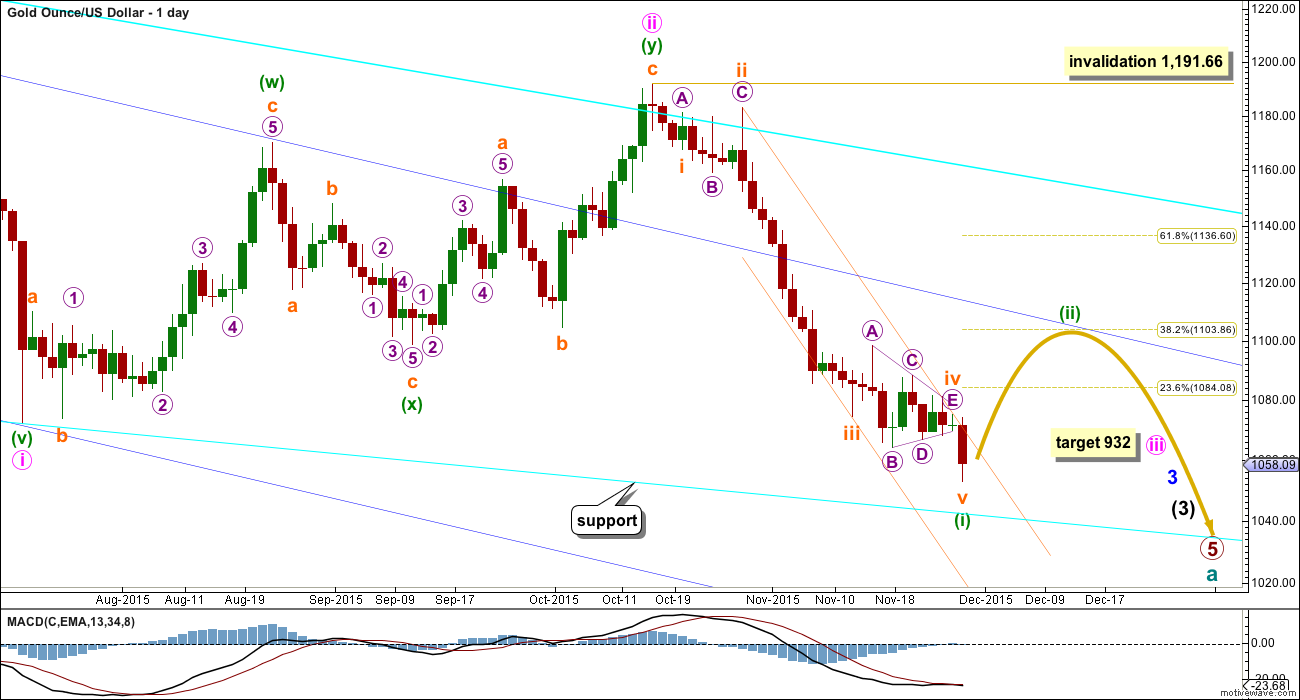
Gold has been in a bear market since September 2011. There has not yet been confirmation of a change from bear to bull, and so at this stage any bull wave count would be trying to pick a low which is not advised. Price remains below the 200 day moving average and below the blue trend line (copied over from the weekly chart). The bear market should be expected to be intact until we have technical confirmation of a big trend change.
The final line of resistance (cyan line copied over from weekly charts) is only overshot and not so far properly breached. While this line is not breached the bear wave count will remain possible. Simple is best, and the simplest method to confirm a trend change is a trend line.
Minute wave ii is a complete double zigzag and deep at 0.75 the length of minute wave i. It has breached the dark blue base channel drawn about minor waves 1 and 2, one degree higher. When a lower degree second wave correction does this it reduces the probability of the wave count but does not invalidate it. Base channels most often work to show where following corrections find support or resistance, but not always.
At 932 minute wave iii would reach 1.618 the length of minute wave i.
Minuette wave (i) may have ended on Friday. Ratios within minuette wave (i) are: subminuette wave iii is 6.48 longer than 4.236 the length of subminuette wave i, and subminuette wave v is 2.03 short of equality in length with subminuette wave i. If subminuette wave v continues any lower at the beginning of next week, then it may end at 1,050.82 where it would reach equality in length with subminuette wave i.
Minuette wave (ii) may find resistance at the upper dark blue trend line. This may see it end about the 0.382 Fibonacci ratio of minuette wave (i) at 1,104.
Draw a channel about minuette wave (i) using Elliott’s second technique: draw the first trend line from the ends of subminuette waves ii to iv, then place a parallel copy on the end of subminuette wave iii. When price breaks above the upper edge of this channel it should confirm a trend change. Copy the channel over to the hourly chart.
Click chart to enlarge.
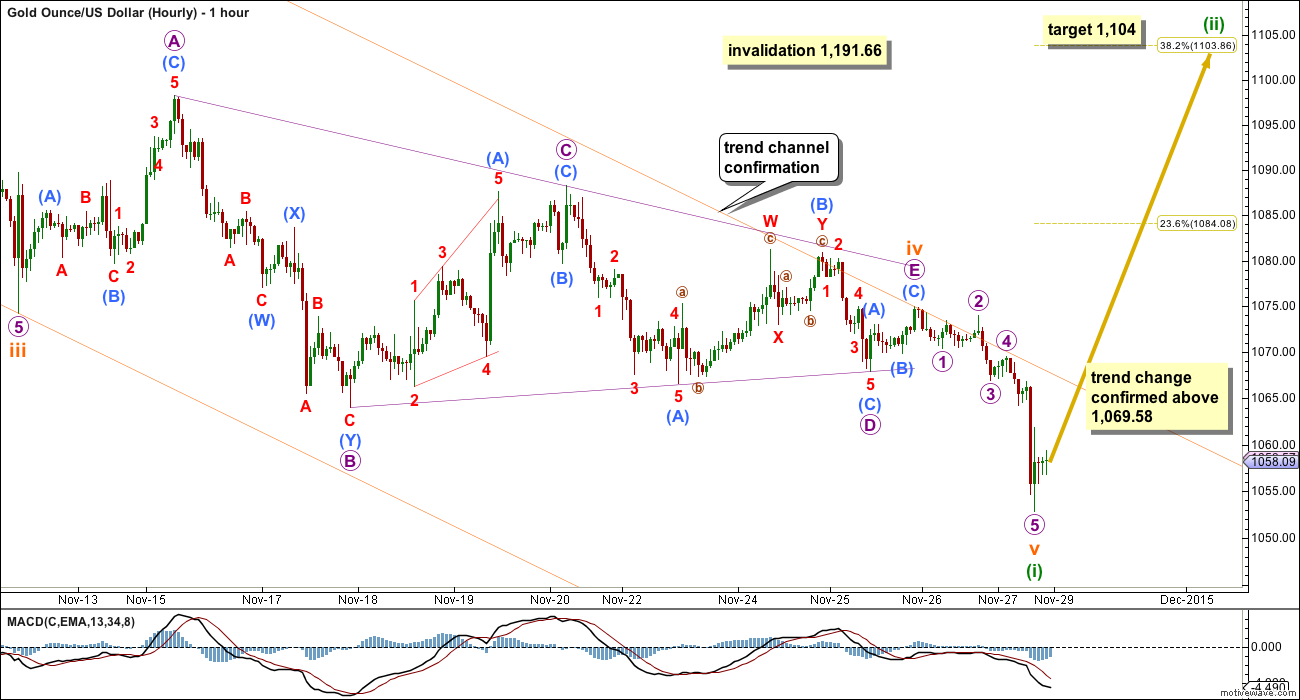
The wave count is changed to see the triangle as subminuette wave iv, a running contracting triangle.
All five triangle sub waves subdivide as threes, with micro wave B a double zigzag. The triangle trend lines fit perfectly.
Subminuette wave v may be over. The final wave within it for micro wave 5 will subdivide perfectly on the five minute chart as an impulse.
A new high above 1,069.58 may not be a second wave correction within micro wave 5, so at that stage micro wave 5 would be confirmed as over.
Minuette wave (i) lasted 31 days, three short of a Fibonacci 34. Minuette wave (ii) may be expected to last a Fibonacci 13 or 21 days.
ALTERNATE ELLIOTT WAVE COUNT
Click chart to enlarge.
I am aware that this is the wave count which EWI and Danerics have. The implications are important, so I will follow this wave count daily for members here too.
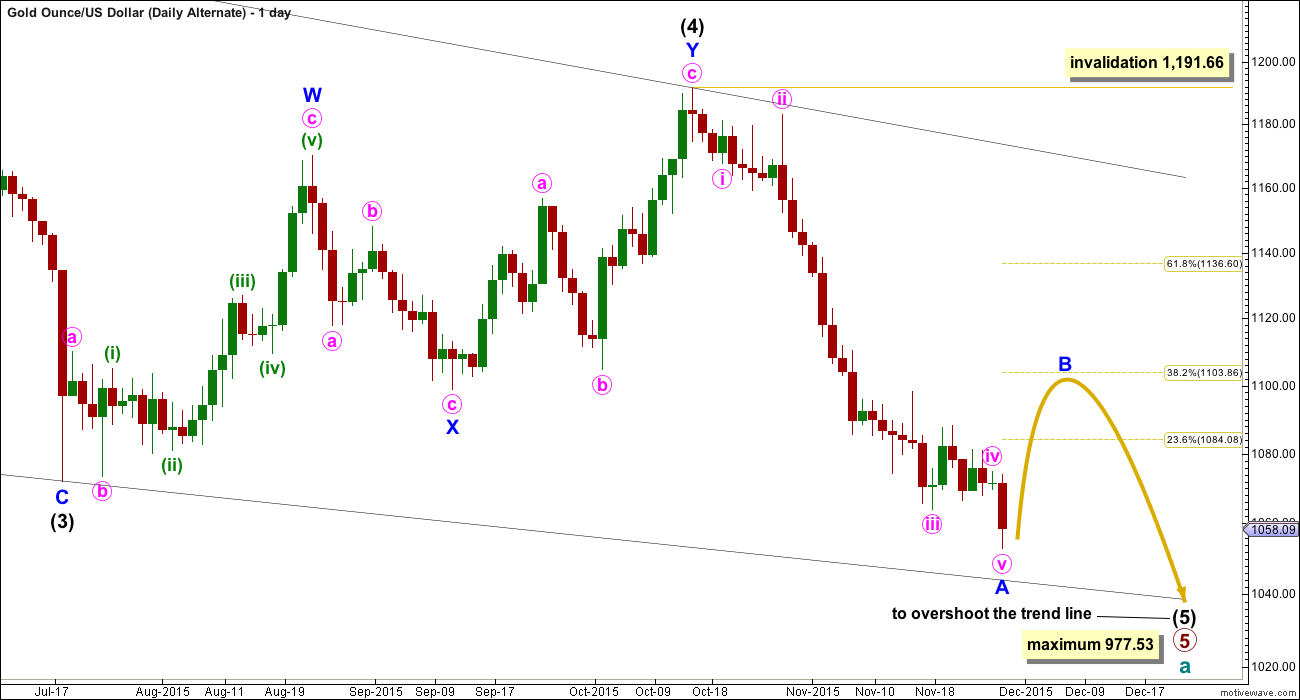
Everything is the same up to the end of the triangle for primary wave 4. Thereafter, primary wave 5 is seen as an ending contracting diagonal.
Within the ending contracting diagonal, it is not possible to see intermediate wave (2) as a zigzag and meet all Elliott wave rules. To see an explanation of why see this video at 10:25.
The same problem exists for the ending diagonal of primary wave 5 itself. Intermediate wave (3) is longer than intermediate wave (1) which would suggest an expanding diagonal, but intermediate wave (4) is shorter than intermediate wave (2) and the trend lines converge which suggests a contracting diagonal.
From “Elliott Wave Principle” by Frost and Prechter, 10th edition, page 88: “In the contracting variety, wave 3 is always shorter than wave 1, wave 4 is always shorter than wave 2, and wave 5 is always shorter than wave 3. In the expanding variety, wave 3 is always longer than wave 1, wave 4 is always longer than wave 2, and wave 5 is always longer than wave 3.”
This structure violates the rules for both a contracting and expanding variety. If the rules in Frost and Prechter are accepted, then this is an invalid wave count.
It may be that the rules need to be rewritten to add “sometimes a third wave may be the longest within a contracting or expanding diagonal”. But I have never seen Robert Prechter publish such a rule, I do not know that it exists.
I cannot reconcile this wave count from EWI with the rules in Frost and Prechter.
If an ending contracting diagonal is unfolding, then the (1) – (3) trend line may be overshot signalling the end of intermediate wave (5). If price behaves thus and turns around and moves strongly higher, then this wave count must be accepted and the rules for diagonals will need to be rewritten.
I will continue to follow this possibility as price moves lower.
Intermediate wave (5) should be shorter than intermediate wave (1). At 977.53 intermediate wave (5) would reach equality in length with intermediate wave (1). A new low below this point would take this possible diagonal structure too far from the rules. At that stage, it really should be finally discarded.
All sub waves within ending diagonals must subdivide as zigzags. Within the zigzag of intermediate wave (5), minor wave B should unfold over several days. At this stage, there is no divergence between this idea and the main Elliott wave count.
Minor wave B may not move beyond the start of minor wave A above 1,191.66.
I am uncomfortable with publishing this wave count and I only do so because it has been published by Elliott Wave International. I am not comfortable with publishing any wave count which violates the rules in Frost and Prechter. However, when looking at primary wave 5 on the weekly chart it does look like a diagonal is unfolding.
Short to mid term there is no divergence in expected direction between this wave count and the main wave count.
TECHNICAL ANALYSIS
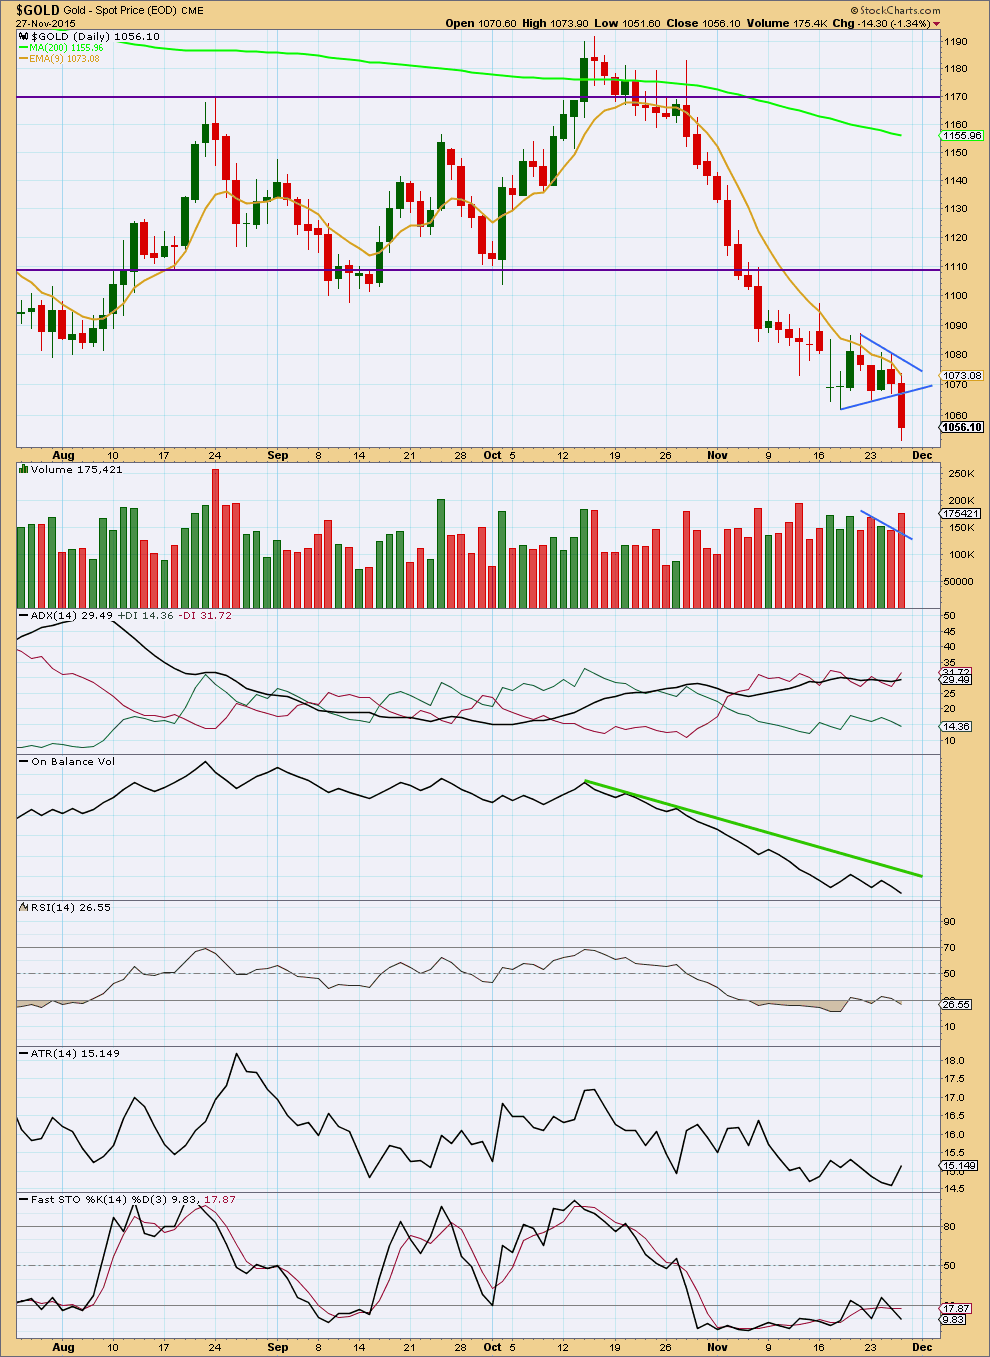
Click chart to enlarge. Chart courtesy of StockCharts.com.
A strong downwards day on high volume indicates a downwards breakout out of the triangle. The widest part of the triangle is 25.2, so a target for movement out of the triangle would be 25.2 below the point at which price broke below the lower triangle trend line. This gives a target calculation of 1,042. If price continues lower when markets open next week, then downwards movement may end about 1,042.
Gold often exhibits a volume spike at the end of its trends. This may be what has happened on Friday. Movement back above the lower triangle trend line would indicate that downwards movement is over.
ADX still indicates a downwards trend is in place. ATR agrees for the last two days; it is increasing.
RSI now shows bullish divergence between the low on Friday and the prior swing low on 18th November. This supports the Elliott wave count which now expects an upwards correction to begin here.
This analysis is published about 011:22 p.m. EST.
No new low and a green daily candlestick – exactly as the new wave count expected.
As Richard notes below we have price and trend channel confirmation that a correction has begun.
The trick now is to manage the various possible structures that this second wave correction may be, and to figure out when it’s over. I’ll expect it may have a Fibonacci duration. With the first wave lasting 31 days (3<34) this second wave may be 13 or 21. At this early stage I'd expect 13 as more likely.
It may be more brief and shallow than a second wave may otherwise be due to a strong downwards pull of the middle of a big third wave. At least, that should be the expectation if the main wave count is correct.
When / if we get a full daily candlestick above the channel that contains the first wave then I would have very strong confidence that Gold has entered a correction against the trend.
It's most likely to be a zigzag, so in the first instance I'll look for a five up on the hourly chart. I think it just finished a third wave, so now a fourth then a fifth.... the fourth may not move into first price territory which I would have at 1,059.35. That will be the short term invalidation point for the main hourly chart today.
Short term... looks like the trend is up... but this is a correction against a larger trend. Trading corrections is very risky, it's essential to manage risk well, to use stops and reduce position size to manage losses. Losses are much more likely during corrections.
2:06 pm EST we just got gold price confirmation above 1,069.58 when gold hit high of 1,069.63. At 2:07 pm gold topped at 1,069.84.
Now we have both trend channel and price confirmation that the micro wave 5 down is confirmed as over.
Unless Lara changes the wave count yes the current hourly wave count is confirmed per her guidelines.
I won’t be changing it today.
But I will consider having alternate hourly wave counts to manage the different possible structures for this second wave correction.
Lara, (1) are any structures available to this correction that could make new lows below the 1052/1053 area and (2) is there a way to determine how low? This would help trading decisions.
It looks now to me on the 1-hr that gold will start going back down without giving price confirmation which is why I ask.
Gold already gave price confirmation above 1,069.58 when gold hit high of 1,069.63 at 2:06 pm EST.
yes, my mistake. I was zigging when I meant to zag
and Oh, this IS good news. Yippy!
1. Yes – an expanded flat or a combination may include new lows.
2. No. But I can provide a range which would be the most common expectation for a B wave. I can provide a price point beyond which the probability is so low the idea should be discarded.
We have price confirmation that a correction has begun. But it’s impossible to determine at this early stage what structure it will be.
Thanks Lara for your response, appreciate the info.
WE HAVE PRICE CONFIRMATION… YEAH!
Gold is trading above the trend channel (pink). ????
Now gold needs to trade above 1069.88 for confirmation.
Yes there is now at least one hourly candlestick above the upper Orange hourly trend channel so there is now trend channel confirmation. Now we just need price confirmation above 1,069.58 for both channel and price confirmation.
“A new high above 1,069.58 may not be a second wave correction within micro wave 5, so at that stage micro wave 5 down would be confirmed as over.”
Thanks Richard for confirming the price point. At 1100 buying DUST/shorting miners.
Technical Trading: Gold Traders, Time To Develop Your Trading Plan
Monday November 30, 2015 09:35
http://www.kitco.com/news/2015-11-30/Technical-Trading-Gold-Traders-Time-To-Develop-Your-Trading-Plan.html
GDX – Possible diamond bottom pattern. 69% chance of upward breakout. Chart by ThirdEyeOpenTrades.
Lara please clarify between 1,050.82 or 1,042 as the target if price moves lower at the beginning of this week. You mention after the main daily, “If subminuette wave v continues any lower at the beginning of next week, then it may end at 1,050.82 where it would reach equality in length with subminuette wave i.” You mention after the Technical analysis, “If price continues lower when markets open next week, then downwards movement may end about 1,042.”
Lara the end of your video did clarify that if price continues lower at the beginning of the week that it may end at either 1,050.82 or 1,042.
The first target is her EW target and the second is based on technical analysis.
^This.
Thanks Dreamer!
Gold Seasonality was inverse in November. Seasonality expected November to be up, but it was a down month. I think we can expect December to be inverse also. Gold will likely be up for the first two weeks of December, then down into year end for tax loss selling.
Alternate current Elliott wave from Goldtent site by Pedro…
http://goldtadise.com/?p=356681
Here’s another look at the same basic idea. Chart by Secular Investor.