
An upwards correction was expected to begin this week.
Monday is completing a green daily candlestick which fits the Elliott wave count perfectly.
Summary: This second wave correction may last a total Fibonacci 13 or 21 days. It would most likely end about the 0.382 Fibonacci ratio at 1,104, because it may find resistance there at a trend line. The trend is down. This is a correction against the trend.
New updates to this analysis are in bold.
To see weekly charts and the difference between the two wave counts go here.
MAIN ELLIOTT WAVE COUNT
Click chart to enlarge.
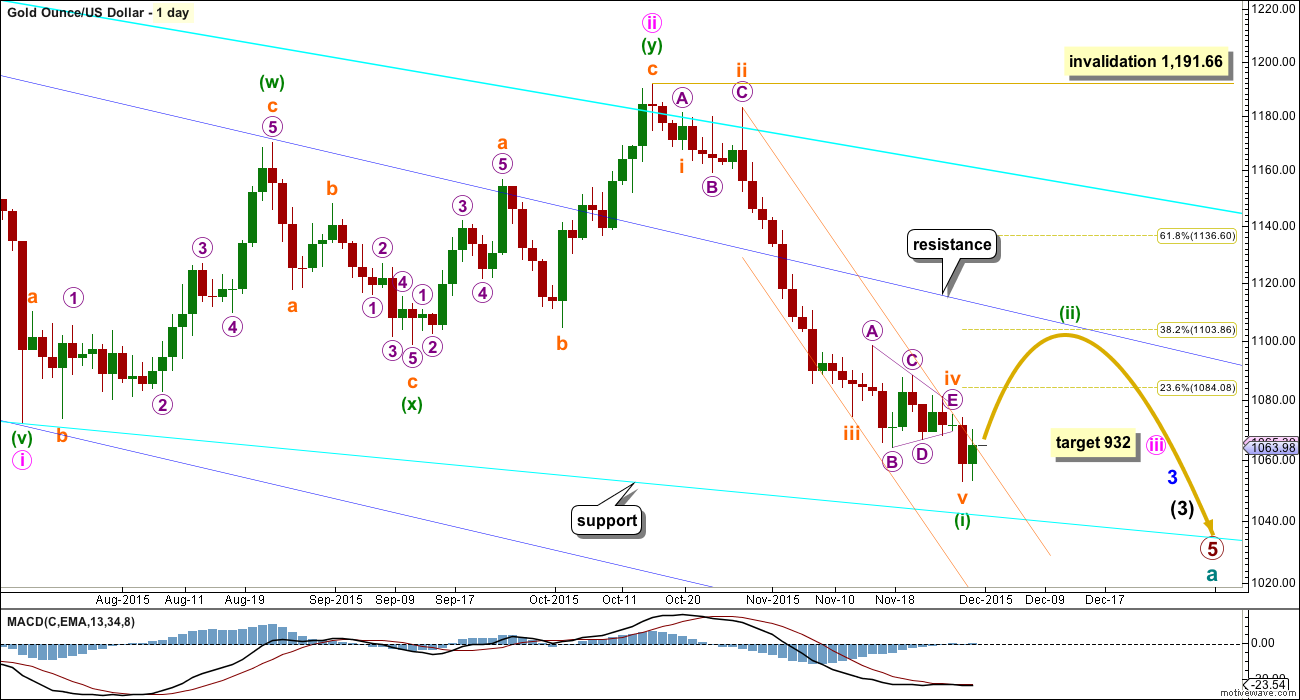
Gold has been in a bear market since September 2011. There has not yet been confirmation of a change from bear to bull, and so at this stage any bull wave count would be trying to pick a low which is not advised. Price remains below the 200 day moving average and below the blue trend line (copied over from the weekly chart). The bear market should be expected to be intact until we have technical confirmation of a big trend change.
The final line of resistance (cyan line copied over from weekly charts) is only overshot and not so far properly breached. While this line is not breached the bear wave count will remain possible. Simple is best, and the simplest method to confirm a trend change is a trend line.
Minute wave ii is a complete double zigzag and deep at 0.75 the length of minute wave i. It has breached the dark blue base channel drawn about minor waves 1 and 2, one degree higher. When a lower degree second wave correction does this it reduces the probability of the wave count but does not invalidate it. Base channels most often work to show where following corrections find support or resistance, but not always.
At 932 minute wave iii would reach 1.618 the length of minute wave i.
Minuette wave (i) is complete. Ratios within minuette wave (i) are: subminuette wave iii is 6.48 longer than 4.236 the length of subminuette wave i, and subminuette wave v is 2.03 short of equality in length with subminuette wave i. If subminuette wave v continues any lower at the beginning of next week, then it may end at 1,050.82 where it would reach equality in length with subminuette wave i.
Minuette wave (ii) may find resistance at the upper dark blue trend line. This may see it end about the 0.382 Fibonacci ratio of minuette wave (i) at 1,104.
Draw a channel about minuette wave (i) using Elliott’s second technique: draw the first trend line from the ends of subminuette waves ii to iv, then place a parallel copy on the end of subminuette wave iii. When price breaks above the upper edge of this channel it should confirm a trend change. Copy the channel over to the hourly chart. So far this channel is breached on the hourly chart providing earliest trend channel confirmation that minuette wave (i) is over and minuette wave (ii) has begun. When this channel is also breached on the daily chart, then more confidence may be had that minuette wave (i) is over and minuette wave (ii) is underway.
Minuette wave (i) lasted 31 days, three short of a Fibonacci 34. Minuette wave (ii) may be expected to last a Fibonacci 13 or 21 days, with 13 favoured at this stage. It may also be more brief than this due to the strong downwards pull of the middle of a big third wave. Analysis this week and next will focus on identifying a potential end to this correction.
At this early stage, it is impossible to determine which of several possible structures may unfold for minuette wave (ii). Today I will have two hourly charts to look at subminuette wave a as either a three or a five.
FIRST HOURLY WAVE COUNT
Click chart to enlarge.
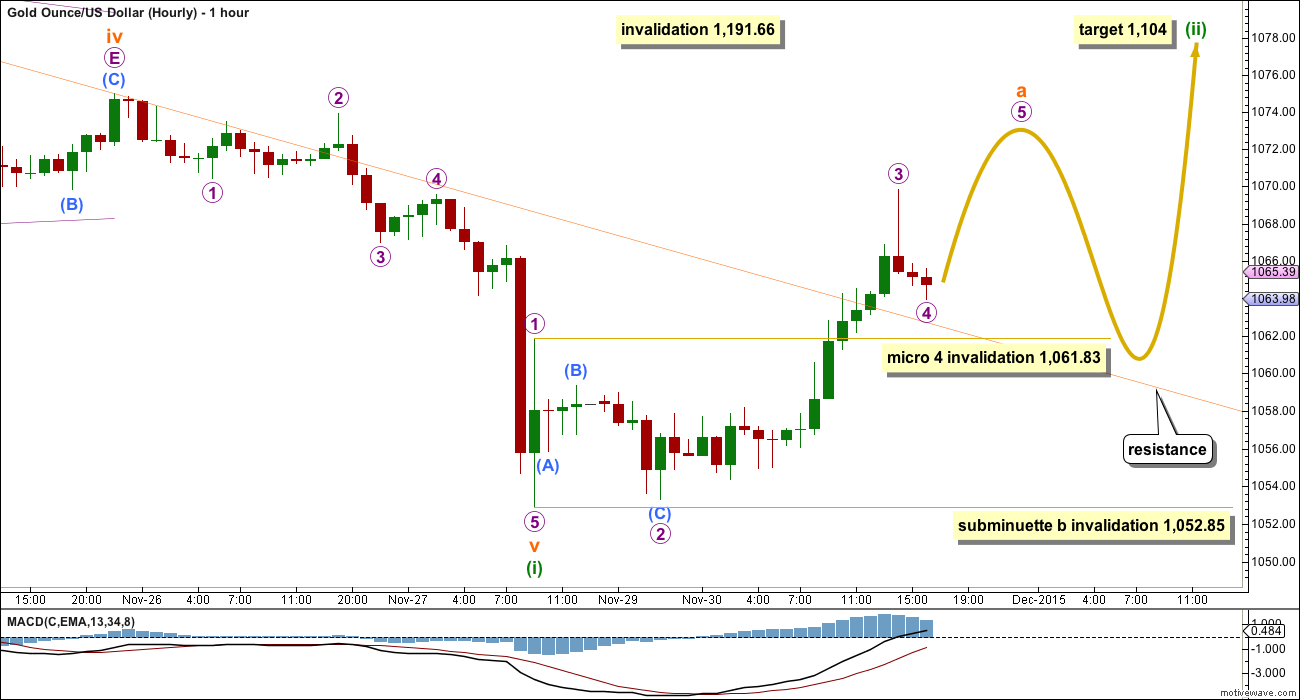
Minuette wave (ii) is most likely to be a zigzag, so subminuette wave a is most likely to be a five wave structure.
If a five wave structure is unfolding upwards, it looks so far like it may be an impulse. There is no Fibonacci ratio between micro waves 1 and 3.
Micro wave 2 was a very deep 0.95 zigzag. Given the guideline of alternation micro wave 4 may be expected to be a shallow flat, combination or triangle. It may not move into micro wave 1 price territory below 1,061.83.
When micro wave 4 is complete, then micro wave 5 upwards would most likely make a new high above the end of micro wave 3 at 1,069.85 to avoid a truncation. It would most likely be equal in length with micro wave 1 at 8.98.
Subminuette wave b downwards should unfold when subminuette wave a is a completed impulse. It would most likely be choppy, overlapping and time consuming. It may not move beyond the start of subminuette wave a at 1,052.85.
If upwards movement continues as this first hourly wave count expects and there is a clear five up on the hourly chart, then the next correction may not make a new low.
However, if in the short term we see a new low below 1,061.83, then the first wave up would be a completed three and the second hourly wave count below would apply.
At this stage, I will label subminuette wave a as close to completion. But when the first wave up is complete, then alternates must be used which would move the degree of labelling within this correction down one degree. For now, to keep the number of charts reasonable, the analysis will focus on just the first movement up within this correction.
SECOND HOURLY WAVE COUNT
Click chart to enlarge.
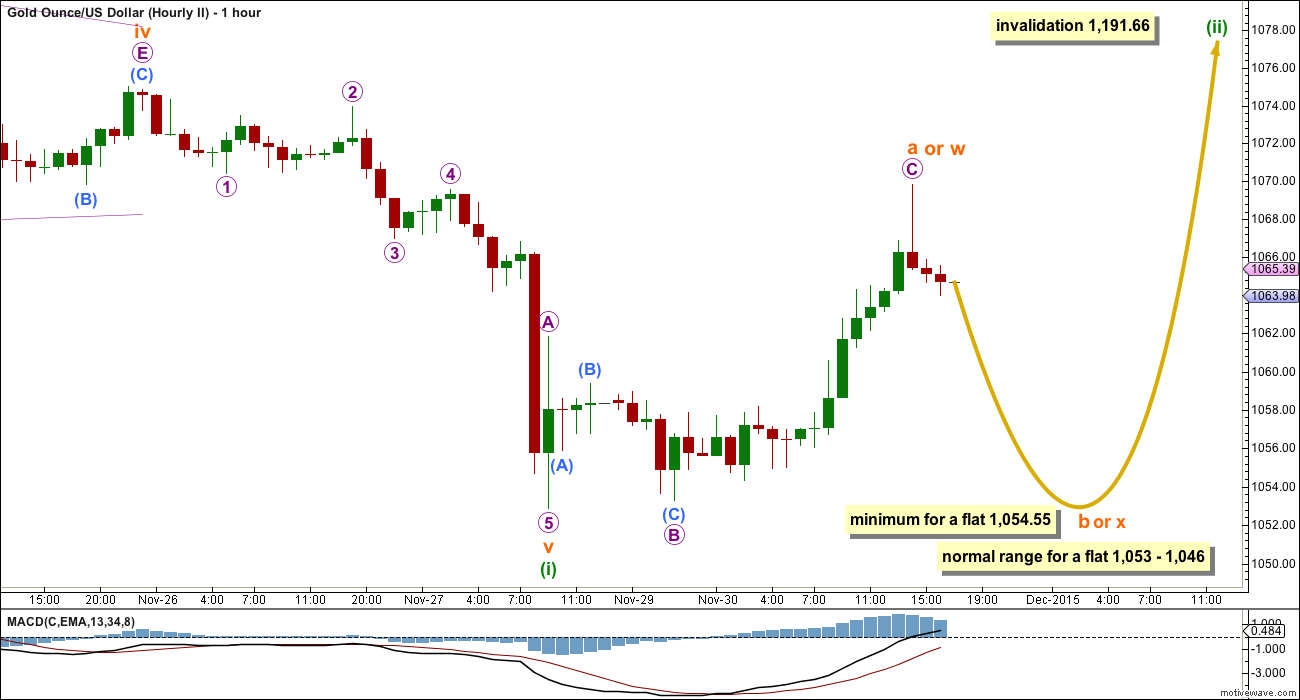
Minuette wave (ii) may also unfold as a flat or combination. The only structure it may not be is a triangle. Flats and combinations begin with three wave structures.
If a flat or combination is unfolding, then subminuette wave a (or w) may be a completed three wave zigzag upwards. The degree of labelling within this movement may also be moved down one degree; this may only be micro wave A (or W) within a flat or combination which may be subminuette wave a. For now I will publish this idea with this degree of labelling only, but please note that the degree of labelling over this week may change as more structure unfolds and it becomes clearer.
If the first wave up is a zigzag, then the next wave downwards may make a new low below its start below 1,052.85.
If a flat correction is unfolding, then subminuette wave b must retrace a minimum 0.9 length of subminuette wave a at 1,054.55. The most common range for a B wave within a flat is 1 to 1.38 times the length of the A wave, which gives a range between 1,053 – 1,046.
If a combination is unfolding, then there is no minimum nor maximum for subminuette wave x. It may be any corrective structure, and it may make a new low below 1,052.85.
There is no maximum limit for the length of a B wave within a flat. There is a convention which states that when the B wave reaches twice the length of the A wave the probability of a flat unfolding is so low that it should be discarded. This price point would be at 1,035.85.
ALTERNATE ELLIOTT WAVE COUNT
Click chart to enlarge.
I am aware that this is the wave count which EWI and Danerics have. The implications are important, so I will follow this wave count daily for members here too.
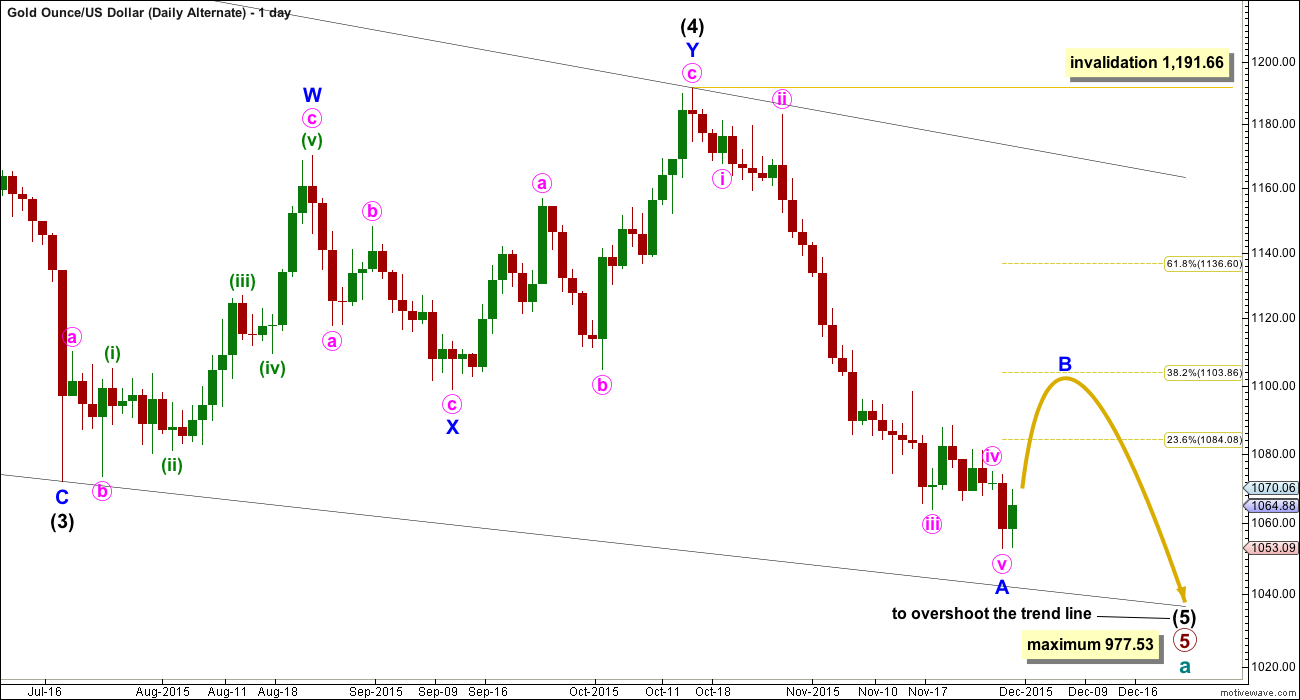
Everything is the same up to the end of the triangle for primary wave 4. Thereafter, primary wave 5 is seen as an ending contracting diagonal.
Within the ending contracting diagonal, it is not possible to see intermediate wave (2) as a zigzag and meet all Elliott wave rules. To see an explanation of why see this video at 10:25.
The same problem exists for the ending diagonal of primary wave 5 itself. Intermediate wave (3) is longer than intermediate wave (1) which would suggest an expanding diagonal, but intermediate wave (4) is shorter than intermediate wave (2) and the trend lines converge which suggests a contracting diagonal.
From “Elliott Wave Principle” by Frost and Prechter, 10th edition, page 88: “In the contracting variety, wave 3 is always shorter than wave 1, wave 4 is always shorter than wave 2, and wave 5 is always shorter than wave 3. In the expanding variety, wave 3 is always longer than wave 1, wave 4 is always longer than wave 2, and wave 5 is always longer than wave 3.”
This structure violates the rules for both a contracting and expanding variety. If the rules in Frost and Prechter are accepted, then this is an invalid wave count.
It may be that the rules need to be rewritten to add “sometimes a third wave may be the longest within a contracting or expanding diagonal”. But I have never seen Robert Prechter publish such a rule, I do not know that it exists.
I cannot reconcile this wave count from EWI with the rules in Frost and Prechter.
If an ending contracting diagonal is unfolding, then the (1) – (3) trend line may be overshot signalling the end of intermediate wave (5). If price behaves thus and turns around and moves strongly higher, then this wave count must be accepted and the rules for diagonals will need to be rewritten.
I will continue to follow this possibility as price moves lower.
Intermediate wave (5) should be shorter than intermediate wave (1). At 977.53 intermediate wave (5) would reach equality in length with intermediate wave (1). A new low below this point would take this possible diagonal structure too far from the rules. At that stage, it really should be finally discarded.
All sub waves within ending diagonals must subdivide as zigzags. Within the zigzag of intermediate wave (5), minor wave B should unfold over several days. At this stage, there is no divergence between this idea and the main Elliott wave count.
Minor wave B may not move beyond the start of minor wave A above 1,191.66.
I am uncomfortable with publishing this wave count and I only do so because it has been published by Elliott Wave International. I am not comfortable with publishing any wave count which violates the rules in Frost and Prechter. However, when looking at primary wave 5 on the weekly chart it does look like a diagonal is unfolding.
Short to mid term there is no divergence in expected direction between this wave count and the main wave count.
TECHNICAL ANALYSIS
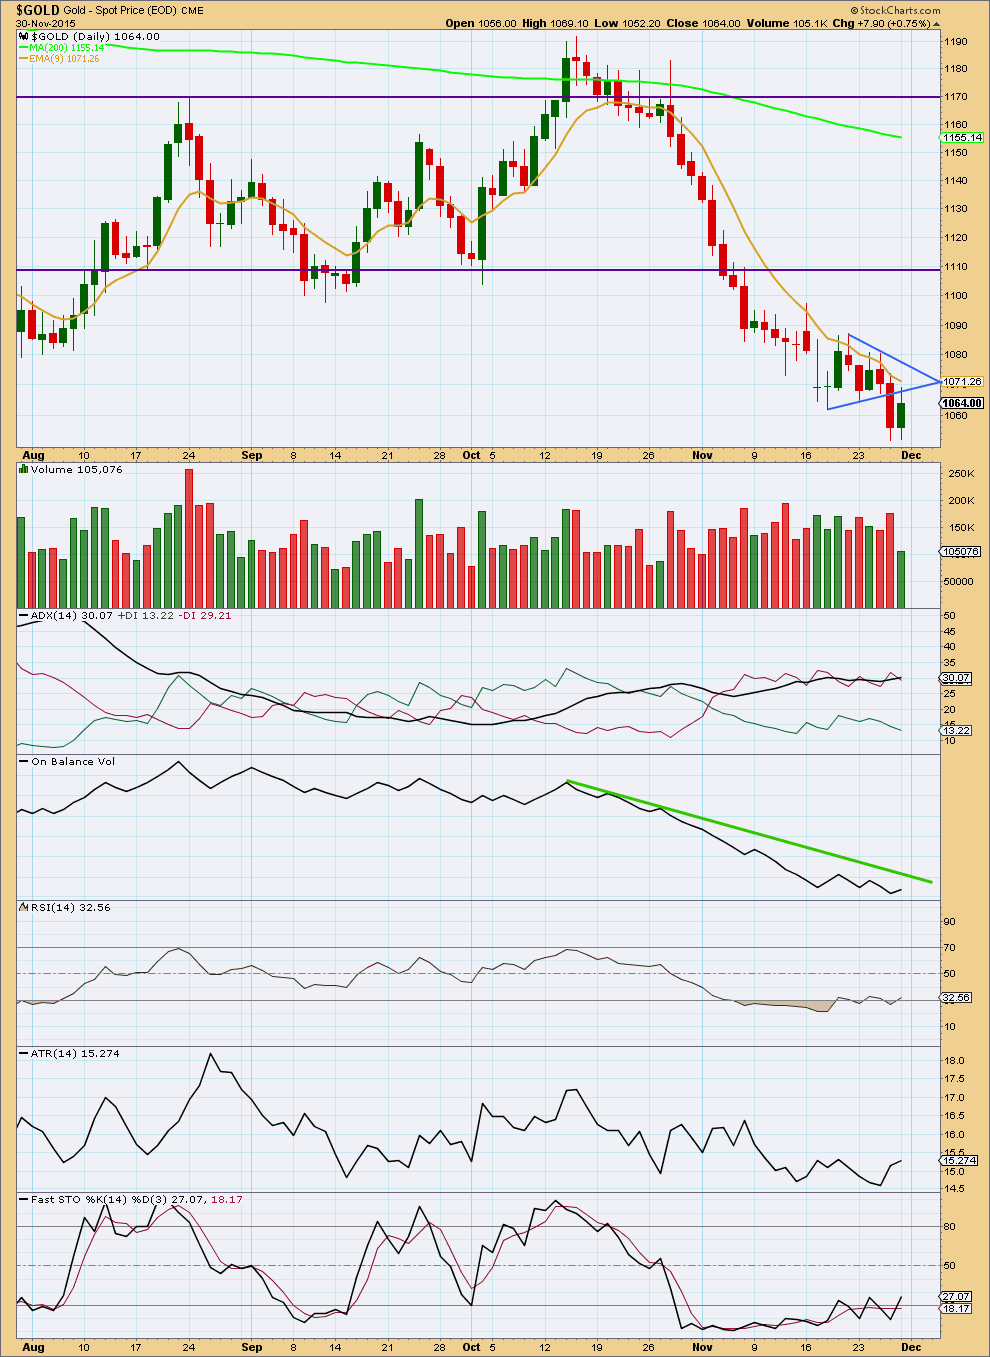
Click chart to enlarge. Chart courtesy of StockCharts.com.
Monday’s upwards movement is not supported by volume. This indicates that upwards movement is most likely a correction against a downwards trend. This supports the Elliott wave count.
Gold often exhibits a volume spike at the end of its trends. This may be what has happened on Friday. Monday’s upwards movement is finding some resistance at the lower triangle trend line.
ADX still indicates a downwards trend is in place. ATR agrees for the last three days; it is increasing. Both of these indicators are lagging as they are based on averages.
RSI and Stochastics are returning from oversold. More upwards movement may be expected to return further above oversold before there would be room again for more downwards movement.
This analysis is published about 06:49 p.m. EST.
With COT the way it is, I am of the opinion that this correction may be longer in duration, and could go higher, than many anticipate. I see the time and price targets here as absolute minimums.
Could the five up perhaps be the first of 3 or 5 up? After all, gold is only 2 days into this correction.
That is exactly what my second hourly chart will look at.
It moves everything down one degree to see it as either wave A of a zigzag or wave 1 of an impulse up.
There’s now a five up and potentially a complete three down.
But this is a B wave. The absolute worst of all Elliott waves to figure out. They can be any corrective structure and have a tendency to be very difficult to determine which it is until they’re either over or very close to the end.
So far the three down will subdivide nicely as a double zigzag which is now complete.
A new high above 1,072.69 would provide some reasonable price confirmation that it is most likely over.
The next wave up should subdivide as a five.
I’ll have two hourly wave counts again today but today the only difference will be the degree of labelling. I don’t want to surprise any members by changing it in a few days, and so I’ll chart it now and follow both ideas.
Today’s candlestick will close above the trend channel on the daily chart, the narrow orange one about minuette (i). That is full and final confirmation that Gold is now in a correction against the downwards trend.
Corrections may be used as opportunities to join a trend. At their end they can offer good entry points. Trading a correction involves trading against the trend, not advised except for the most nimble and experienced of traders.
The first 5 up may still be continuing. We may have just completed a 2nd 4th wave. After a new high, then we may have a larger B wave correction.
That’s possible yes.
I don’t think it would have a very typical look for Gold though.
And the possible second fourth wave correction would be much larger than the other corrections within the five up, it would have breached a channel drawn about the rest of it no matter how the channel is drawn.
Possible, yes. But I expect the idea has a low probability.
As lara said five up on hourly chart is completed…can anyone give me an idea wht price will three down will complete
I’m not sure if already completed a 3 wave count down to today’s low of 1064.40 at 9:49 am. Then may of had a 1st wave up to 1070.26 at 10:11 am and now doing a 2nd wave down to just above 1064.40 then back up.
Or perhaps my count is wrong?
Otherwise 1064.40 may have only been the 3rd wave of C down and the 5th may be between 1064.40 and 1061.83?
Any wave counts or comments?
Not sure what u said does actually fit
Gold dropped to 1,064.15 at 12:25 pm the
low of the day.
It is possible it was the end of the 3 wave down?
Resistance is now around the 1,058 area.
Lara did say she didn’t expect a new low below 1,052.85.
Looks like 1,063.81 at 1:28 pm was the magic low of the day.
At 1:37 pm the fireworks went off on NUGT price.
1 minute fired at 1:37 pm then 3 minute then 5 minute then 15 minute taking NUGT from $26.04 at 1:37 pm non stop up to $27.43 at 2:13 pm. Great run of $1.39 in 36 minutes! It may continue, we’ll see.
39 minute , 78 minute, 195 minute, daily and weekly were already buys.
Gold rallies 1 percent on short covering, drop in dollar
Reuters | SINGAPORE
December 1, 2015 Last Updated at 09:09 IST
http://www.business-standard.com/article/reuters/gold-rallies-1-percent-on-short-covering-drop-in-dollar-115120100141_1.html
Bullion posted its biggest monthly drop in 2-1/2 years in November with a 7-percent decline. Hedge funds and money managers raised their net short position in COMEX gold to the biggest on record in the week to Nov. 24, data showed on Monday.
Assets in SPDR Gold Trust, the world’s top gold-backed exchange-traded fund, are at their lowest since September 2008.
Interesting. Analyst looks at large speculator short position. Large commercials are on otherside of specs.
I have noticed following large commercial is better fit than specs.
Specially the net shorts of large commercial which is lowest at 16584 contracts as of Monday compared with the 171480 contracts on Oct 31 when gold was at 1141.
Extreme COT data projects the gold price. EW is in the same direction.
Swiss franc COT is also bullish for gold.
Exquisite post.
(I’m following what the large commercials’ are up to)
Thank you so much for your great charts as well keeping us informed.
There is now a clear five up on the hourly chart. The first hourly wave count is looking more correct.
A downwards correction should be a three and should not make a new low.
After that, more upwards movement.
It looks like this is quite quick, I think I need to move the degree of labelling on the hourly chart down one degree.
Lara: Finally there is a confirmed bullish divergence between price and RSI.
Yes.
It looks pretty bullish for this week.
COT extremely bullish???
Dreamer
I agree this is the most bullish COT from large commercial short positions.
Short position has dropped by 63113 to lowest level. From high of 398000+.
Lara’s wave count seems to be in the agreement with COT.
11/30 Commercial shorts 231,475, Spec long: 162,092; (-63113) Net Shorts +16684, Gold close:1064
11/20 Commercial shorts 294,588, Spec long: 165,084; (-21488) Net Shorts +24465, Gold close:1077
11/13 Commercial shorts 316,069, Spec long: 167,232; (-36992) Net Shorts +69,352, Gold close:1082
11/06 Commercial shorts 352,992, Spec long: 190,149; (-36012) Net Shorts +123,381, Gold close:1089
10/30 Commercial shorts 389,003, Spec long: 225,777; (-9641) Net Shorts +171,480, Gold close:1141
This is the most bullish looking COT over the last year. Commercials at 48% bullish. I expect that next week we will see the Commercials starting to add to their short positions again.
Silver COT – Commercials are only 40% bullish. I would say that we have a bearish divergence between Silver COT and Gold COT. Look at the July/August timeframe compared to now on both charts. Commercials are much more short on Silver now than they were in July/August, yet they are about equally short on Gold between the timeframes. Looks bearish overall for the metals once the bounce is complete.
I noticed that too Dreamer and agree it’s still bearish medium term. When this cycle wave (a) finally bottoms then I expect silver first out of the gate and fast.