
Downwards movement was not expected below 1,132.12.
Only one bull wave count remains valid as does the bear.
Summary: A five wave impulse is either over here or may be very soon. Use the smallest channel on the hourly chart to indicate when downwards movement is over. Price may continue lower while it remains within the channel. When a trend change is indicated by a breach of the smallest channel, then how high the next wave goes will indicate if the bull or bear wave count is correct. At this stage, the bear wave count has the best look at the daily chart level.
It is time to step back and take a look at weekly charts again.
New updates to this analysis are in bold.
BEAR ELLIOTT WAVE COUNT
Click chart to enlarge.
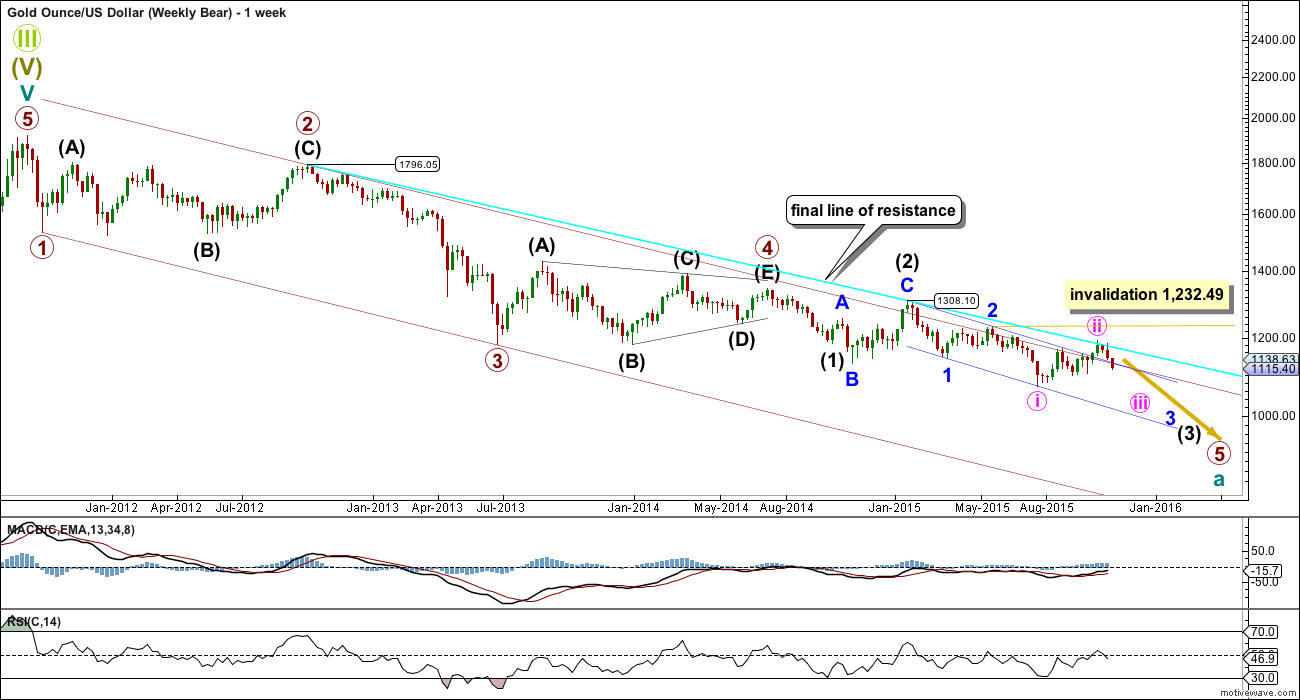
Gold has been in a bear market since September 2011. There has not yet been confirmation of a change from bear to bull, and so at this stage any bull wave count would be trying to pick a low which is not advised. Price remains below the 200 day moving average and below the blue trend line (copied over to the daily chart). The bear market should be expected to be intact until we have technical confirmation of a big trend change.
The maroon channel is drawn using Elliott’s technique about an impulse: draw the first trend line from the ends of primary waves 1 to 3, then place a parallel copy on the end of primary wave 2. The upper edge of this channel has been breached slightly twice during primary wave 5, which is a cause for concern and a reason to consider a possible bull wave count, but the breaches are not enough confirmation of a big trend change though.
A five wave impulse is unfolding lower from the all time high. The subdivisions all fit perfectly.
It is not possible to see primary wave 1 ending any earlier because it must be a five. Primary wave 2 was a deep 0.68 running flat lasting 53 weeks. Primary wave 3 was a perfect impulse and 12.54 short of 1.618 the length of primary wave 1. Primary wave 4 was a shallow 0.27 regular contracting triangle lasting 54 weeks. There is perfect alternation in depth and structure between primary waves 2 and 4. There is almost perfect proportion also, which gives the wave count a textbook perfect look at the weekly chart level. It is the proportion between the corrections of an impulse which give it the “right look”.
Within primary wave 5, there is some concern that intermediate wave (2), minor wave 2, and now minute wave ii are all much bigger and time consuming than these corrections at these degrees normally are. This is the second reason for considering a bull wave count.
If price moves above 1,232.49, then this bear wave count would be invalidated.
Click chart to enlarge.
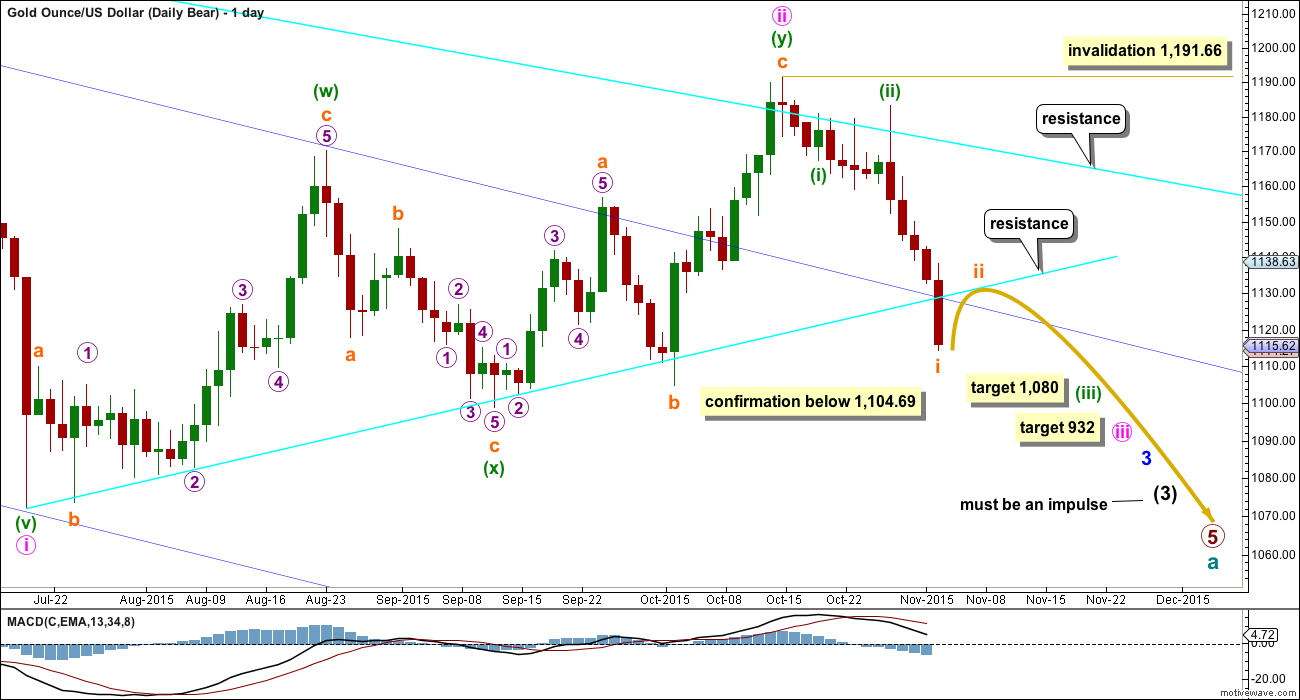
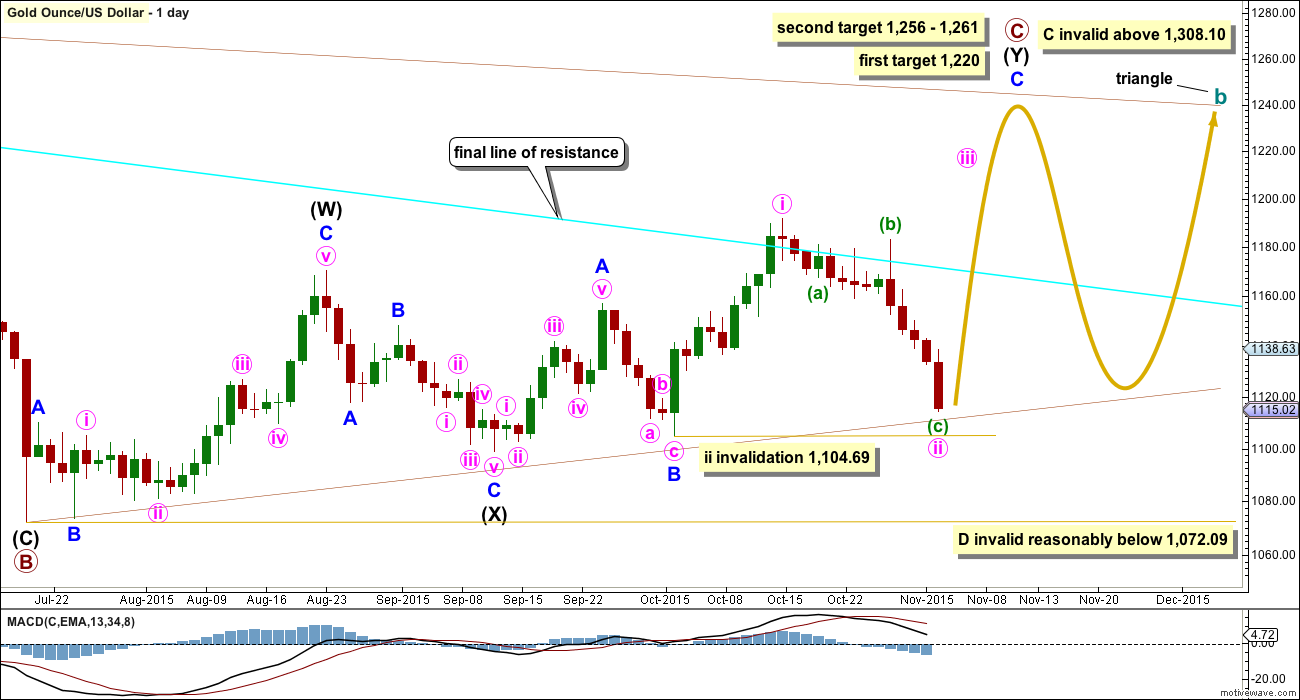
The final line of resistance (bright aqua blue line copied over from weekly charts) is only overshot and not so far properly breached. While this line is not breached the bear wave count will remain possible. Simple is best, and the simplest method to confirm a trend change is a trend line. While price remains below this line, it must be accepted that Gold has been in a bear market since 2011 and we don’t have technical confirmation that the bear market has ended.
The most likely possibility is that minute wave ii is a complete double zigzag and deep at 0.75 the length of minute wave i for the bear wave count. It has breached the dark blue base channel drawn about minor waves 1 and 2, one degree higher. When a lower degree second wave correction does this it reduces the probability of the wave count but does not invalidate it. Base channels most often work to show where following corrections find support or resistance, but not always.
At 932 minute wave iii would reach 1.618 the length of minute wave i.
A new high above 1,191.66 would necessarily come with a clear breach of the bear market trend line, and so at that stage a bear wave count should be discarded. Within minute wave iii, no second wave correction may move beyond its start above 1,191.66.
Gold often exhibits swift strong fifth waves, particularly its fifth waves within its third waves. When price moves towards subminuette wave v of minuette wave (iii) it may be explosive. For this wave count look out for surprises to be to the downside.
At 1,080 minuette wave (iii) would reach 4.236 the length of minuette wave (i).
Now that price has broken below support at the bright aqua blue trend line, the upcoming correction for subminuette ii may find resistance there.
It is also possible that the degree of labelling within subminuette i may be moved up one degree, because this may be an end to minuette wave (iii) coming up. The next correction could be minuette wave (iv) which may not move back into minuette wave (i) price territory above 1,167.49. If this wave count is confirmed with a new low below 1,104.69, then it will be presented with two daily charts to look at both possibilities for the structure within minute wave iii. The expected direction is still exactly the same: down.
HOURLY CHART
Click chart to enlarge.
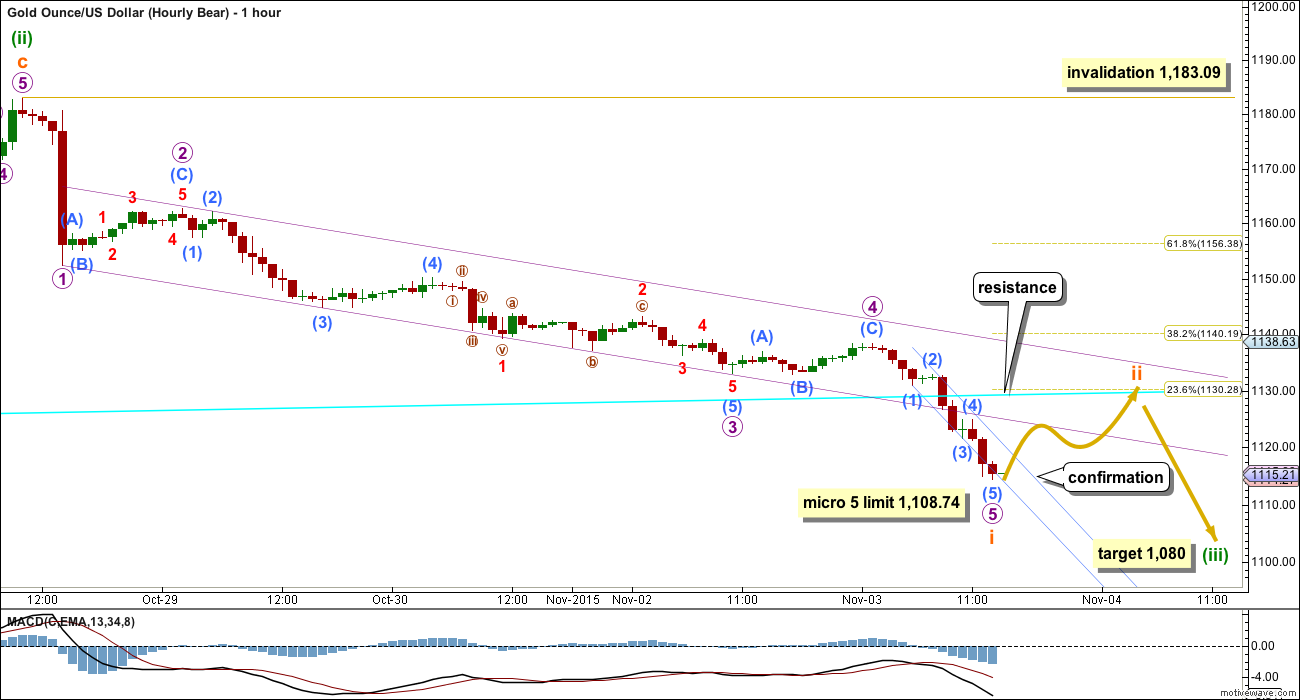
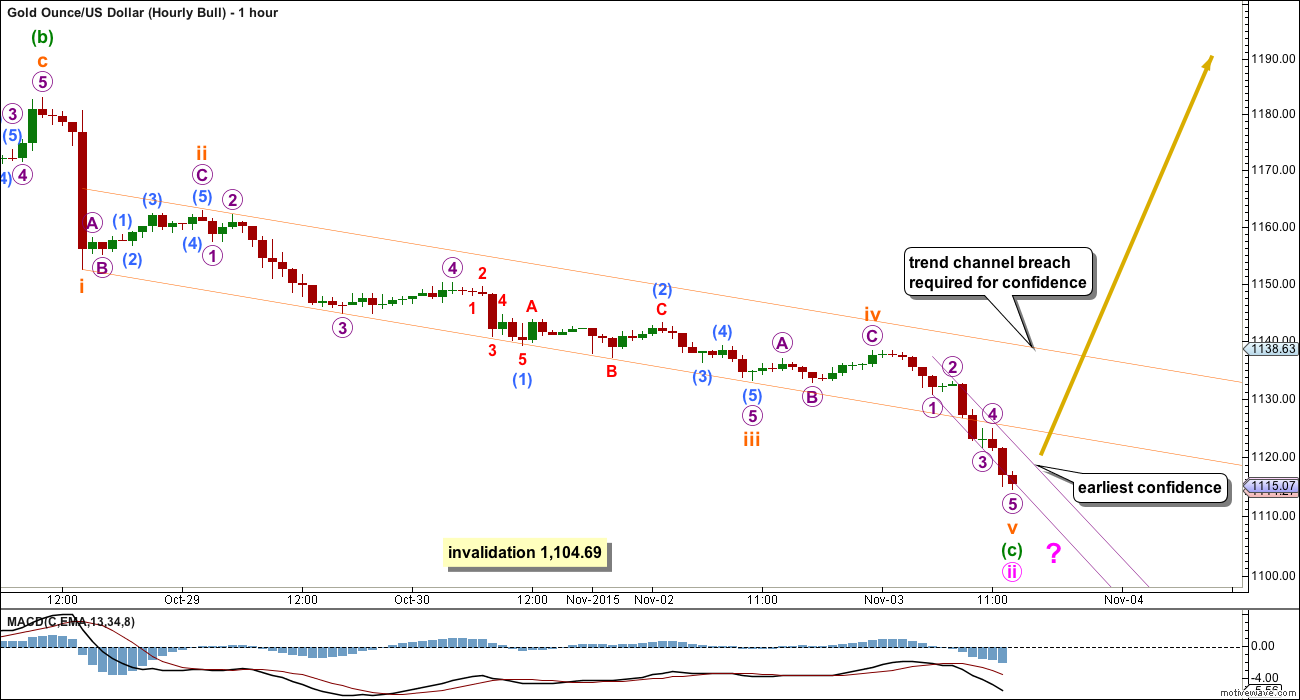
The impulse downwards labelled here subminuette wave i (which could also be moved up one degree; it may be minuette wave (iii) ) was not over. The channel about it was not breached by upwards movement. Price continued lower.
The five wave impulse downwards may again be either complete here or close to completion. Allow for the likelihood that price may yet continue lower while price remains within the smallest light blue channel (drawn about the fifth wave). Only when that small channel is breached may confidence be had that this downwards movement is over and a correction to follow it has begun.
If my labelling of micro waves 3 and 4 is correct, then there is a limit to micro wave 5. Micro wave 3 has a ratio of equality in length to micro wave 1, but it is 0.97 shorter. A third wave may never be the shortest. This limits micro wave 5 to no longer than 1,108.74 where it would reach equality in length with micro wave 3.
Micro wave 2 is a shallow 0.34 zigzag. Micro wave 4 exhibits perfect alternation as a very shallow 0.18 regular flat correction. Because of perfect alternation, good proportion, and a ratio between micro waves 1 and 3 this part of the wave count looks right.
Subminuette wave ii may be more brief and shallow than second wave corrections normally are due to the strong downwards pull of the middle of a third wave which may be approaching.
If the upcoming correction is minuette wave (iv), then it too may be very quick and shallow due to the strong downwards pull of a swift strong fifth wave approaching.
Expect surprises for this bear wave count to be to the downside.
BULL ELLIOTT WAVE COUNT
WEEKLY – TRIANGLE
Click chart to enlarge.
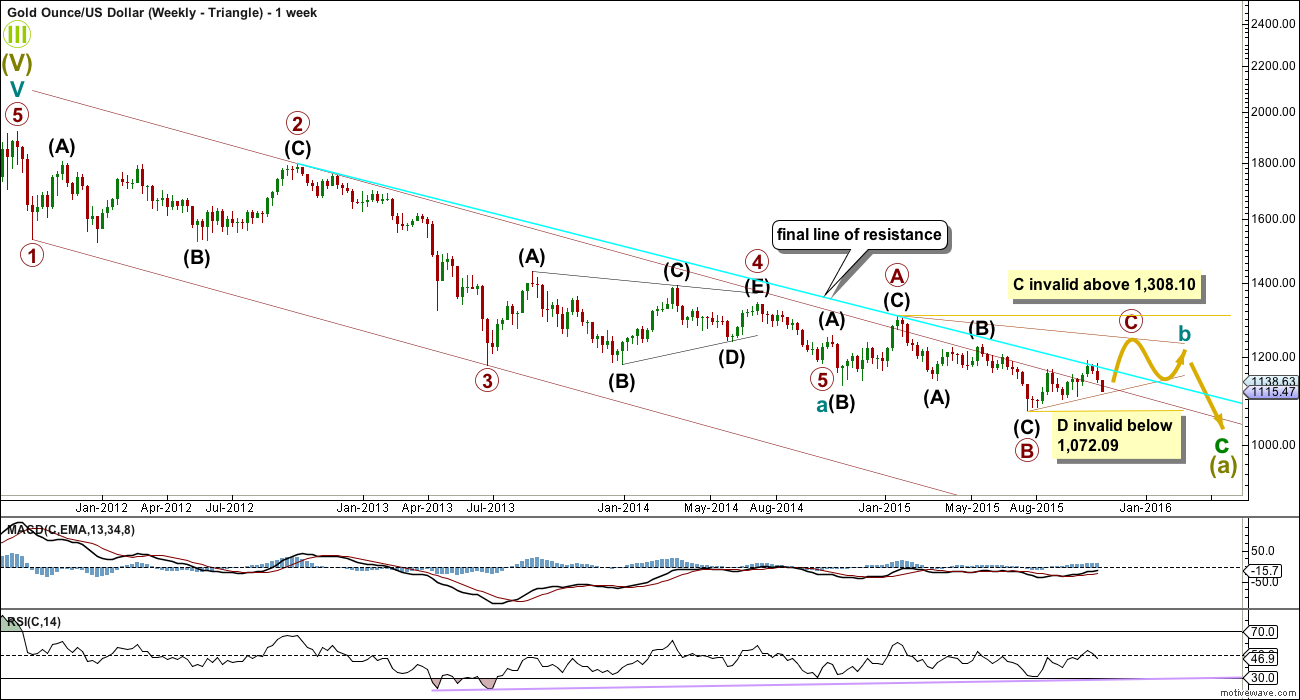
Both bull and bear wave counts are identical to the end of primary wave 4. Thereafter, the bear sees primary 5 incomplete, but the bull sees primary 5 as over, so the bull wave count sees cycle wave a as a complete five wave impulse.
Gold often exhibits surprisingly short fifth waves to follow its fourth wave triangles. Here primary wave 5 is 13.85 longer than 0.382 the length of primary wave 1. Primary wave 5 is slightly truncated by 2.66. The truncation is the biggest problem for this bull wave count (apart from a lack of technical confirmation of a cycle degree trend change), but because it follows a fourth wave triangle for a short fifth wave it is entirely possible.
I would not see cycle wave a complete at the next low labelled intermediate wave (B) for two reasons: it would be difficult to see primary wave 5 as a five wave impulse, and the wave up labelled intermediate wave (C) will not subdivide as a three and meet all Elliott wave rules. I know other Elliotticians have wave counts which do this, but I cannot see how the violation of the rules has been managed there. To see why intermediate wave (C) will not subdivide as a three, see the explanation in the video of 20th August at 10:28.
If cycle wave a ends with a slightly truncated fifth wave, then cycle wave b begins there. There are 23 possible corrective structures a b wave may unfold as (if all the different kinds of triangles and combinations are counted).
Within cycle wave b, primary wave A subdivides perfectly as an expanded flat, which is a very common structure. Primary wave B subdivides as a zigzag, also a common structure. Primary wave B is 1.89 the length of primary wave A. This is longer than the normal maximum of 1.38, but within allowable convention of 2.
When an A wave subdivides as a three the correction may not be a zigzag. It may be a flat, combination or triangle. This first chart looks at what a triangle would look like. The triangle would be a running contracting or barrier triangle. Within the triangle, primary wave C up must be a single or multiple zigzag. Primary wave C may not move beyond the end of primary wave A above 1,308.10.
Primary wave D may not move below the end of primary wave B at 1,072.09. But primary wave D has not yet begun, and so within primary wave C no second wave nor B wave may move below 1,072.09.
There is strong and persistent divergence between price and RSI at the weekly chart level going back to April 2013. This is a bullish indicator, but it does not tell us exactly where price will find a low.
DAILY – TRIANGLE
Click chart to enlarge.
The potential leading contracting diagonal unfolding upwards is invalidated. The third wave would be shorter than the first, but now the fourth wave would be longer than the second. The wave lengths do not meet the rules for either a contracting or expanding diagonal and so the idea is invalid. The only option now left that I can see at this stage for a bull wave count is that cycle wave b is unfolding as a triangle.
This daily chart looks at what a triangle would look like for cycle wave b. The triangle would be a running contracting or barrier triangle. Within the triangle, primary wave C up must be a single or multiple zigzag. Primary wave C may not move beyond the end of primary wave A above 1,308.10.
Primary wave C may not now be a zigzag with a leading contracting diagonal unfolding for intermediate wave (A). The leading diagonal is invalid. The only structure now for primary wave C would be a double zigzag.
If a triangle is unfolding, then at the weekly chart level primary wave C looks unlikely to be complete and should move higher for the triangle to have the right look. This wave count sees upwards movement as incomplete for minor wave C. At 1,220 primary wave C end close to 0.618 the length of primary wave B. One of the five sub waves of a triangle is commonly about 0.618 the length of its predecessor.
The second target at 1,256 is where minor wave C would reach 2.618 the length of minor wave A, and at 1,261 primary wave C would reach 0.8 the length of primary wave A.
For the triangle idea, for cycle wave b, a five wave impulsive structure only needs to complete upwards. The next wave down for primary wave D should be fairly time consuming, lasting about 2 to 6 months. Primary wave D may not move beyond the end of primary wave B at 1,072.09 for a contracting triangle. Alternatively, primary wave D may end about the same level as primary wave B at 1,072.09 for a barrier triangle, as long as the B-D trend line remains essentially flat. In practice this means primary wave D can end slightly below 1,072.09 and this wave count remains valid. This is the only Elliott wave rule which is not black and white.
The depth and duration of minute wave ii now does not look right. It is larger in length and duration than minor wave B one degree higher. If price continues sideways from here in an ever decreasing range, then I would consider the possibility that minor wave B was not over as a single zigzag but may be continuing sideways as a triangle. The invalidation point would still be the same at 1,104.69, so there is no divergence between that idea and the chart presented here at this stage.
HOURLY – TRIANGLE
Click chart to enlarge.
Subdivisions within this downwards impulse are exactly the same for both bull and bear wave counts but the bull is one degree higher. Channels are also the same.
For the bull wave count, when the downwards movement is confirmed as over with a channel breach of the smallest channel, then how high the next wave goes may indicate which wave count is correct, bull or bear. A new high above 1,183.09 would strongly favour this bull wave count.
The bull wave count expects the next movement up may be a third wave.
TECHNICAL ANALYSIS
Click chart to enlarge. Chart courtesy of StockCharts.com.
This regular technical analysis is published late, after NY has closed, early EST 4th November.
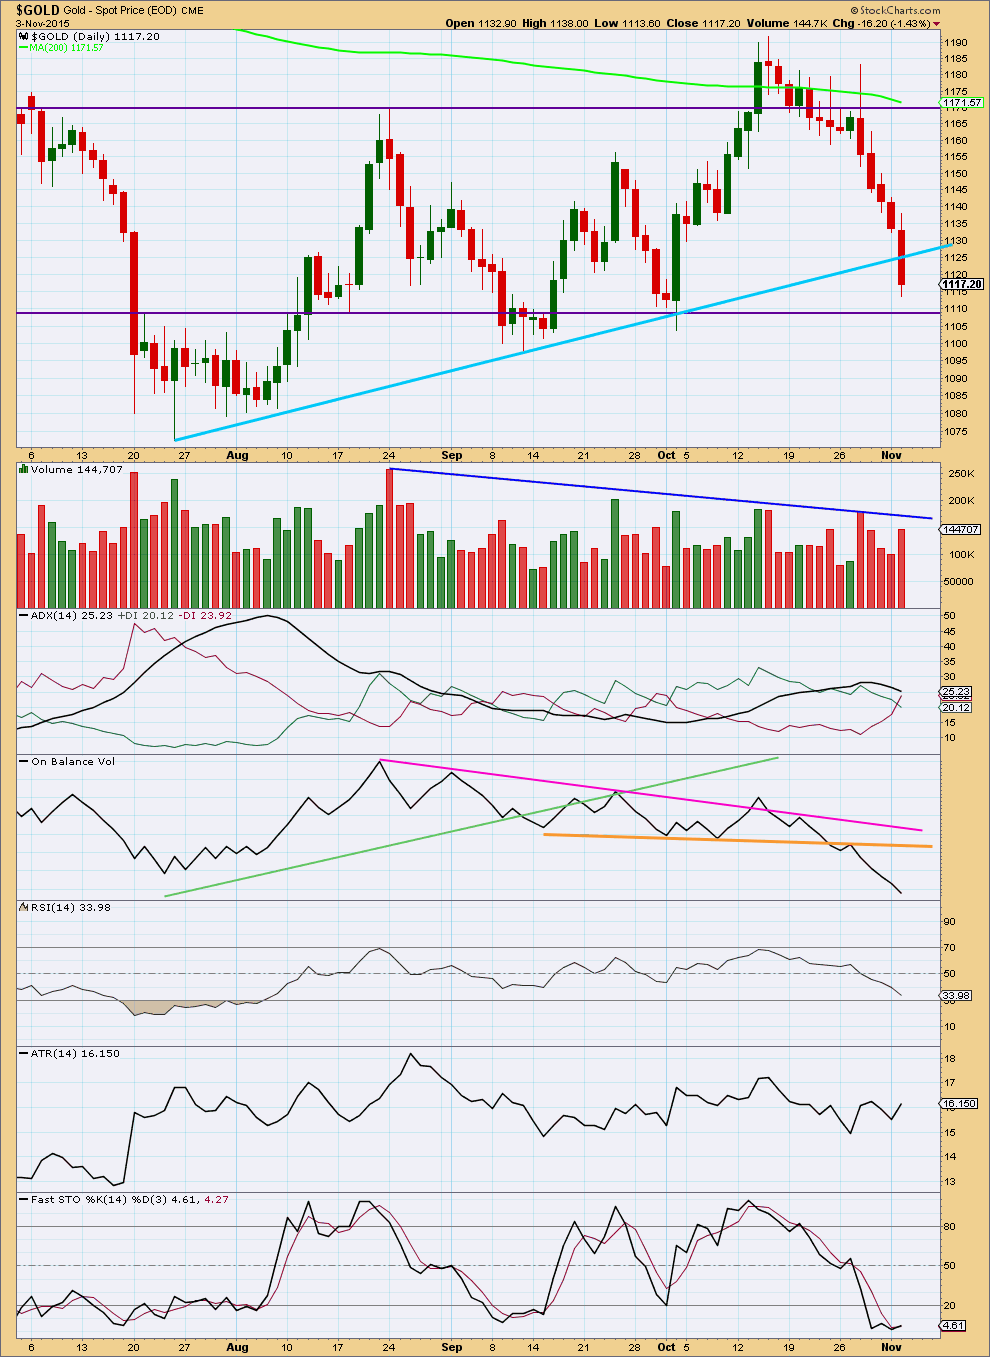
Daily: A sharp increase in volume favours the bear wave count, but overall volume still is declining during this consolidation phase. The increase in volume is not enough yet to indicate a downwards breakout. If price breaks below the lower horizontal trend line on an increase in volume then confidence may be had in a downwards breakout. The increase in volume should be stronger than volume during any day of the consolidation except maybe for the first strongest day.
Today ADX no longer indicates an upwards trend is in place, the black ADX line is pointing downwards. The +DX and -DX lines have crossed today indicating a potential trend change. ADX does tend to be a lagging indicator, it is finally indicating the trend may have changed to down although price has been falling now for five days straight.
ATR is overall flat for the last few days; higher lows but not yet higher highs for ATR give overall sideways movement.
On Balance Volume remains the most bearish indicator. It is strongly pointing lower agreeing with price. The break of OBV below the prior line of support, although short held, may be an early indicator of a downwards breakout. The horizontal support line for price should be watched carefully.
Stochastics is oversold, but if price is preparing to break out downwards as OBV suggests then oscillators may remain extreme while a trend develops. There is very slight bullish divergence between the last low and Stochastics. This is a weak signal, but may support the idea of at least a small bounce either here or soon.
The last big move down for price from 1,232 in May 2015, to 1,072 in July 2015, began with downwards movement of price on declining volume. It was not until the end of the movement that volume supported price. The current decline in volume is a warning to be cautious about the bear wave count, but because price can and does fall of its own weight it most certainly does not indicate the bear wave count is wrong. The bear wave count may still be correct, and we may not see volume support price until price breaks out of this consolidation zone, below the lower horizontal support line.
This analysis is published about 03:23 p.m. EST.
Some traders on Goldtent think the miners are due for a small bounce for a better shorting opportunity. Take a look.
http://goldtadise.com
Dollar Climbing After Yellen Says December Rate Hike Still Possible
Wednesday November 04, 2015 9:26 AM
http://www.kitco.com/news/2015-11-04/Dollar-Climbing-After-Yellen-Says-December-Rate-Hike-Still-Possible.html
Now 0.618 bounce to 1115 can be expected. Then she goes down in 3rd wave.
Get ready for a ride
Look at 1 hour on http://www.pmbull.com
it hasn’t been safe to go bullish since Oct 28th FOMC and Gold high of 1,182.62.
Gold is now at/near another more significant support level, which coincides with both the September and October lows. Could be an excuse for a bounce.
Definitely.
And that’s why I’ll be looking for an alternate which could see downwards movement over here. If I can figure it out and it has a good probability I’ll publish it.
I think the break out of that small channel could have been the end of subminuette wave s i and ii.
This is probably subminuette iii.
The bull wave count is now highly unlikely. Which means the bear wave count is more likely.
Expect any surprises to be to the downside with the strong middle of a big third wave approaching. Once we get towards the fifth wave of minuette (iii) there may be explosive downwards movement.
This chart is the first hourly chart for the bear, follows on directly from yesterday’s chart. I’m going to spend some time to find an alternate way to label this downwards movement, to consider all possibilities. So please note, this chart probably won’t be the only one, I’ll have at least one more. Then we can use confirmation / invalidation points to figure out what’s happening if this downwards movement ends soon for a bounce.
At this stage it looks like the trend is down and the bear count is correct . That would be confirmed by price below 1,104.69
Any chance it could be an expanded flat? After orange 1
It could be. But B would be 1.93 X A, which is quite a bit longer than the maximum common length of 1.38. But still within allowable convention of up to 2.
It is possible, but it has a low probability.
It will be one of the possibilities I’ll chart and then may publish. Unless I can find something that has a higher probability.
Papudi
Seems to b right..
I think the game of gold is changed..bulls hav lost all energy now:((..1104$ not too far..lets see does EW BULL COUNTS hav any hope now..gold wiped off nearly 75$ in just six sessions..PMs under pressure..
Dreamer
Rambus just bot DWTI. US Oil has reversed and may end up with a huge reversal candle.
Lara’s wave count calls for 3rd wave of 5 to begin here?????
Also he bot many PM sector short ETFs and loaded up on last week.
Thanks for the tips!
Gold dropped to 1106.83 low with a $4 pulse down at 1:04 pm, which may have signaled a near term bottom.
Richard
On hourly bear wave count Lara has written micro wave 5 limit 1108.74.
Gold has moved lower than that. What does that mean?
May be a different wave count and gold continues down to below 1104 Who knows?
I think the break of the small channel may have been the indication subminuette i was over, and subminuette ii was much quicker than expected.
Which means this may now be subminuette iii.
But as per my comment above, I’m going to look at alternate scenarios to that idea.
Thanks Lara!
It looks like gold broke out of the smallest channel last night but it keeps making new lows today. Could that mean that the target of 1130 is no longer valid. And could that mean that the limit to the low may no longer be 1,108.74 or would that still be valid?
Gold now 1111.38 a curse for bulls a blessing for bears.
Use the smallest channel on the hourly chart to indicate when downwards movement is over. Price may continue lower while it remains within the channel. Micro wave 5 down may be no longer than 1,108.74.
All these wave counts have to be revisited.
Gold is heading for 1104 and may bounce small and head to 1000.
Gold is in bear market.
Is wave i (orange) complete? AND gold is expected to go to target 1130 in corrective wave ii.
Any comments!!!!!
I should have sold NUGT at when gold was at 1121/
We thought subminuette wave i was complete yesterday at low of 1114.43 at 1:29 pm
Now I’m hoping it completed at today’s low of 1112.24 at 11:04 am and heading up to subminuette wave 11 target of 1130.
You should of sold NUGT high today at 9:37 am when gold at 1117.62 as NUGT and GDX both downhill now NUGT 33.39 and GDX high was 15.22 and now 14.79 and gold 1113.40
Gold broke out upwards of the smallest channel last night and to a high of 1122.96 at 11 pm decides to drop over $10 to a new low of 1112.24 at 11:04 am
Apparently I should of sold at the first high of the day when GDX was at $15.22 at 9:37 am
Hopefully gold double bottoms in a few minutes and stays above 1122.96 low then heads back up towards 1,130 target.
Live Yellen talks may be putting downward pressure on Gold as hit another new low 1112.41 at 10:56 am
http://www.marketwatch.com/newsviewer
10:41am
Yellen says it could be appropriate in December to hike rates
A VIEW: Currently Gold price is having a narrow trade range and an inside day (well almost) hovering below the lower band and ought not to stay below the band for too long…. 1122-23 is providing formidable resistance. On the face of it, a breakout of range to the upside looks favorable but with 50dma slowly heading for a break below 100dma for a bearish crossover, any up move will likley be short lived for a nose dive lol….
Slight break below previous low (1114.47(orange1)) is B of an expanding flat leaving an impulse-up to complete C/orange2 or green4
Thoughts..
$ASTROLOGY$
We mentioned on last friday 4 to 11 nov is very bullish for gold,markets not supporting bull trend right now,trading on the bottom end of weekly channel ,but we are expecting gold to go high.
Sushil
Whos’ service this from- Mahendra Sharma????
No i dnt like his
sushil, where are you getting your astro,ogy forcasts from?
Its ganesha speaks..
But not working this time..
Gold Futures Eyeing Friday’s Jobs Report While GLD Has More Downside To Go – Analysts -Tuesday November 03, 2015 15:17
http://www.kitco.com/news/2015-11-03/Gold-Futures-Eyeing-Friday-s-Jobs-Report-While-GLD-Has-More-Downside-To-Go-Analysts.html
Gold may have breached the 5th wave channel and already started up in subminuette wave ii towards the target of 1,130 in 3 days. Or if minuette wave (iv) then may not move above 1,167.49.
Great analysis lara..
Oil is acting the same way as u analysed..
Hattssoffff
Thanks.
I wish I could say the same for Gold.
If that bear count is correct we may see some pretty fast strong downwards movement. I need to find the bounces along the way down for us all and I need to get that right!
Proposed DUST buy zone later this week
Reminder Everyone: This Friday, Nov. 6 is Jobs Report/Non-Farm Payrolls 8:30 am ET / 5:30 am PT
Happy Trading !!!