
The trend was expected to be down.
Price continued lower.
Summary: Expect surprises to be to the downside as the middle of a big third wave may be approaching. Short term a new high above 1,114.45 and / or a green daily candlestick on either of Gold or Silver will indicate a correction against the trend has arrived. The upcoming correction may last about three days and possibly longer. The trend is down. Expect that the trend remains the same until proven otherwise. The target for a third wave to end is at 1,080.
To see weekly charts click here.
New updates to this analysis are in bold.
BEAR ELLIOTT WAVE COUNT
Click chart to enlarge.
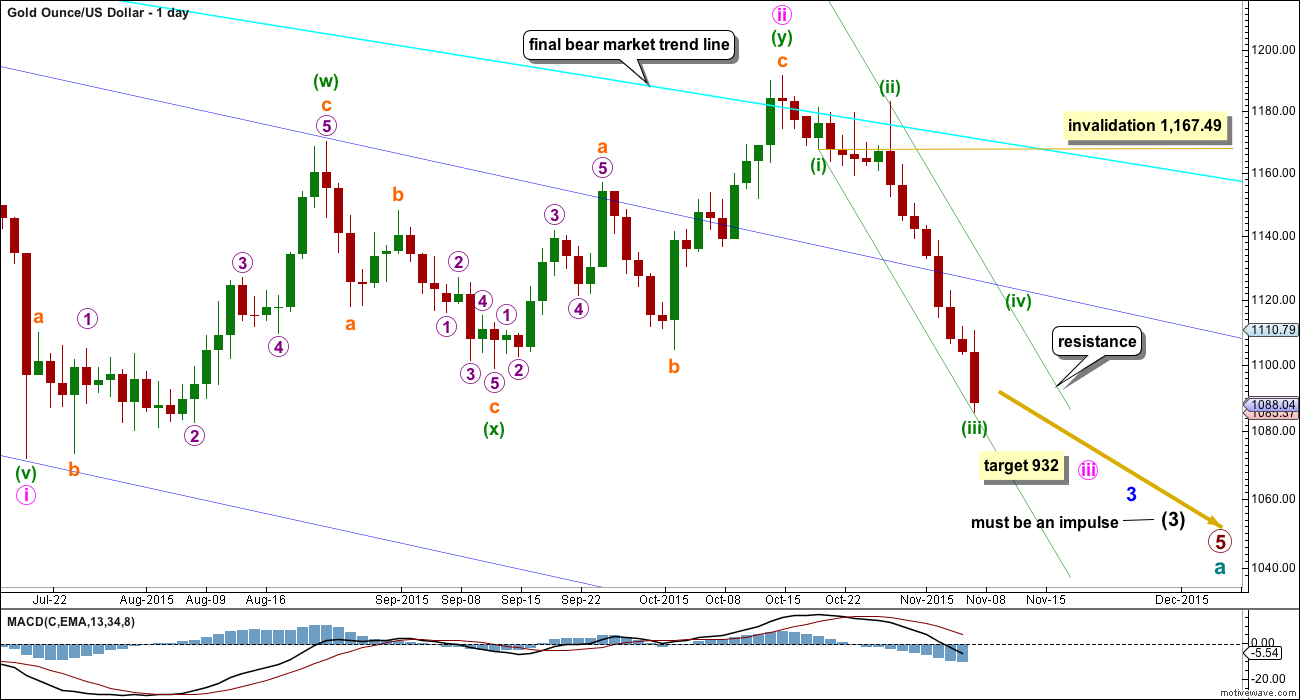
Gold has been in a bear market since September 2011. There has not yet been confirmation of a change from bear to bull, and so at this stage any bull wave count would be trying to pick a low which is not advised. Price remains below the 200 day moving average and below the final bear market trend line (copied over from the weekly chart). The bear market should be expected to be intact until we have technical confirmation of a big trend change.
The final line of resistance (bright aqua blue line copied over from weekly charts) is only overshot and not so far properly breached. While this line is not breached the bear wave count will remain possible. Simple is best, and the simplest method to confirm a trend change is a trend line.
Minute wave ii is a complete double zigzag and deep at 0.75 the length of minute wave i. It has breached the dark blue base channel drawn about minor waves 1 and 2, one degree higher. When a lower degree second wave correction does this it reduces the probability of the wave count but does not invalidate it. Base channels most often work to show where following corrections find support or resistance, but not always.
At 932 minute wave iii would reach 1.618 the length of minute wave i.
Gold often exhibits swift strong fifth waves, particularly its fifth waves within its third waves. When price moves towards subminuette wave v of minuette wave (iii) it may be explosive. For this wave count look out for surprises to be to the downside.
At 1,080 minuette wave (iii) would reach 4.236 the length of minuette wave (i).
Draw a channel about this downwards movement using Elliott’s first technique: draw the first trend line from the end of minuette wave (i) to the last low which may be minuette wave (iii), then place a parallel copy on the high of minuette wave (ii). Keep redrawing the channel as price moves lower. When minuette wave (iv) arrives, it may find resistance at the upper edge of the channel.
Minuette wave (iv) may not move into minuette wave (i) price territory above 1,167.49.
Today I have three hourly wave counts. The first two wave counts expect downwards movement to continue for Monday. The third wave count looks at the possibility that a fourth wave correction may begin Monday. These wave counts are presented in the order they were developed, not in order of preference or probability.
FIRST HOURLY CHART
Click chart to enlarge.
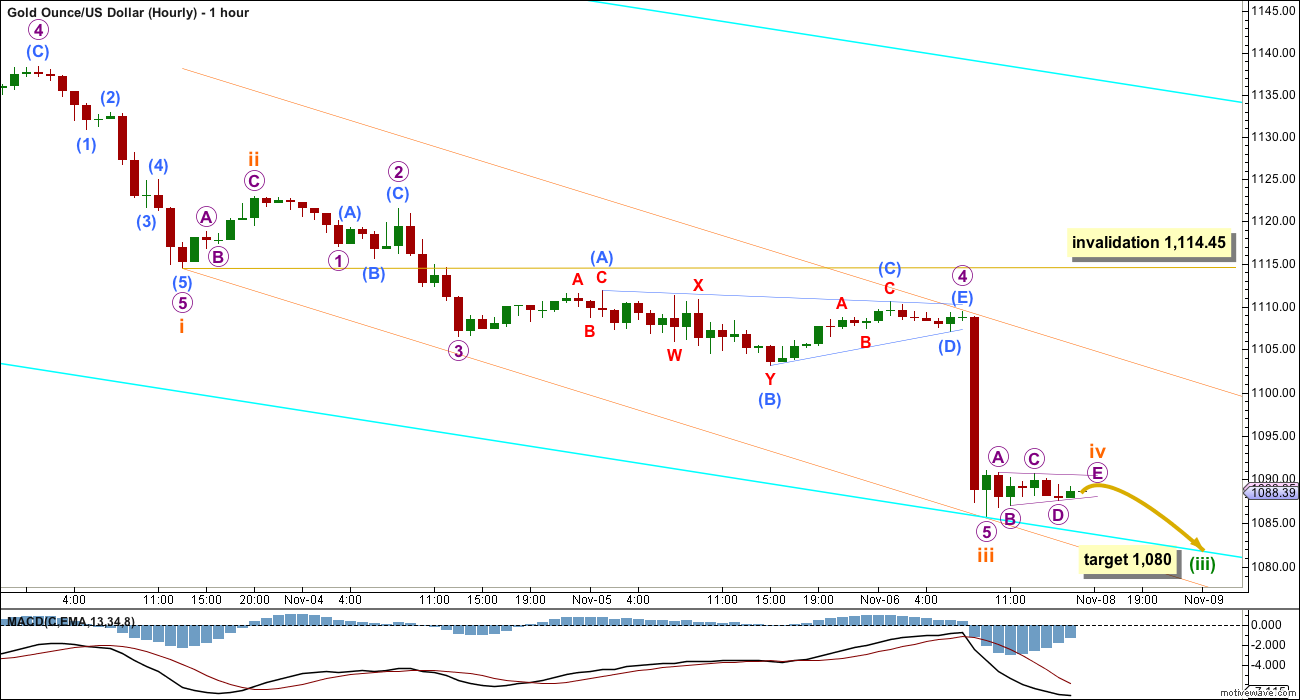
Minuette wave (iii) may be close to completion needing only a final fifth wave down to end it. Sideways movement at the end of Friday’s session does look like it may be a very small shallow triangle. If the triangle holds, then a short fifth wave down may follow to complete the impulse for minuette wave (iii). Gold’s fifth waves out of its fourth wave triangles can be surprisingly short and brief.
Ratios within subminuette wave i are: micro wave 3 is 0.97 short of equality in length with micro wave 1, and micro wave 5 has no Fibonacci ratio to either of micro waves 1 or 4. There is good alternation between the shallow zigzag of micro wave 2 and the more shallow flat correction of micro wave 4. Micro wave 3 is stronger than micro wave 1, and micro wave 5 is strongest. This looks like a typical impulse for gold.
At 1,080 minuette wave (iii) would reach 4.236 the length of minuette wave (i).
The invalidation point is at 1,114.45 while subminuette wave iv is incomplete. Subminuette wave iv may not move into subminuette wave i price territory. As soon as subminuette wave iv may be complete and a new low may be submiuette wave v the invalidation point no longer applies.
SECOND HOURLY CHART
Click chart to enlarge.
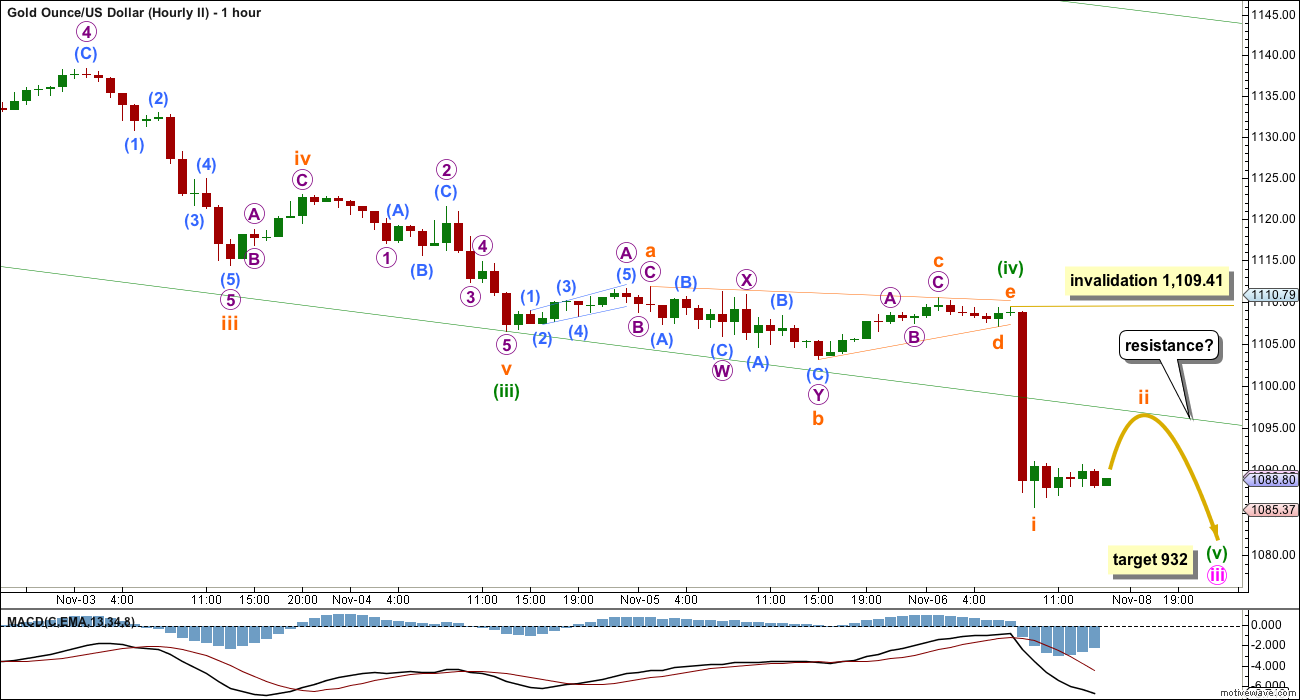
This wave count follows on directly from yesterday’s second wave count. Minuette wave (iv) may have completed as a running contracting triangle, which may have been over much more quickly than expected. Sometimes within Gold’s third wave impulses the fourth wave is more brief and shallow than usual, from the strong downwards pull of a strong fifth wave. This wave count expects explosive downwards movement to unfold towards the target.
At 932 minute wave iii would reach 1.618 the length of minute wave i.
Ratios within minuette wave (iii) are: subminuette wave iii is 1.3 short of 1.618 the length of subminuette wave i, and subminuette wave v has no Fibonacci ratio to either of subminuette waves i or iii. There is little alternation between subminuette waves ii and iv: subminuette wave ii is a shallow 0.34 zigzag with a long A wave and short C wave and subminuette wave iv is a more shallow 0.13 zigzag with a short A wave and a long C wave.
Although there is not perfect alternation between subminuette waves ii and iv (the biggest problem with this wave count), seeing the correction labelled subminuette wave iv as a fourth wave and not a second wave (as the first wave count does) makes more sense.
The correction labelled minuette wave (iv) fits perfectly as a running contracting triangle. It cannot be a second wave because a second wave may not solely subdivide as a triangle.
THIRD HOURLY CHART
Click chart to enlarge.
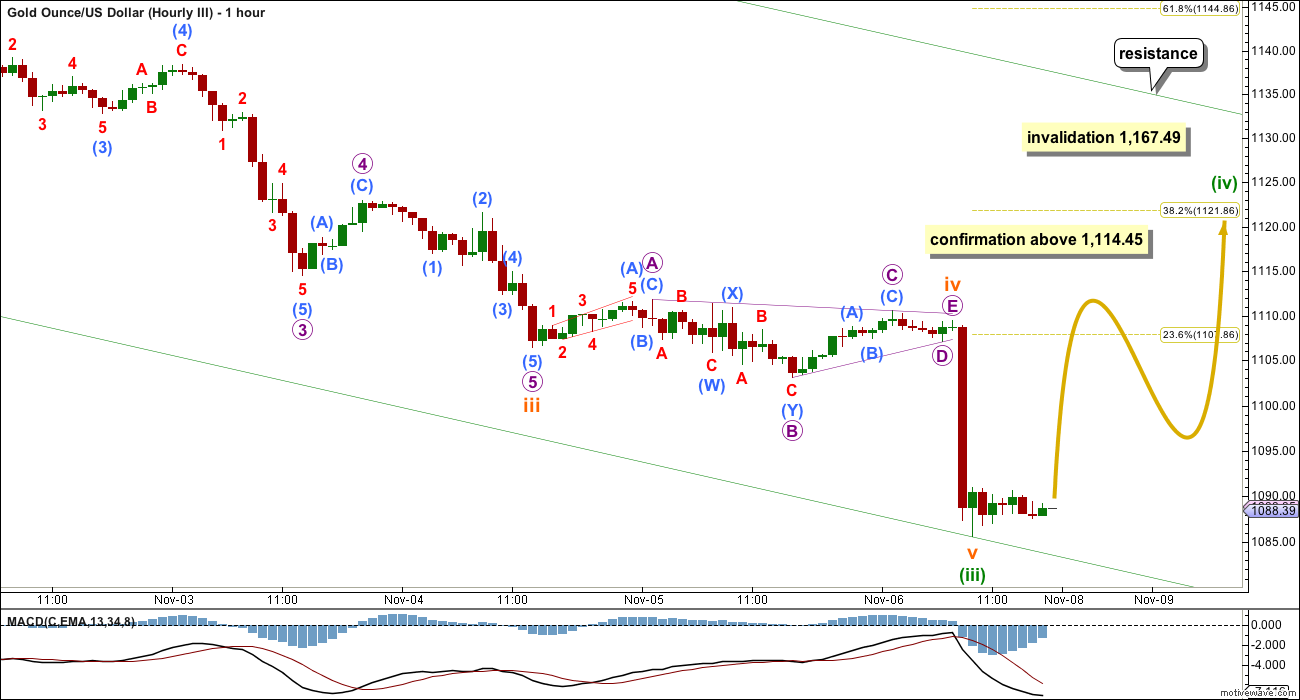
Ratios within minuette wave (iii) are: there is no Fibonacci ratio between subminuette waves i and iii, and subminuette wave v is 2.30 longer than 0.382 the length of subminuette wave iii. Subminuette wave ii is a shallow 0.34 zigzag. Subminuette wave iv exhibits perfect alternation as a more shallow 0.05 running contracting triangle.
Subminuette wave v was a swift strong movement, a price shock to the downside. It has slightly stronger momentum than subminuette wave iii which is typical for Gold’s fifth waves to end its third waves.
This wave count requires confirmation. At this stage, with the middle of a third wave approaching, and with fifth waves within third waves approaching, surprises will be to the downside. The strongest downwards momentum is still ahead of us. The trend is down. Assume the trend remains down until proven otherwise. Corrections may be used as an opportunity to join the trend.
A new high above 1,114.45 would invalidate both the first two hourly wave counts. At that stage, a multi day correction may be expected to have begun.
Minuette wave (iv) may be choppy and overlapping, one of 23 possible corrective structures. It is most likely to exhibit alternation with minuette wave (ii).
Minuette wave (ii) was a deep 0.65 expanded flat lasting six days. Minuette wave (iv) may be shallow, most likely ending at either the 0.236 or 0.382 Fibonacci ratios. It would most likely be a zigzag or triangle. It may be quicker than minuette wave (ii) due to the strong downwards pull of minuette wave (v) to come, and may last most likely a Fibonacci three days and possibly (less likely) a Fibonacci five.
TECHNICAL ANALYSIS
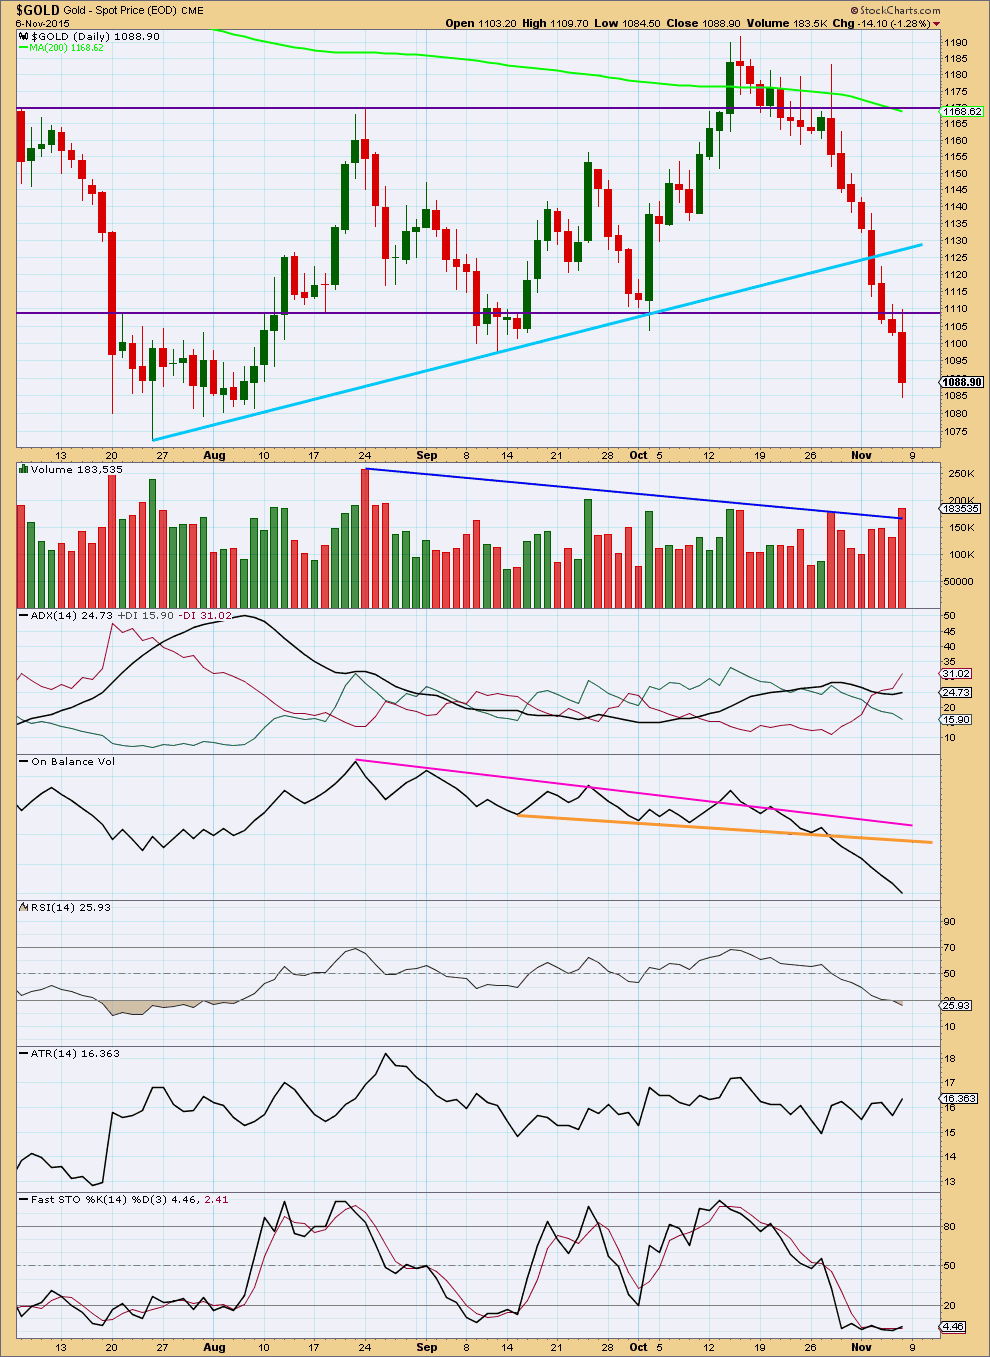
Click chart to enlarge. Chart courtesy of StockCharts.com.
Daily: Downwards movement for Friday shows a reasonable increase in volume and RSI is just oversold. Downwards movement may be interrupted here or very soon, within another two days at the most possibly.
The fall in price is supported by volume. With Friday’s candlestick breaking well below the lower horizontal support line and doing so on increased volume, this looks like a downwards breakout.
ADX is finally indicating a downwards trend is in place. ATR somewhat agrees that a trend may be in place because it is slightly moving higher.
RSI has just reached oversold on Friday. This indicates a correction should come, either here or within a very few days.
Stochastics as been flat for the last six days as price trends strongly lower. This divergence indicates some upwards movement should begin soon.
This regular technical analysis supports the Elliott wave count. The trend is down and a correction against the trend is indicated to begin here or very soon.
This analysis is published about 07:39 p.m. EST.
Hi,
at this stage it looks like count 1 or 2 might be right?
Thanks, I think hourly II is correct.
There are still three hours to go for this session, but so far it looks like Monday’s candlestick will be green.
If that is the case then the third hourly wave count will be favoured. It expects the bounce has arrived, to continue for at least two more days and reach up to 1,108 (0.236 Fibonacci ratio) or 1,122 (0.382 Fibonacci ratio).
If this is a fourth wave which turns out to be a triangle or combination it may last longer than three days.
But with the end of a third wave approaching, and minuette wave (v) expected to be very explosive to the downside, it may pull minuette wave (iv) down and force it to be more brief than it may otherwise be. Gold does that a lot.
Precious Metals Sector Due for Bounce but…
11/06/2015 | Jordan Roy-Byrne, CMT
http://thedailygold.com/precious-metals-sector-due-for-bounce-but/
Money Managers Cut Net-Long Positioning In Gold, Silver Futures–CFTC Data
Monday November 09, 2015 10:37
http://www.kitco.com/news/2015-11-09/Money-Managers-Cut-Net-Long-Positioning-In-Gold-Silver-Futures-CFTC-Data.html
According to Lara’s wave counts three price points to watch in next 24 hours:
>1109.41 second hourly wave count is invalidated.
>1114.45 First hourly wave count is invalidated.
Gold higher than 1114.45 the third wave count is in play. Which has the low probability???
I presented them in the order I developed them, not in order of probability. On that I sit on the fence and will let price tell us which one is correct.
At this stage it looks like the third one is now more likely because Monday’s candlestick is completing green.
Thanks Lara. Appreciate you insight.
“The final collapse or final capitulation in Gold that has eluded us for a few years appears to be in motion. After an oversold bounce, Gold should test support at $1080/oz and finally threaten the key $1000/oz support level. Last week we warned:.”
http://thedailygold.com/precious-metals-sector-due-for-bounce-but/
Gold COT – commercial shorts lightened up a bit this past week. Maybe time for a small bounce?
Trading Short on Dan’s Silver COT analysis has been Fun and profitable.
http://traderdan.com/?p=7846