
Last week’s analysis had three Elliott wave counts. Since then one Elliott wave count has been invalidated.
There are now only two Elliott wave counts. The situation is becoming clearer for Silver.
Summary: The correction which was expected to turn up last week has still not shown up for Silver. A correction against the trend will show up and then be followed by more downwards movement. The trend at this stage is still down for both wave counts.
New updates to this analysis are in bold.
WAVE COUNT #1
Click chart to enlarge.
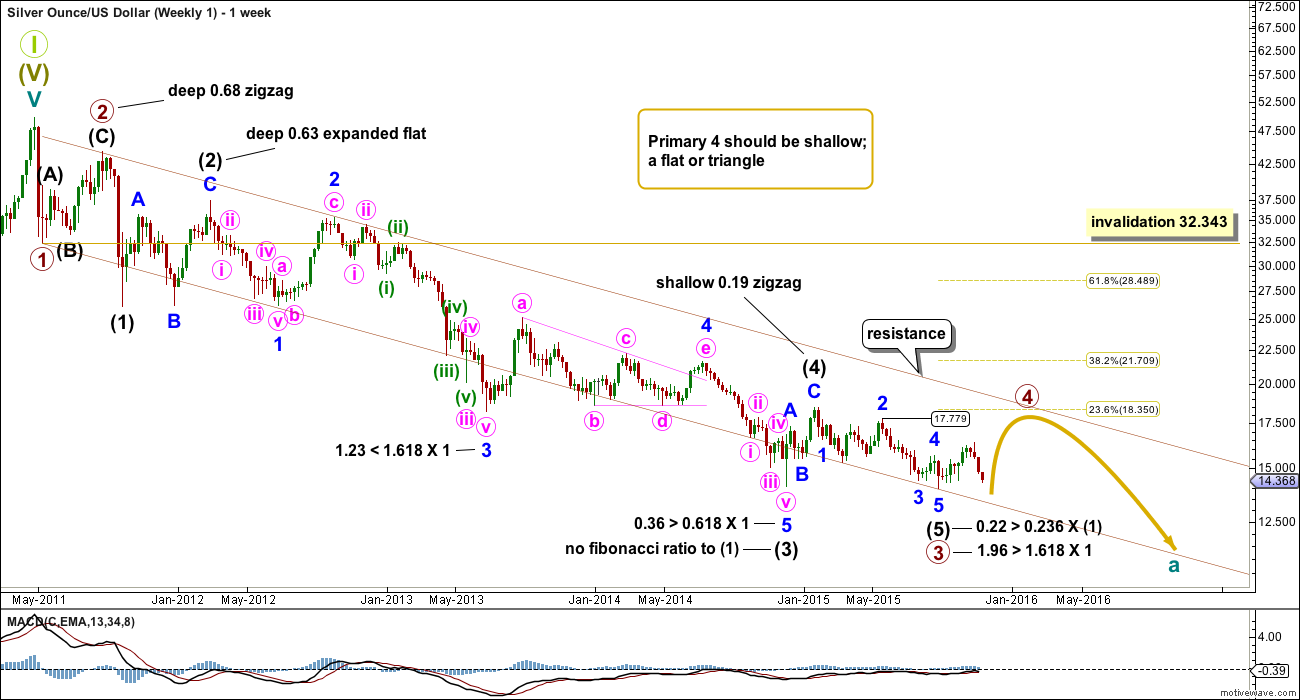
This first wave count sees a 5-3-5 complete downwards for primary waves 1, 2 and 3.
The channel (maroon) drawn about this downwards movement is drawn using Elliott’s first technique. Draw the first trend line from the lows labelled primary waves 1 to 3, then place a parallel copy on the high of primary wave 2. Primary wave 4 may find resistance at the upper edge of the channel.
Primary wave 2 was a deep single zigzag. Given the guideline of alternation expect primary wave 4 to be shallow and a flat, combination or triangle.
There are multiple structural possibilities for primary wave 4. It is impossible to tell which structure will unfold, only that it is most unlikely to be a zigzag or zigzag multiple. If it is an expanded flat, running triangle or combination, it may include a new price extreme beyond its start, so it may include a new low below 13.983.
At this stage, the idea of a combination may be eliminated at the daily chart level. The reasoning for this is explained underneath the daily chart.
Intermediate wave (1) lasted a Fibonacci 5 weeks; intermediate wave (2) was 22 weeks, just one more than a Fibonacci 21; intermediate wave (3) was exactly a Fibonacci 144 weeks; and, intermediate wave (5) was 31 weeks, three short of Fibonacci 34.
Primary wave 2 lasted 15 weeks. Primary wave 4 is expected to be longer lasting because zigzags are quicker than combinations, triangles and even flats. Primary wave 4 may total a Fibonacci 21 or 34 weeks, give or take up to three weeks either side of these expectations.
Primary wave 4 may not move into primary wave 1 price territory above 32.343.
Click chart to enlarge.
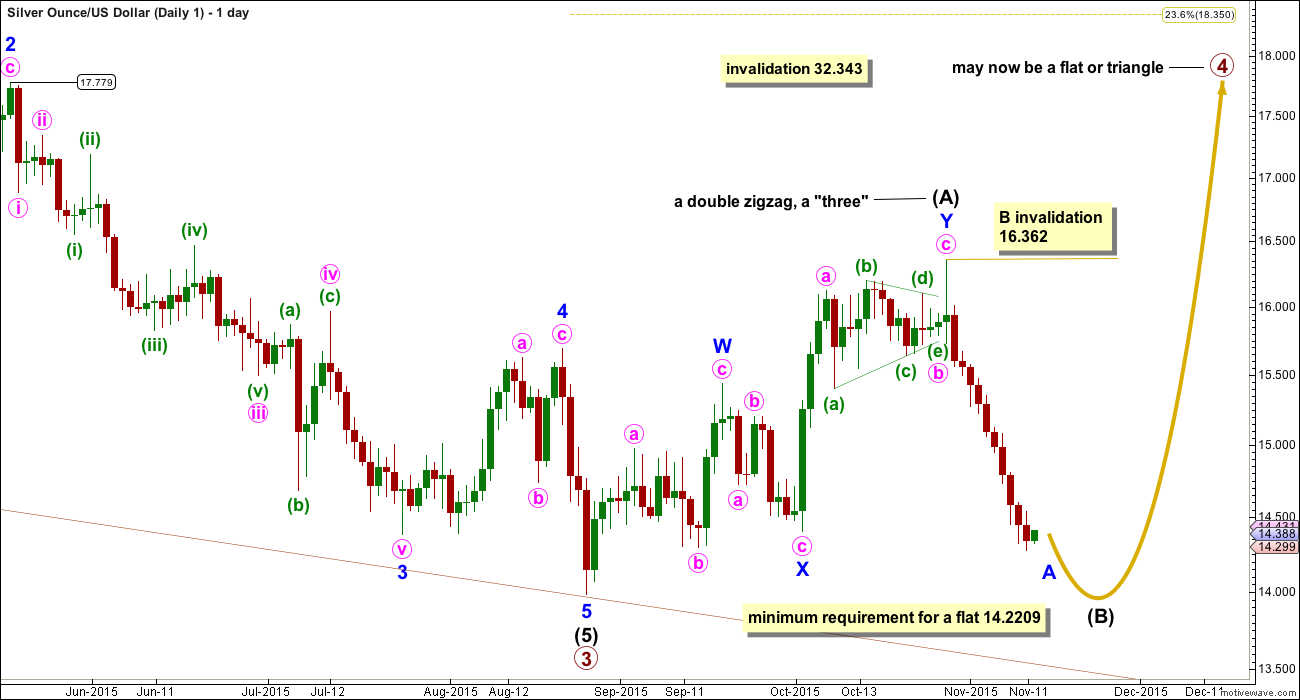
All wave counts will show daily charts from the price point marked at 17.779 which was 18th May, 2015.
Upwards movement for intermediate wave (A) is a completed double zigzag. This is termed a “three”, a corrective structure.
If primary wave 4 is a triangle, then one of the five sub waves may be a double zigzag. This may have been intermediate wave (A) of a triangle.
If primary wave 4 is a flat correction, then intermediate wave (A) must be a corrective structure and may have been a double zigzag.
Primary wave 4 may not be a combination, if the first structure is a double zigzag. Within multiples each corrective structure of W and Y (and Z if there is one) may only themselves subdivide as simple corrective structures (labelled A-B-C, or A-B-C-D-E in the case of a triangle). The maximum number of corrective structures within a multiple (excluding the joining X waves) is three. And so to label multiples within multiples extends the maximum beyond three violating an Elliott wave rule.
If primary wave 4 is unfolding as a flat correction, then within it intermediate wave (B) must reach a minimum 90% length of intermediate wave (A) at 14.2209. Intermediate wave (B) must be a corrective structure and may make a new low below the start of intermediate wave (A) as in an expanded flat. There is no lower invalidation point for this wave count at this stage for that reason.
If primary wave 4 is unfolding as a triangle, then intermediate wave (B) within it has no minimum requirement, must be a corrective structure, and may also make a new low below the start of intermediate wave (A) as in a running triangle.
Intermediate wave (B) is still incomplete and looks like it is unfolding as a zigzag. Along the way down, minor wave B is likely to turn up as at least one green candlestick or doji on the daily chart, and most likely it will last a few days. Minor wave B may not move beyond the start of minor wave A above 16.362.
WAVE COUNT #2
Wave count #2 was invalidated last week.
WAVE COUNT #3
Click chart to enlarge.
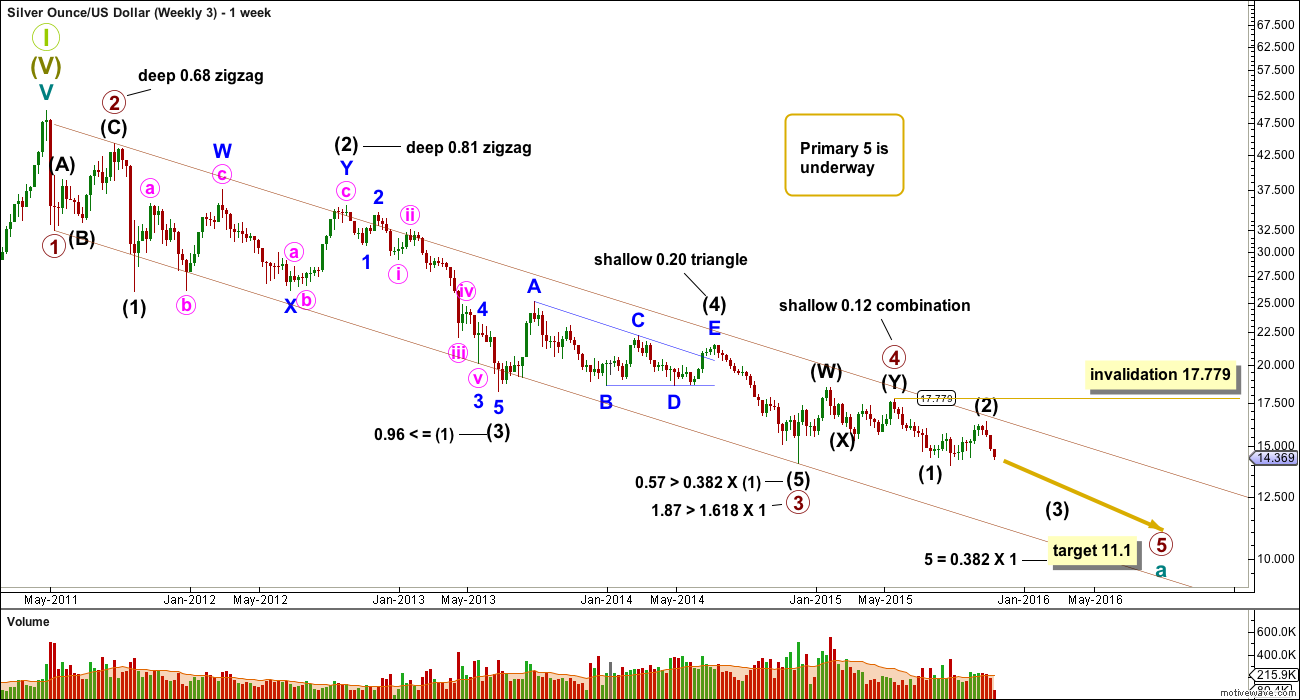
Primary wave 4 may be complete and primary wave 5 may be underway.
Primary waves 2 and 4 exhibit perfect alternation and good proportion: primary wave 2 was a deep zigzag lasting 15 weeks and primary wave 4 was a shallow combination lasting 24 weeks, 1.618 the duration of primary wave 2.
At 11.1 primary wave 5 would reach 0.382 the length of primary wave 1.
Although this wave count is labelled #3 it is my preferred wave count. I am presenting them in the order in which I developed each, not in order of preference. This wave count is preferred primarily for the reason that there has been no technical confirmation of a trend change from bear to bull for Silver.
Intermediate wave (2) may not move beyond the start of intermediate wave (1) above 17.779. A breach of this invalidation point would now also require a strong breach of the bear market channel, so this invalidation point should not be moved any higher. When that channel is breached that should indicate a trend change for Silver from bear to bull. At that stage, only bullish wave counts should be seriously considered.
Click chart to enlarge.
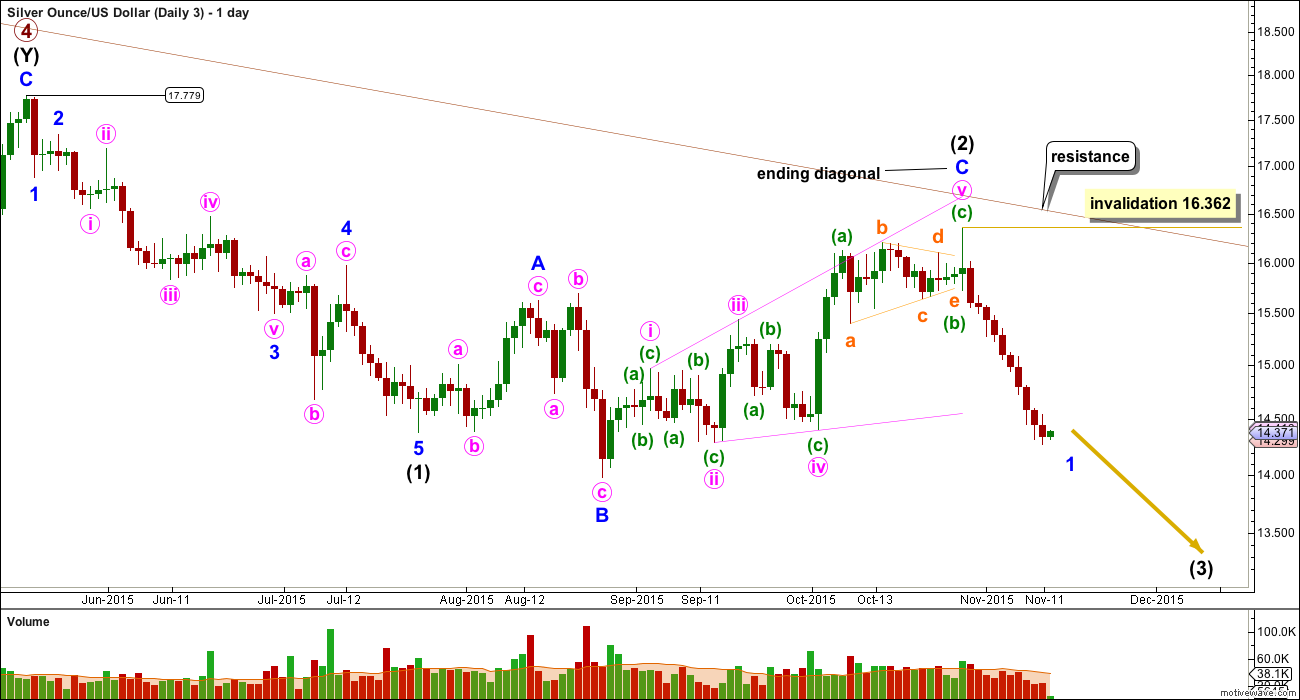
The upper edge of the maroon channel is copied over here from the weekly chart. It should provide resistance if Silver is still within a bear market. If that trend line is clearly breached, then this wave count should be discarded.
Intermediate wave (3) is now underway. This wave count for Silver is the equivalent of the bear wave count for Gold. Gold has confirmed its bear wave count, so the probability for this wave count for Silver has increased.
A green daily candlestick would indicate the start of a second wave correction for minor wave 2. At that stage, a Fibonacci retracement should be drawn on the completed length of minor wave 1. The 0.382 and 0.618 Fibonacci ratios would be targets, with the 0.618 Fibonacci ratio favoured. Minor wave 2 may last a minimum three days, and possibly several more. It may not move beyond the start of minor wave 1 above 16.362.
TECHNICAL ANALYSIS
WEEKLY CHART
Click chart to enlarge. Chart courtesy of StockCharts.com.
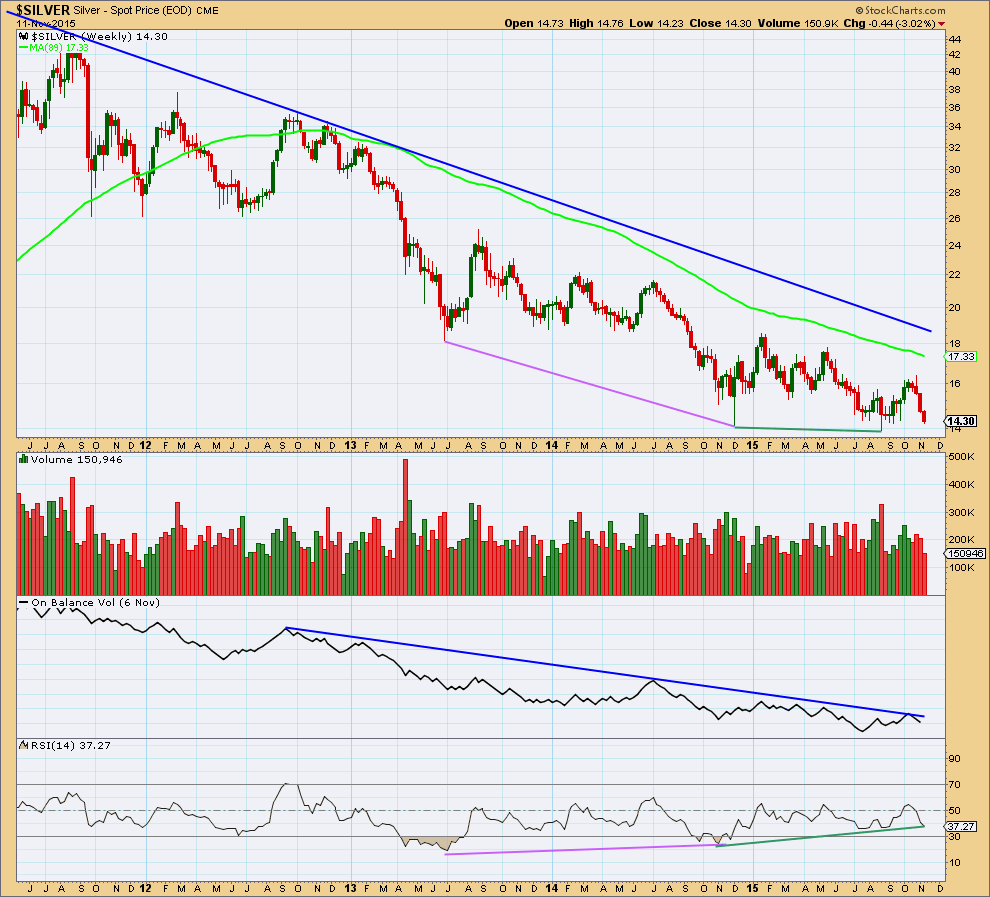
Silver has been in a bear market since April 2011. I am adjusting the length of the weekly moving average, so that it shows where this bear market has been finding resistance. The 89 week (a Fibonacci number) Simple Moving Average works well for this bear market. If that is breached by a weekly candlestick, it would be strong indication that Silver has changed from bear to bull.
Overall, while Silver has been in a bear market, volume is declining which indicates the bear trend is maturing, a change to a bull market is closer. Volume will not tell us exactly when that change comes though. It is a warning sign only.
Of recent weeks, strongest volume is for a downwards week. This is bearish.
On Balance Volume remains below a long held trend line. This trend line is somewhat shallow, repeatedly tested, and reasonably technically significant. While OBV remains below that trend line it will remain bearish.
RSI shows strong double divergence with price over a long time period (pink and green lines on price and RSI). While price made new lows RSI failed to make new lows. This indicates weakness in downwards movement and is bullish. Because this divergence is double and over such a long time period it is highly technically significant. This indicator is often leading (anticipates a trend change). The first two bull wave counts must be seriously considered for this reason.
The regular technical analysis picture is unclear at the weekly chart level. A trend change will come and RSI is indicating it may come sooner or have arrived already. It needs to be confirmed by price, and a break above the blue bear market trend line would be full and final confirmation of a trend change.
DAILY CHART
Click chart to enlarge. Chart courtesy of StockCharts.com.
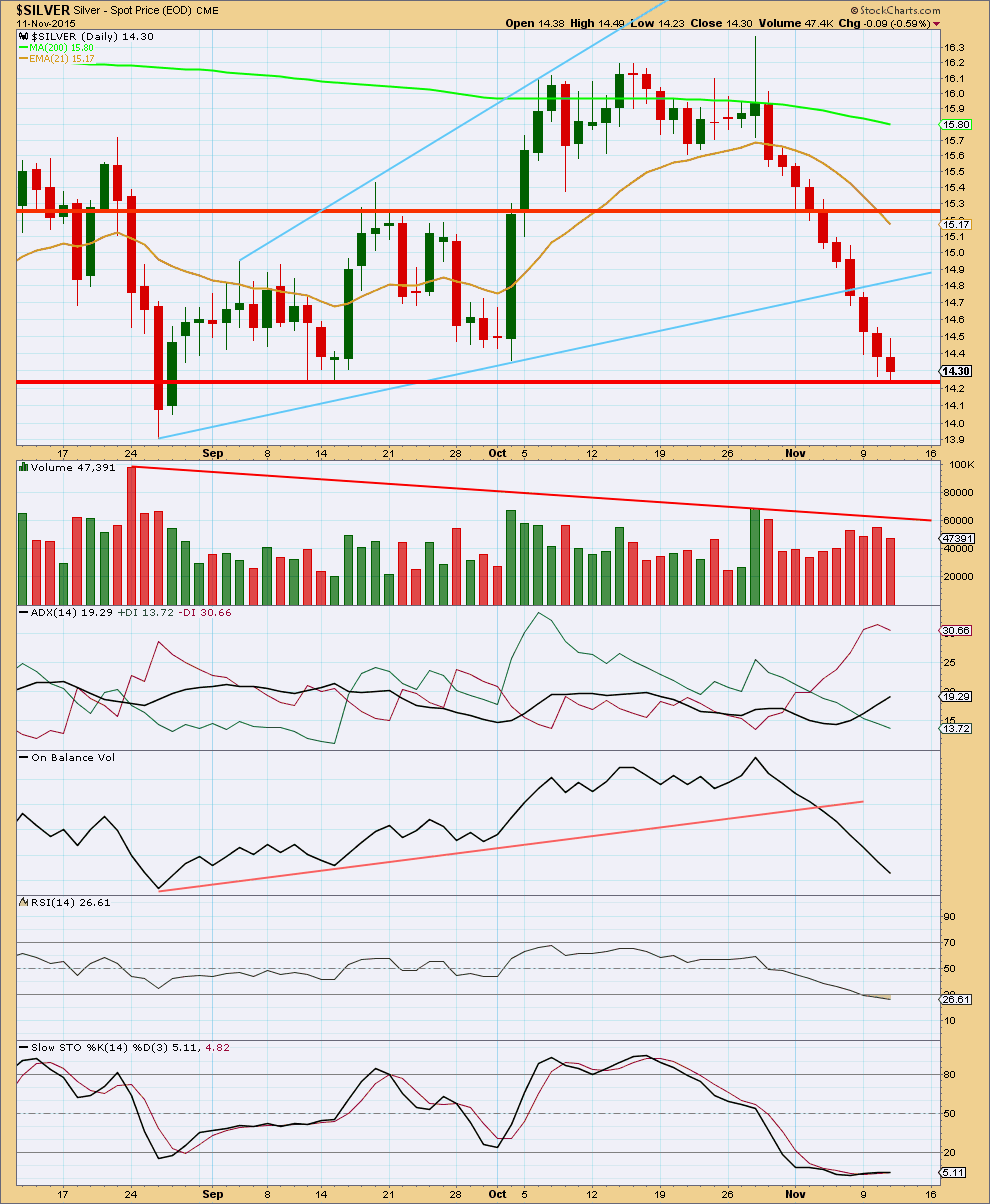
Downwards movement in price is now supported by increasing volume. Price may find support at the horizontal trend line from a prior swing low.
ADX now clearly indicates a downwards trend is in place.
On Balance Volume remains bearish.
RSI is slightly oversold but does not yet exhibit any divergence. A small correction about here may resolve this oversold state.
Stochastics remains oversold.
Stochastics can remain extreme for long periods while the market is trending.
This analysis is published about 03:59 a.m. EST.