
A correction was expected to have begun.
Price has moved sideways for the last week, typical of a correction.
Summary: It is most likely that the correction will end with a little upwards movement to about 14.887. Thereafter, the main wave count expects more downwards movement.
New updates to this analysis are in bold.
MAIN WAVE COUNT
Click chart to enlarge.
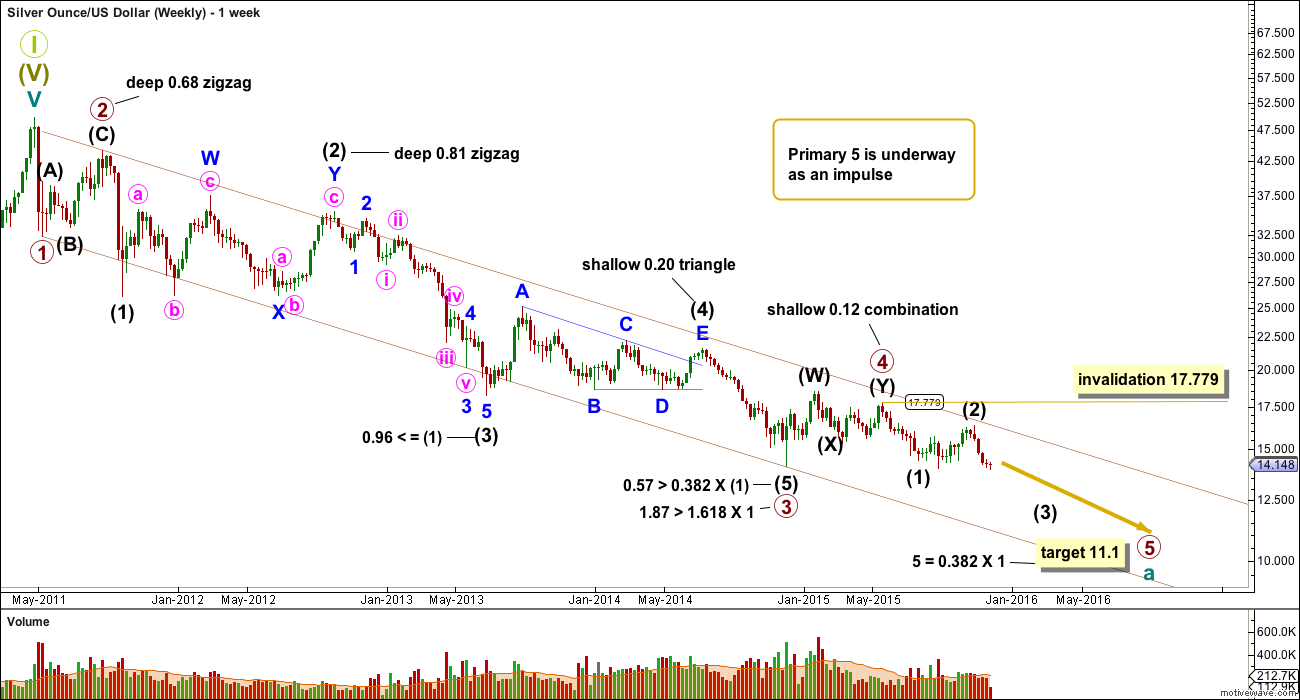
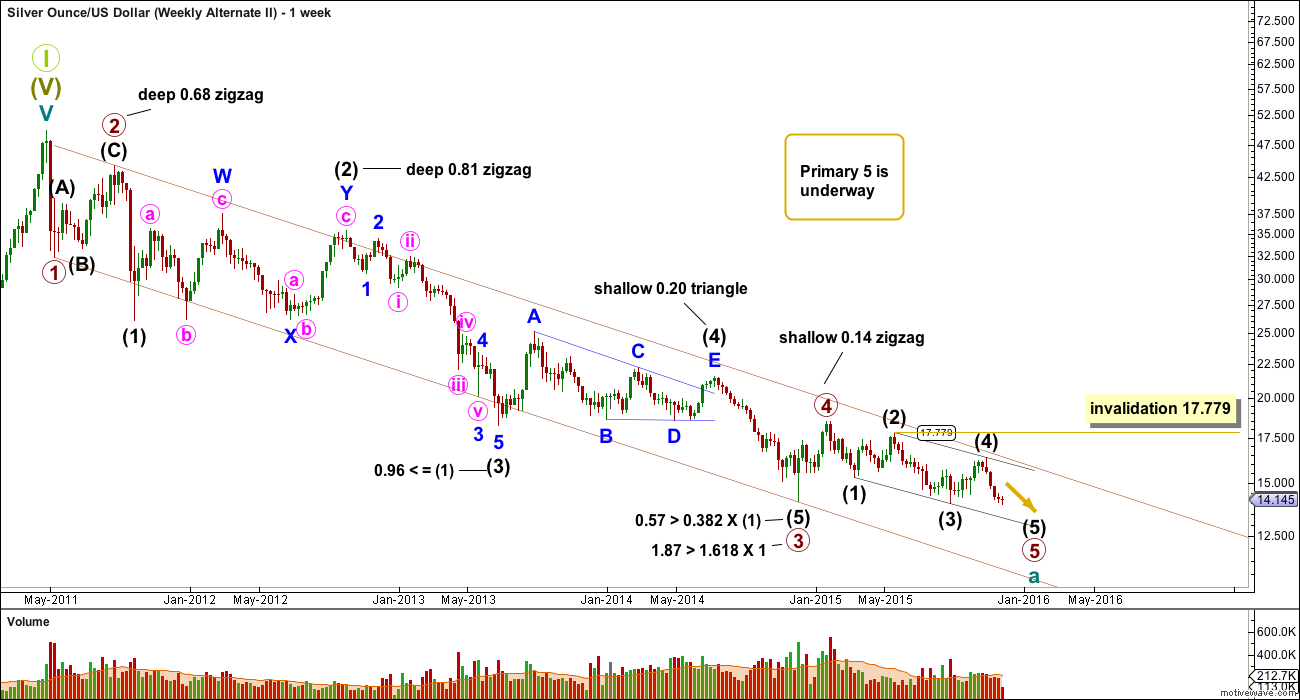
Primary wave 4 may be complete and primary wave 5 may be underway.
Primary waves 2 and 4 exhibit perfect alternation and good proportion: primary wave 2 was a deep zigzag lasting 15 weeks and primary wave 4 was a shallow combination lasting 24 weeks, 1.618 the duration of primary wave 2.
At 11.1 primary wave 5 would reach 0.382 the length of primary wave 1.
This wave count is preferred primarily for the reason that there has been no technical confirmation of a trend change from bear to bull for Silver.
Intermediate wave (2) may not move beyond the start of intermediate wave (1) above 17.779. A breach of this invalidation point would now also require a strong breach of the bear market channel, so this invalidation point should not be moved any higher. When that channel is breached that should indicate a trend change for Silver from bear to bull. At that stage, only bullish wave counts should be seriously considered.
Click chart to enlarge.
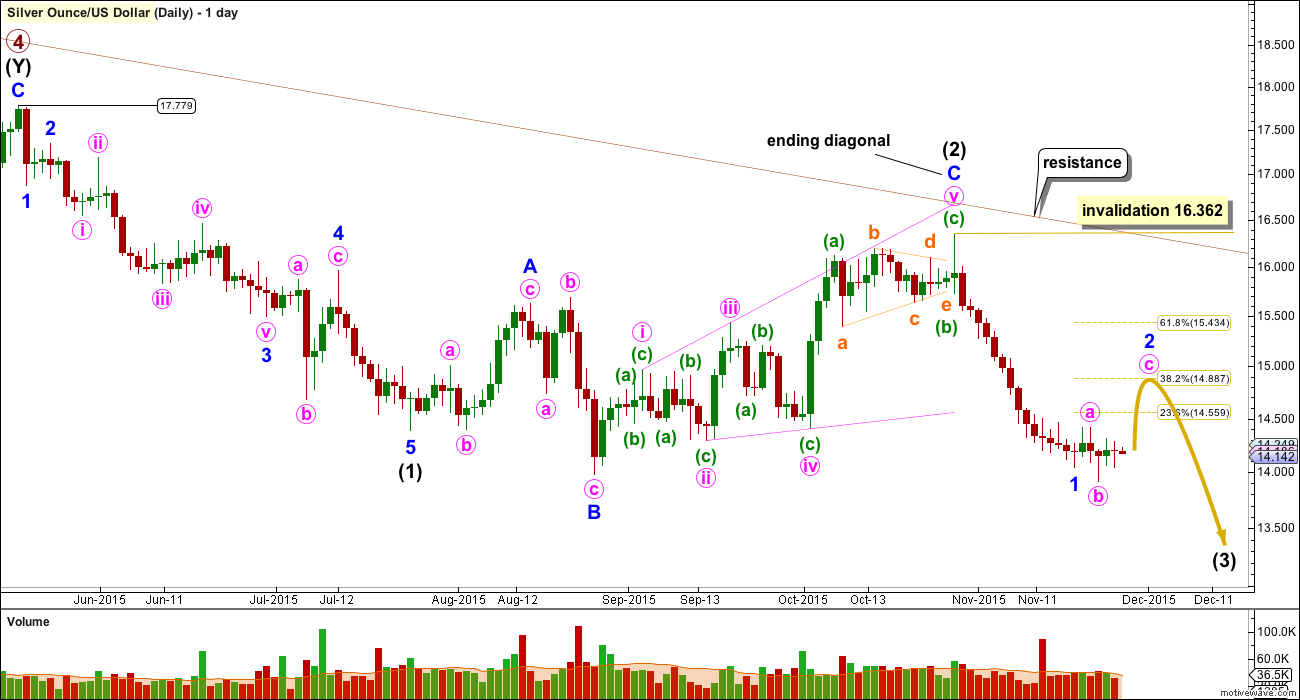
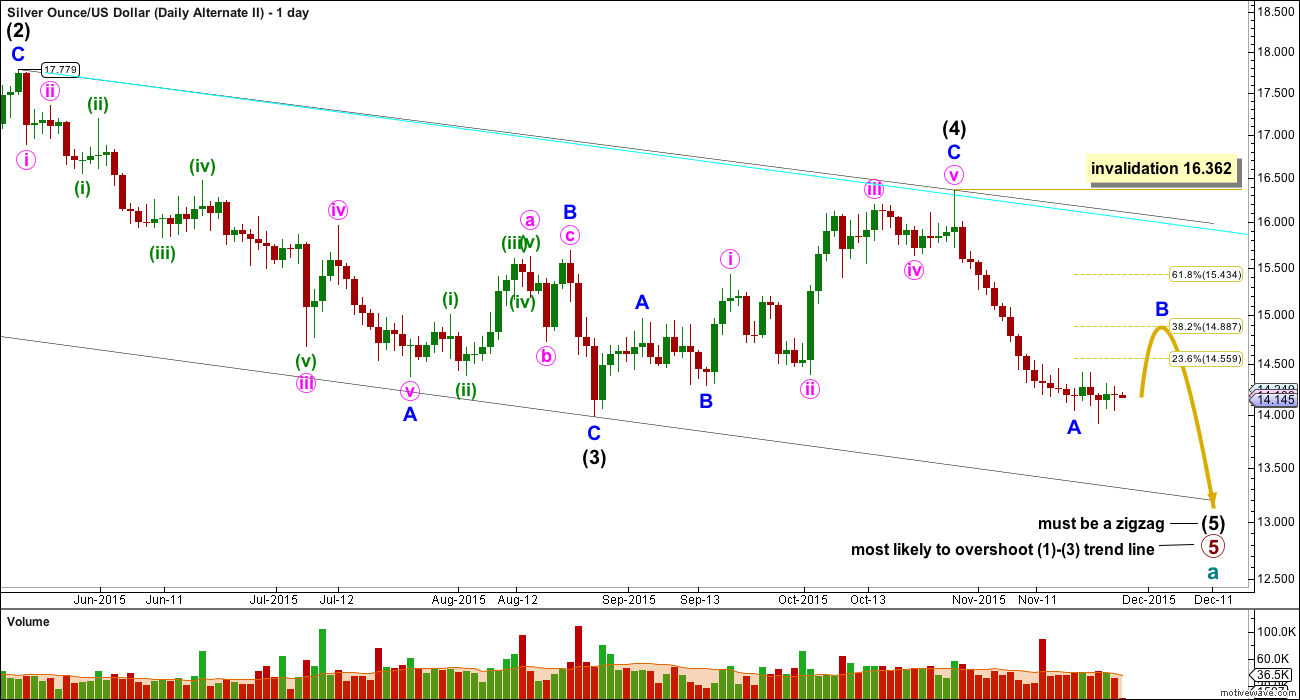
All wave counts will show daily charts from the price point marked at 17.779 which was 18th May, 2015.
The upper edge of the maroon channel is copied over here from the weekly chart. That trend line continues to provide strong resistance. The strength of the line is reinforced. Silver remains within a bear market.
Intermediate wave (3) is now underway. This wave count for Silver is the equivalent of the bear wave count for Gold.
Minor wave 2 is most likely incomplete as an expanded flat or combination. It may not move beyond the start of minor wave 1 above 16.362. It may end about the 0.382 Fibonacci ratio of minor wave 1 at 14.887.
This wave count is very bearish. When minor wave 2 is complete a third wave of a third wave down is expected to show a strong increase in downwards momentum.
FIRST ALTERNATE WAVE COUNT
Click chart to enlarge.
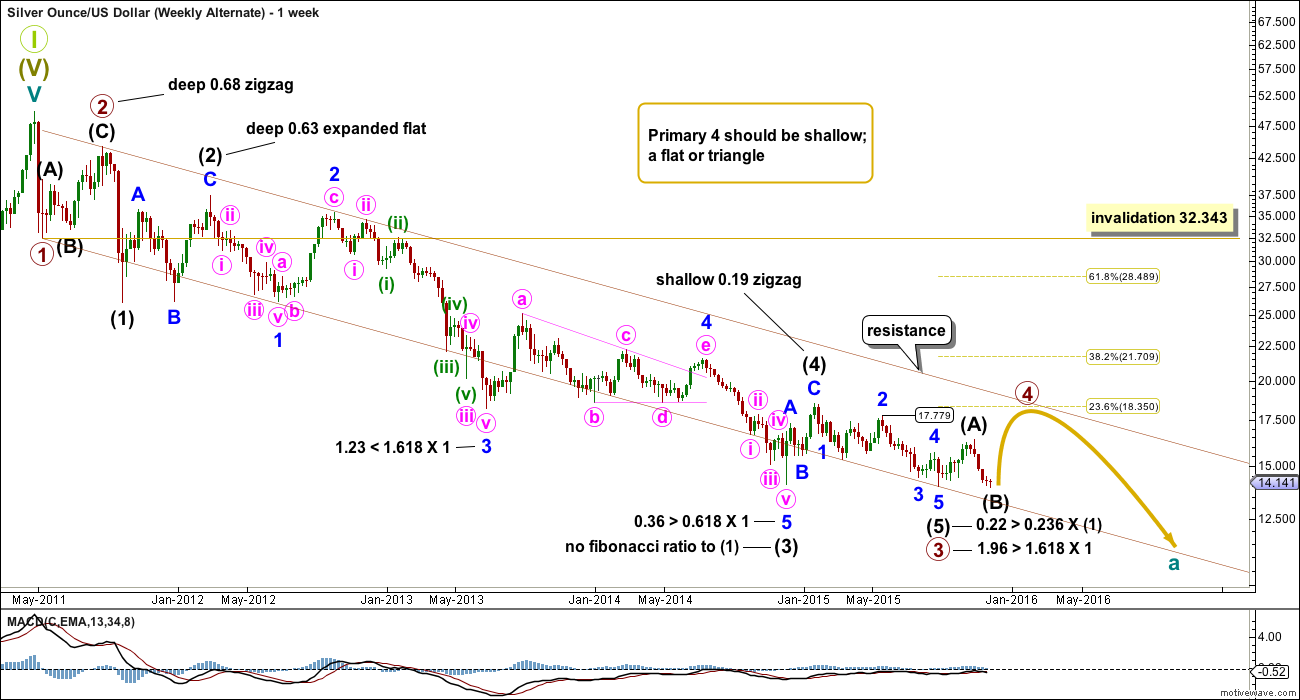
This wave count sees a 5-3-5 complete downwards for primary waves 1, 2 and 3.
The channel (maroon) drawn about this downwards movement is drawn using Elliott’s first technique. Draw the first trend line from the lows labelled primary waves 1 to 3, then place a parallel copy on the high of primary wave 2. Primary wave 4 may find resistance at the upper edge of the channel.
Primary wave 2 was a deep single zigzag. Given the guideline of alternation expect primary wave 4 to be shallow and a flat, combination or triangle.
There are multiple structural possibilities for primary wave 4. It is impossible to tell which structure will unfold, only that it is most unlikely to be a zigzag or zigzag multiple. If it is an expanded flat, running triangle or combination, it may include a new price extreme beyond its start, so it may include a new low below 13.983.
At this stage, the idea of a combination may be eliminated at the daily chart level. The reasoning for this is explained underneath the daily chart.
Intermediate wave (1) lasted a Fibonacci 5 weeks; intermediate wave (2) was 22 weeks, just one more than a Fibonacci 21; intermediate wave (3) was exactly a Fibonacci 144 weeks; and, intermediate wave (5) was 31 weeks, three short of Fibonacci 34.
Primary wave 2 lasted 15 weeks. Primary wave 4 is expected to be longer lasting because zigzags are quicker than combinations, triangles and even flats. Primary wave 4 may total a Fibonacci 21 or 34 weeks, give or take up to three weeks either side of these expectations.
Primary wave 4 may not move into primary wave 1 price territory above 32.343.
Click chart to enlarge.
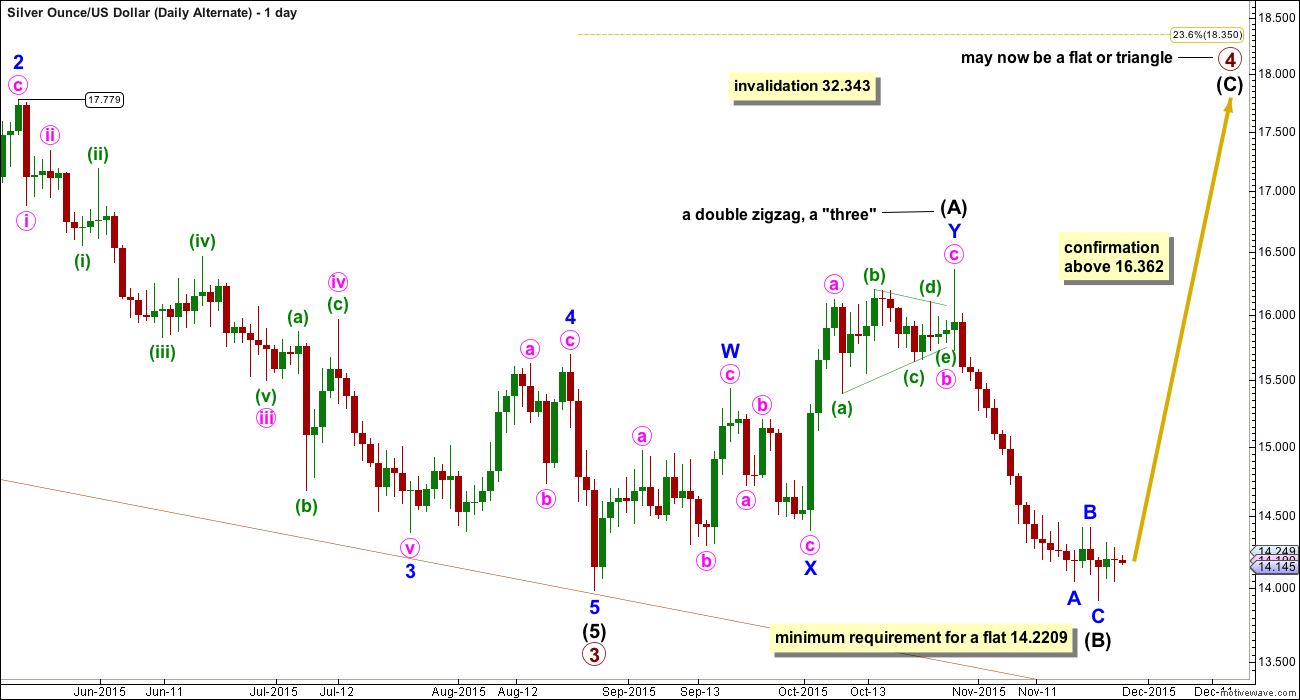
Upwards movement for intermediate wave (A) is a completed double zigzag. This is termed a “three”, a corrective structure.
If primary wave 4 is a triangle, then one of the five sub waves may be a double zigzag. This may have been intermediate wave (A) of a triangle.
If primary wave 4 is a flat correction, then intermediate wave (A) must be a corrective structure and may have been a double zigzag.
Primary wave 4 may not be a combination, if the first structure is a double zigzag. Within multiples each corrective structure of W and Y (and Z if there is one) may only themselves subdivide as simple corrective structures (labelled A-B-C, or A-B-C-D-E in the case of a triangle). The maximum number of corrective structures within a multiple (excluding the joining X waves) is three. And so to label multiples within multiples extends the maximum beyond three violating an Elliott wave rule.
If primary wave 4 is unfolding as a flat correction, then intermediate wave (B) has reached the minimum requirement of 90% the length of intermediate wave (A) at 14.2209. At this stage, it is not possible to confirm intermediate wave (B) as complete. It may be that minor wave B within it is incomplete and minor wave C may yet move lower.
If primary wave 4 is unfolding as a triangle, then intermediate wave (B) within it has no minimum requirement, must be a corrective structure, and may also make a new low below the start of intermediate wave (A) as in a running triangle.
At this stage, intermediate wave (B) could be seen as complete. A new high above 16.362 would invalidate the main wave count and confirm this first alternate.
SECOND ALTERNATE WAVE COUNT
Click chart to enlarge.
This second alternate wave count is identical to the first main wave count up to the high labelled primary wave 4. It sees primary wave 5 as underway. There are only two possible structures for a fifth wave within an impulse: either an impulse (main wave count) or an ending diagonal (this second alternate wave count).
My sole reason for publishing this idea is to see what the equivalent wave count to Gold’s alternate would look like for Silver. Here the problems are the same and worse. This wave count violates two Elliott wave rules.
If primary wave 5 is unfolding as an ending diagonal, then the diagonal should be contracting because the fourth wave at 2.379 is shorter than the second wave at 2.482. But the third wave length at 3.796 is longer than the first wave at 3.190.
From “Elliott Wave Principle” by Frost and Prechter, 10th edition, page 88, rules for diagonals: “In the contracting variety, wave 3 is always shorter than wave 1, wave 4 is always shorter than wave 2, and wave 5 is always shorter than wave 3.”
Further, another rule states “Going forward in time, a line connecting the ends of waves 2 and 4 converges towards (in the contracting variety)… a line connecting the ends of waves 1 and 3”.
On the daily chart (below) I have drawn a parallel copy of the 1-3 trend line in cyan and placed it on the end of intermediate (2). This is done to illustrate that the diagonal trend lines slightly diverge; they do not converge.
This structure violates these two rules of a contracting diagonal. It also would violate the rule of wave lengths for an expanding diagonal: intermediate wave (4) is not longer than intermediate wave (2).
I am very uncomfortable with publishing a wave count which violates Elliott wave rules. Due to the multiple violations I have no confidence in this wave count; it is not Elliott wave. The sole reason for publishing it is to consider the equivalent to the alternate published for Gold.
Click chart to enlarge.
Because this wave count violates two Elliott wave rules I have nothing further to add. It should not be used.
TECHNICAL ANALYSIS
WEEKLY CHART
Click chart to enlarge. Chart courtesy of StockCharts.com.
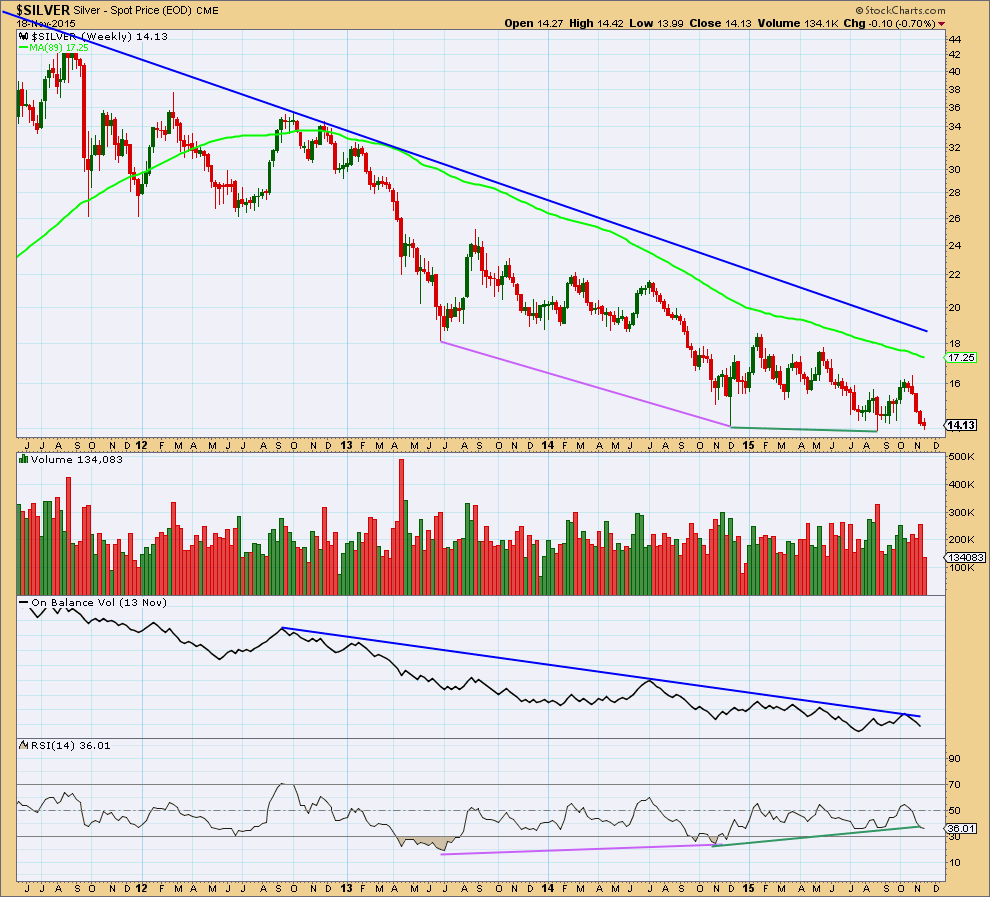
Silver has been in a bear market since April 2011. I am adjusting the length of the weekly moving average, so that it shows where this bear market has been finding resistance. The 89 week (a Fibonacci number) Simple Moving Average works well for this bear market. If that is breached by a weekly candlestick, it would be strong indication that Silver has changed from bear to bull.
Of recent weeks, strongest volume is for a downwards week. This is bearish. As price fell, from the end of October, volume has risen. The fall in price is supported currently by volume. The slight new low this week for Silver continues the bear market. However, the new low in price was not accompanied by a new low for On Balance Volume. This indicates some weakness in price. I have not found OBV to be a reliable indicator for divergence, but it does seem to work better with trend lines though.
On Balance Volume remains below a long held trend line. This trend line is somewhat shallow, repeatedly tested, and reasonably technically significant. While OBV remains below that trend line it will remain bearish.
RSI shows strong double divergence with price over a long time period (pink and green lines on price and RSI). While price made new lows RSI failed to make new lows. This indicates weakness in downwards movement and is bullish. Because this divergence is double and over such a long time period it is highly technically significant. This indicator is often leading (anticipates a trend change). The first two bull wave counts must be seriously considered for this reason.
The regular technical analysis picture is unclear at the weekly chart level. A trend change will come and RSI is indicating it may come sooner or have arrived already. It needs to be confirmed by price, and a break above the blue bear market trend line would be full and final confirmation of a trend change.
DAILY CHART
Click chart to enlarge. Chart courtesy of StockCharts.com.
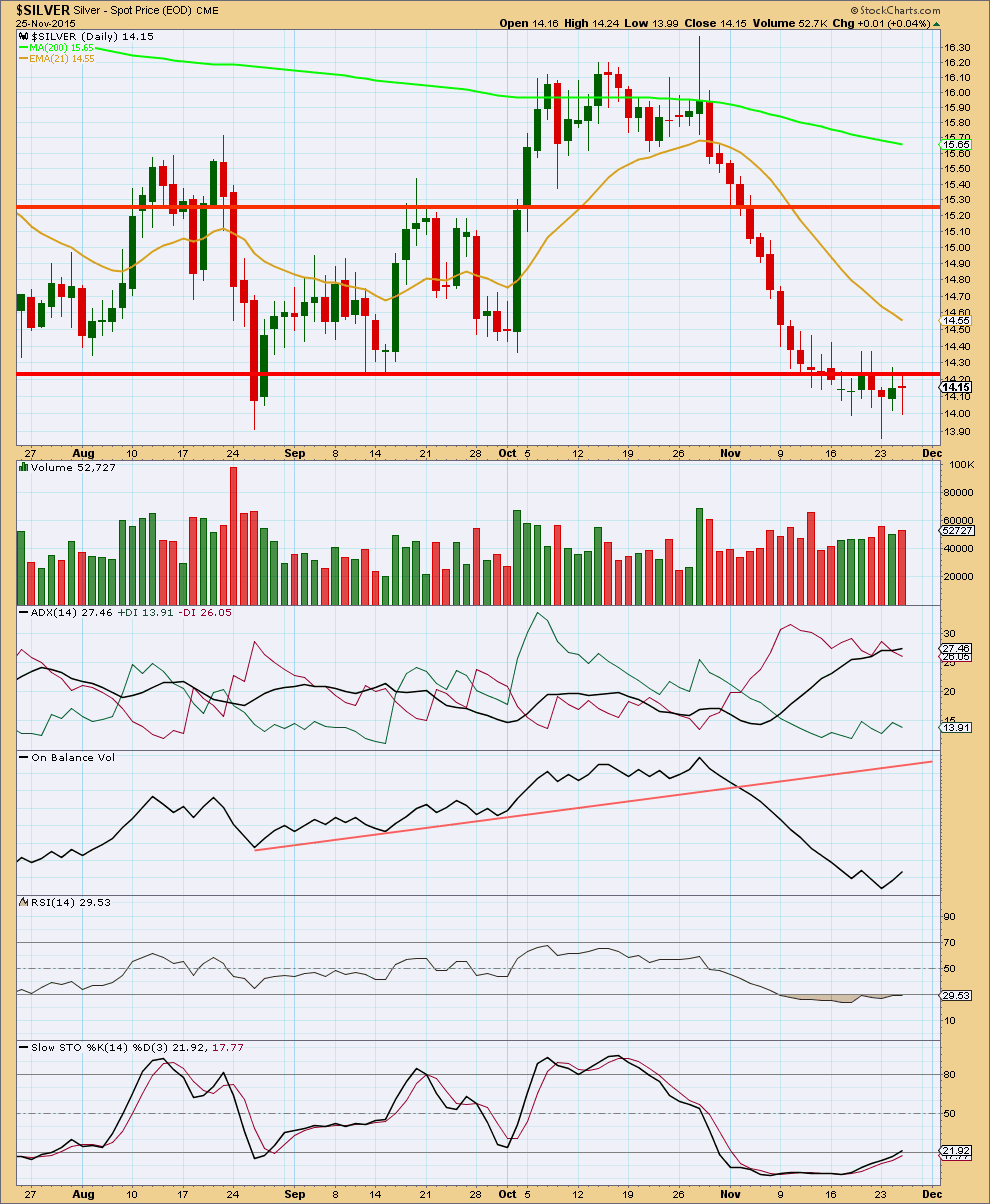
Downwards movement is well supported by rising volume. ADX still indicates a downwards trend is in place.
Price found a little support at the lower red horizontal trend line. Price is now finding resistance at that line.
On Balance Volume is bearish. It moves lower with price. There is no divergence between price and OBV at the daily chart level, so on balance I would ignore the small divergence at the weekly chart level for now. It is a weak signal.
RSI has not quite returned from oversold. Some more upwards movement should be expected to resolve this. Likewise, Stochastics is returning from oversold but not quite there yet.
If price manages to break above the red horizontal line which is currently providing resistance, then the next possible end for this correction may be the 9 day EMA. For now the resistance line should be expected to hold. The trend is down. When this correction is done a downwards breakout should be indicated by a strong downwards day on increased volume.
This analysis is published about 10:48 p.m. EST.