
Some more upwards movement to 48.09 – 49.35 was expected. Thereafter, the main Elliott wave count expected price to turn back down.
Price moved higher to reach 48.36 and turned down from there.
Summary: A third wave down is most likely underway. It may unfold as a zigzag as it may be a third wave within a leading diagonal. It must move below the end of the first wave at 42.60.
New updates to this analysis are in bold.
MONTHLY ELLIOTT WAVE COUNT
Click chart to enlarge.
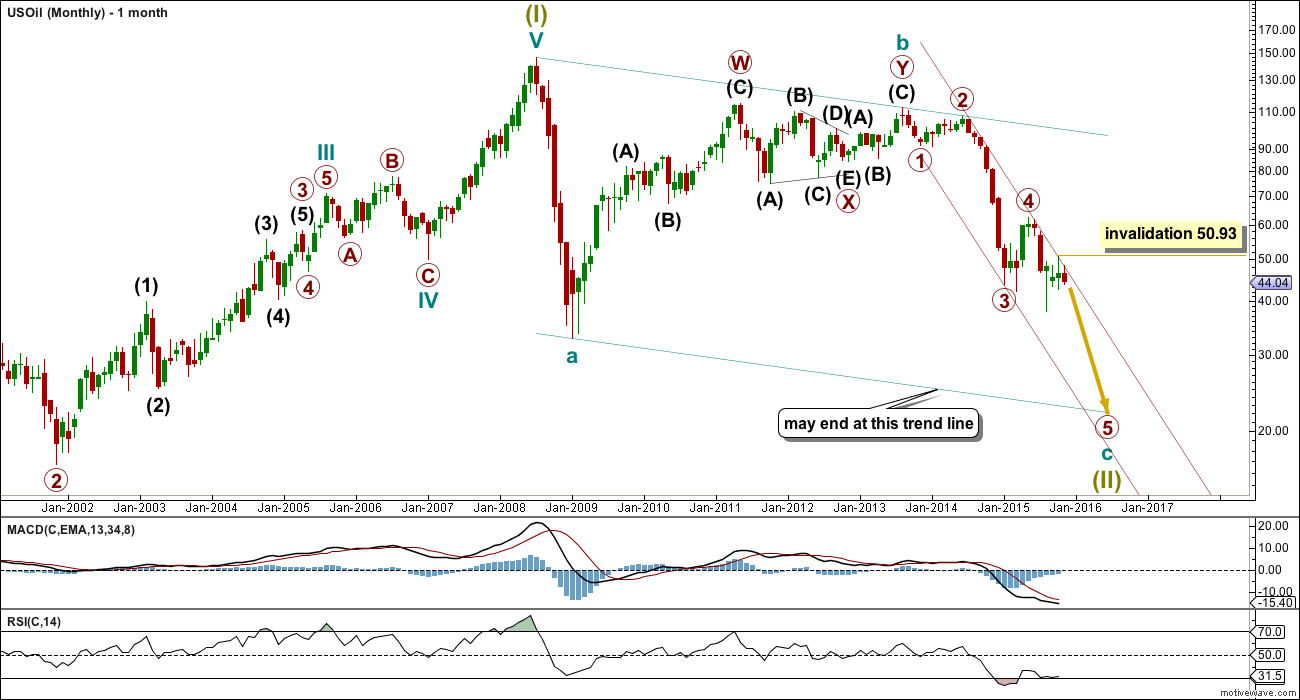
US Oil has been in a bear market since August 2013. While price remains below the upper edge of the maroon channel drawn here and below the 200 day simple moving average it must be accepted that the bear market most likely remains intact. I will not publish a bull wave count while this is the case and while there is no technical confirmation of a trend change from bear to bull.
The structure of cycle wave c is incomplete.
This wave count sees US Oil as within a big super cycle wave (II) zigzag. Cycle wave c is highly likely to move at least slightly below the end of cycle wave a at 32.70 to avoid a truncation. Cycle wave c may end when price touches the lower edge of the big teal channel about this zigzag.
It is just possible that cycle wave c could be complete at the last low of 37.75. However, that would see cycle wave c truncated by 5.05, which is a large truncation. I would consider this possibility only if it is confirmed with a clear breach of the maroon channel on the monthly chart.
Within cycle wave c, primary wave 5 is expected to be extended which is common for commodities.
Within primary wave 5, no second wave correction may move beyond its start above 62.58.
Draw a channel about this unfolding impulse downwards. Draw the first trend line from the highs labelled primary waves 2 and 4 then place a parallel copy on the end of primary wave 3. Next push up the upper trend line slightly to contain all of primary waves 3 and 4. Copy this channel over to the daily chart. The upper edge should provide resistance.
MAIN DAILY ELLIOTT WAVE COUNT
Click chart to enlarge.
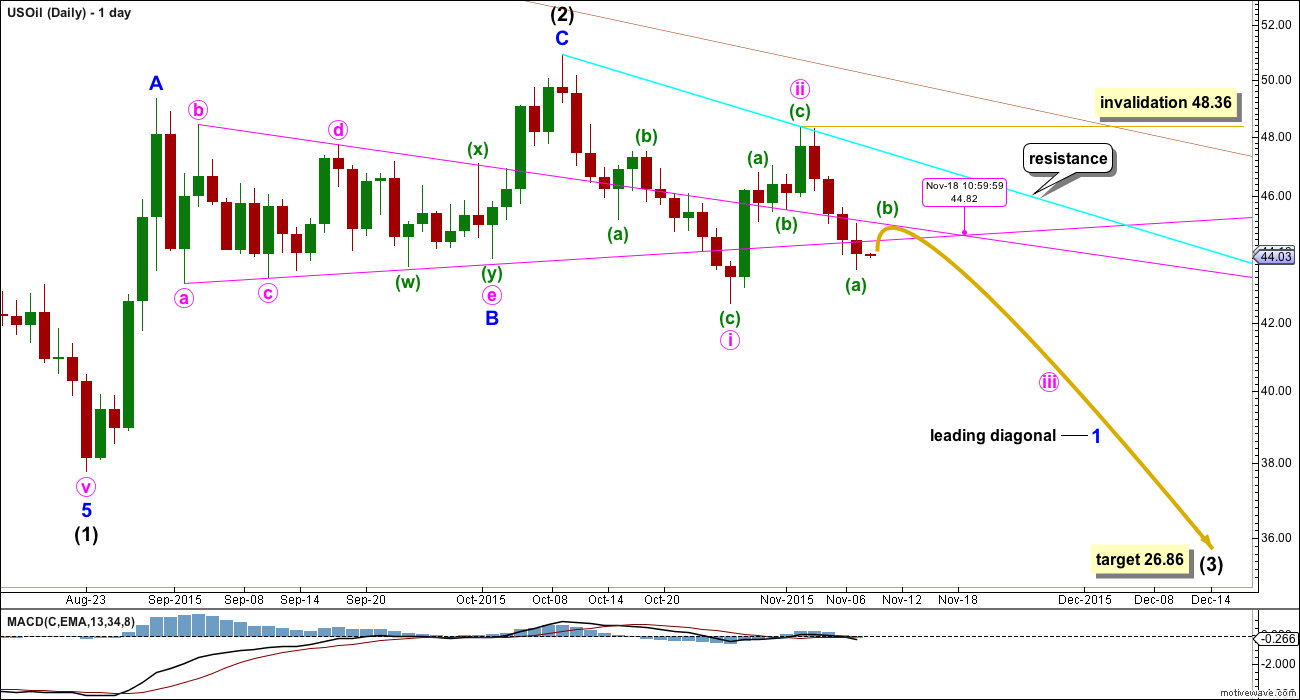
Intermediate wave (3) must subdivide as an impulse.
Within intermediate wave (3), minor wave 1 may be beginning as a leading diagonal. The most common type is contracting.
This is the main wave count because of the channel (maroon, copied over from the monthly chart). While price is reasonably close to the upper edge it looks most likely that intermediate wave (2) is over. Were intermediate wave (2) to continue further, it may have to breach the channel in order to complete.
The first, third and fifth waves are most commonly zigzags within a leading diagonal, but sometimes they may also be impulses. This is why minute wave i is labelled as a zigzag.
Minute wave ii is a competed zigzag. The normal depth for a second wave within a diagonal is between 0.66 to 0.81 the first wave. This second wave is within normal range at 0.69.
Minute wave i lasted 12 days, one short of a Fibonacci 13. Minute wave ii lasted a Fibonacci five days. Minute wave iii may last a Fibonacci eight or thirteen days in total. So far it has lasted four days and is beginning its fifth.
Actionary waves of diagonals do not normally exhibit Fibonacci ratios to each other. The only way to calculate a target with any reasonable probability for minute wave iii to end would be to use the ratio of the A and C waves within it (it is most likely to be a zigzag). This cannot be done until its A and B waves are complete.
Minute wave iii must move beyond the end of minute wave i below 42.60. Minute wave iii is most likely to be a zigzag, so on the way down a small bounce upwards for minuette wave (b) within it should be expected to show up on the daily chart. With price finding support at a horizontal trend line (shown on the technical analysis chart below), minuette wave (b) may begin here. It may not move beyond the start of minuette wave (a) above 48.36.
At 26.86 intermediate wave (3) would reach equality in length with intermediate wave (1).
Intermediate wave (1) lasted 53 days, two short of a Fibonacci 55. Intermediate wave (2) lasted a Fibonacci 34 days. If intermediate wave (3) is equal in duration as well as length to intermediate wave (1), then it may continue now for a further 34 days to last a total Fibonacci 55. Give or take up to two days either side of this expectation would be reasonable.
ALTERNATE DAILY ELLIOTT WAVE COUNT
Click chart to enlarge.
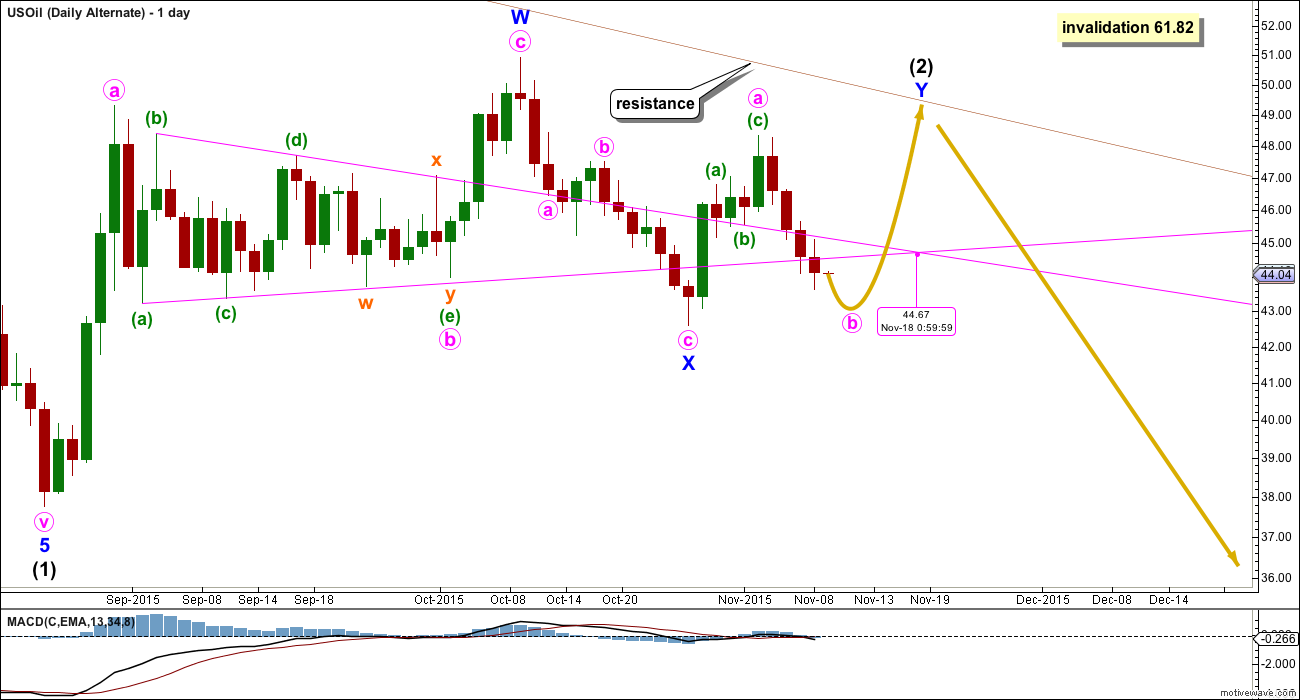
It is also possible that intermediate wave (2) is continuing. The only reason for making this an alternate is if it does continue, then it will possibly breach the upper edge of the maroon channel. That would not have the right look at the monthly chart level. I would expect the upper edge of that channel to provide strong resistance while Oil remains in a bear market.
If intermediate wave (2) does continue, then the most likely structure to remain within the channel would be a double combination. The first structure labelled minor wave W was a zigzag, so the second structure labelled minor wave Y should be a flat correction. Within it minute wave a must subdivide as a three wave structure.
Minute wave b must be a three wave structure and may move beyond the start of minute wave a. It must reach a minimum 90% of minute wave a at 43.18.
Minor wave W lasted a Fibonacci 34 days and minor wave X lasted 12 days (one short of a Fibonacci 13). Minor wave Y may last either a total Fibonacci 21 or 34 days (give or take up to two either side of each number for a reasonable expectation).
TECHNICAL ANALYSIS
DAILY CHART
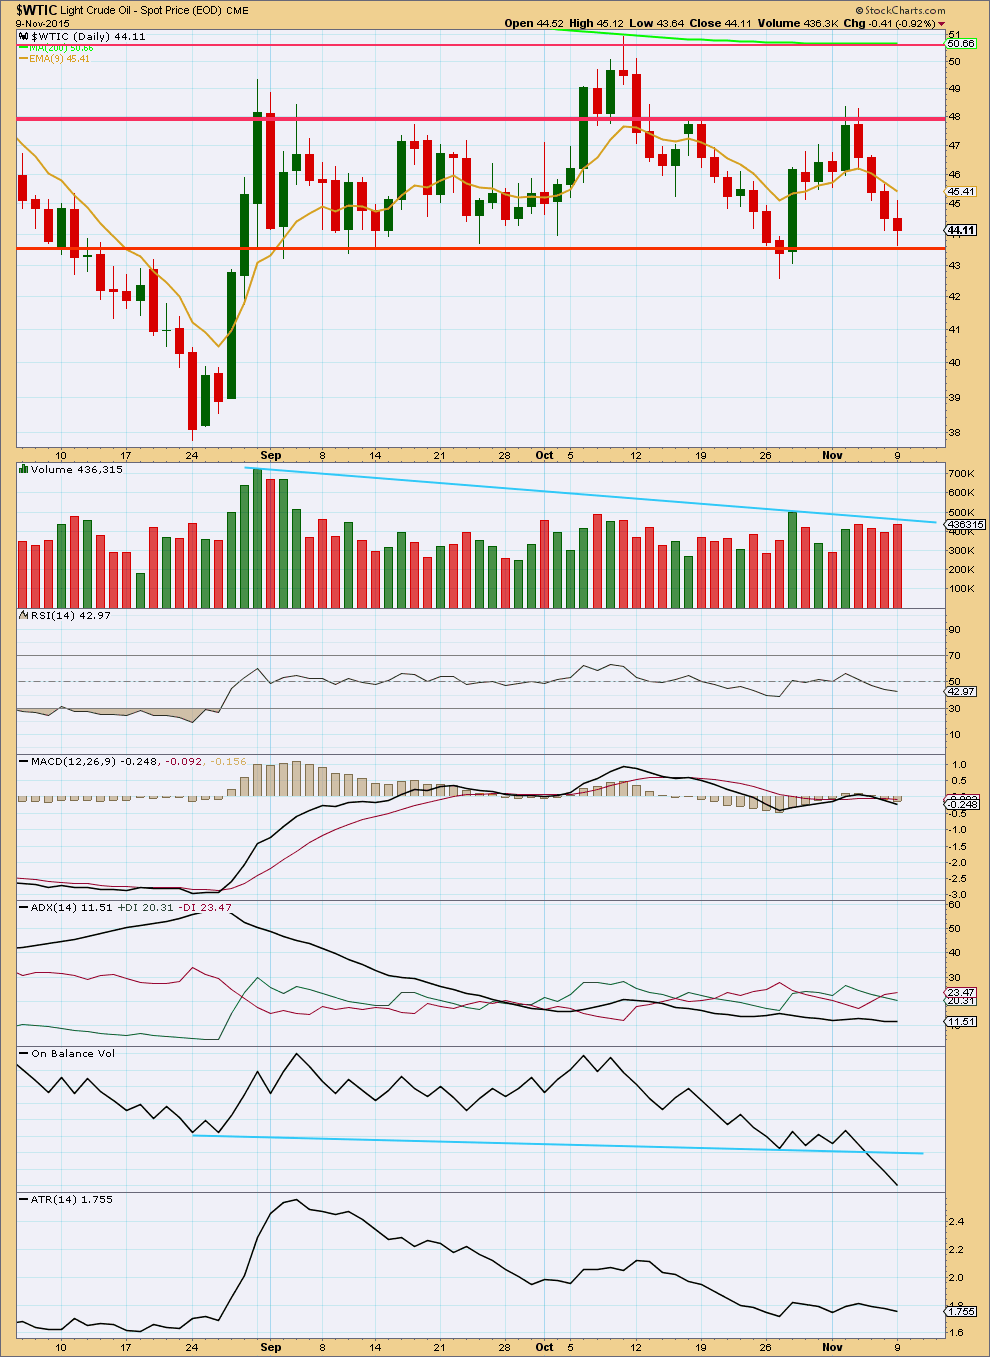
Click chart to enlarge. Chart courtesy of StockCharts.com.
Volume is still overall declining. Price is still range bound within horizontal lines of support and resistance. ADX indicates the market is range bound; there has not yet been a breakout. The strongest volume is for an upwards day during this consolidation phase. This would suggest an upwards breakout would be more likely than downwards, which contradicts the Elliott wave counts.
On Balance Volume disagrees though because it strongly indicates a downwards breakout. The strong break below the blue trend line on OBV is very bearish. At this stage, because OBV is a strong leading indicator, on balance a downwards breakout is indicated as more likely than upwards.
Today price has found support at the lower horizontal trend line. A bounce up from here may be expected.
The market may fall of its own weight. It does not require an increase in sellers for price to fall, only an absence of buyers. During the last big downwards move for US Oil there were periods of time where price fell on declining volume for several days. This may happen again. If there is a break below the lower horizontal line of support, if it comes on light volume, then a downwards breakout may still be indicated. An upwards breakout should come with an increase in volume for confidence.
ATR indicates the range price is moving in continues is now stable. This supports ADX in indicating the market most likely is range bound and not yet trending. If ATR turns upwards a new trend may be indicated.
When ATR has been flat or declining for long periods of time it should be expected that it will again turn upwards. The consolidation is very mature, a breakout should occur shortly.
This analysis is published about 01:05 a.m. EST.
Just sold DWTI. Thanks Lara. Great +$$$$$
Do not sell US oil today. 4 hour chart has bullish engulfing. US oil may BT at 43.38.
Lara, OBV is crazy low. the last time it was this low was at the end of primary 3 and then traders piled into 4.. You don’t think something similar may be happening? Squeeze your daily chart together and take a look at OBV over a longer period to see what I mean… I hope we are not missing something here..
I see it, yes.
OBV isn’t an overbought / oversold indicator though. So even though its low it cannot be indicating a reversal.
Between the big low at 37.75 in August and this low now, OBV has moved to new lows while price has not. That would indicate some bullish divergence; there is weakness in price. And yes, that is a cause for concern.
I’ve noticed that OBV works really well with trend lines, and not so well with divergence. In that divergence doesn’t seem to be as reliable.
Ok I’ll keep an eye on it. Regards.