
Last analysis expected more downwards movement for the week which is what happened.
Summary: Upwards movement is expected for the next week to a minimum at 45.65. A new high above 48.36 is possible but unlikely. When a zigzag upwards is complete, then a trend change and more downwards movement is expected.
New updates to this analysis are in bold.
MONTHLY ELLIOTT WAVE COUNT
Click chart to enlarge.
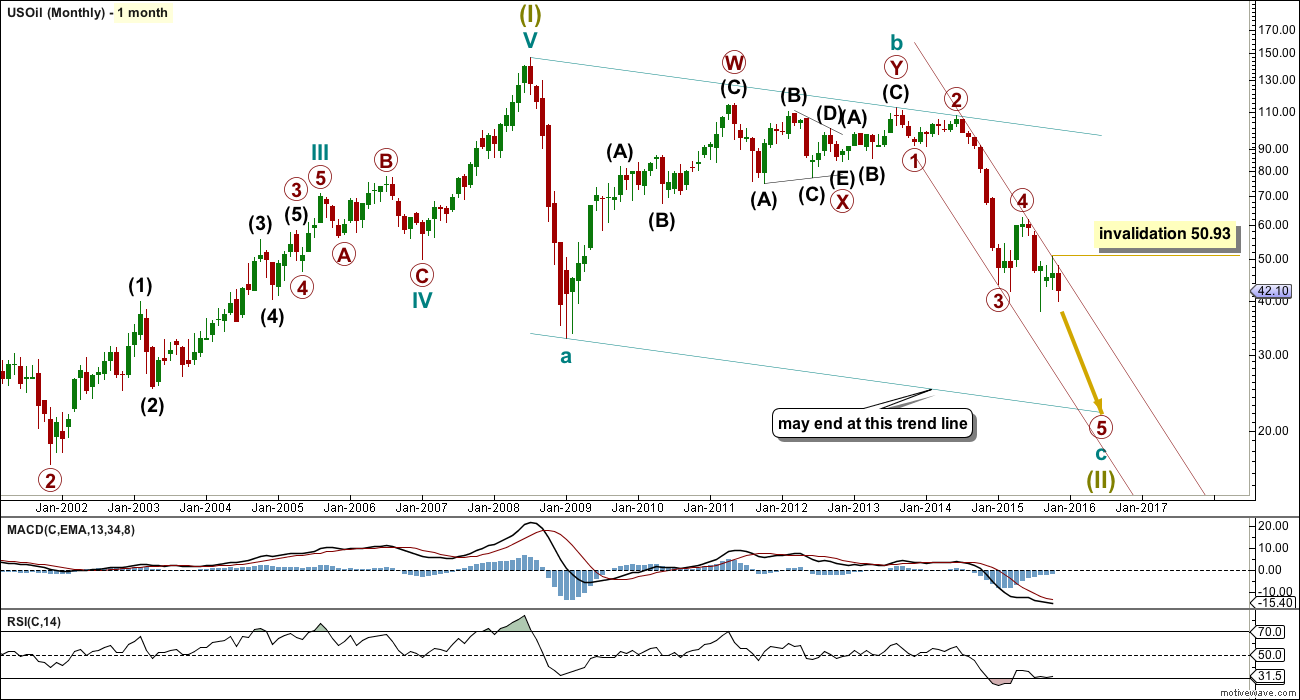
US Oil has been in a bear market since August 2013. While price remains below the upper edge of the maroon channel drawn here and below the 200 day simple moving average it must be accepted that the bear market most likely remains intact. I will not publish a bull wave count while this is the case and while there is no technical confirmation of a trend change from bear to bull.
The structure of cycle wave c is incomplete.
This wave count sees US Oil as within a big super cycle wave (II) zigzag. Cycle wave c is highly likely to move at least slightly below the end of cycle wave a at 32.70 to avoid a truncation. Cycle wave c may end when price touches the lower edge of the big teal channel about this zigzag.
It is just possible that cycle wave c could be complete at the last low of 37.75. However, that would see cycle wave c truncated by 5.05, which is a large truncation. I would consider this possibility only if it is confirmed with a clear breach of the maroon channel on the monthly chart.
Within cycle wave c, primary wave 5 is expected to be extended which is common for commodities.
Within primary wave 5, no second wave correction may move beyond its start above 62.58.
Draw a channel about this unfolding impulse downwards. Draw the first trend line from the highs labelled primary waves 2 and 4 then place a parallel copy on the end of primary wave 3. Next push up the upper trend line slightly to contain all of primary waves 3 and 4. Copy this channel over to the daily chart. The upper edge should provide resistance.
MAIN DAILY ELLIOTT WAVE COUNT
Click chart to enlarge.
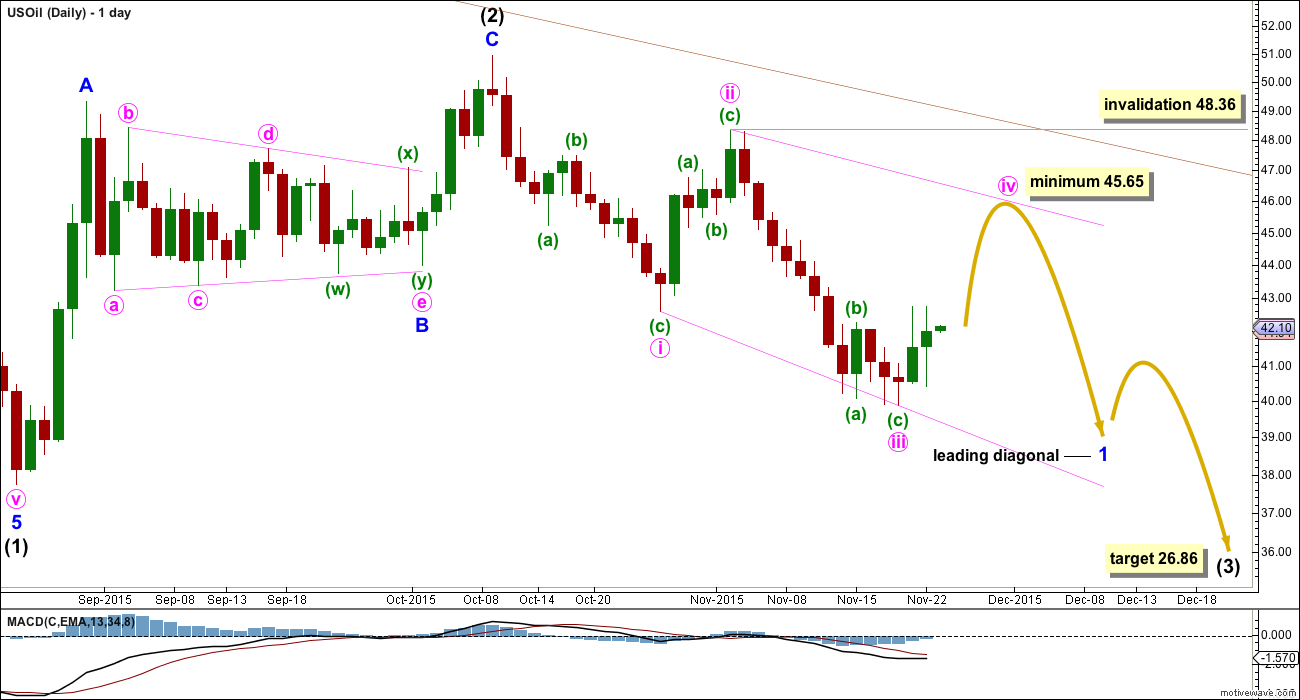
Intermediate wave (3) must subdivide as an impulse.
Within intermediate wave (3), minor wave 1 may be beginning as a leading diagonal. Minute wave iii is longer than minute wave i, so the diagonal would be expanding.
This is the main wave count because of the channel (maroon, copied over from the monthly chart). While price is reasonably close to the upper edge it looks most likely that intermediate wave (2) is over. Were intermediate wave (2) to continue further, it may have to breach the channel in order to complete.
The first, third and fifth waves are most commonly zigzags within a leading diagonal, but sometimes they may also be impulses. This is why minute waves i and iii are labelled as zigzags.
Minute wave i lasted 12 days, one short of a Fibonacci 13. Minute wave ii lasted a Fibonacci 5 days. Minute wave iii lasted 12 days, equal in duration to minute wave i and one short of a Fibonacci 13. Minute wave iv may be expected to last either a Fibonacci 5 or 8 days, with 8 more likely.
Minute wave iv should be longer than minute wave ii because the diagonal is expanding. The minimum for minute wave iv is 45.65. The diagonal trend lines must diverge.
Minute wave iv must overlap back into minute wave i price territory above 42.60. It may not move beyond the end of minute wave ii above 48.36.
At 26.86 intermediate wave (3) would reach equality in length with intermediate wave (1).
Intermediate wave (1) lasted 53 days, two short of a Fibonacci 55. Intermediate wave (2) lasted a Fibonacci 34 days. If intermediate wave (3) is equal in duration as well as length to intermediate wave (1), then it may continue now for a further 23 days to last a total Fibonacci 55. Give or take up to two days either side of this expectation would be reasonable.
ALTERNATE DAILY ELLIOTT WAVE COUNT
Click chart to enlarge.
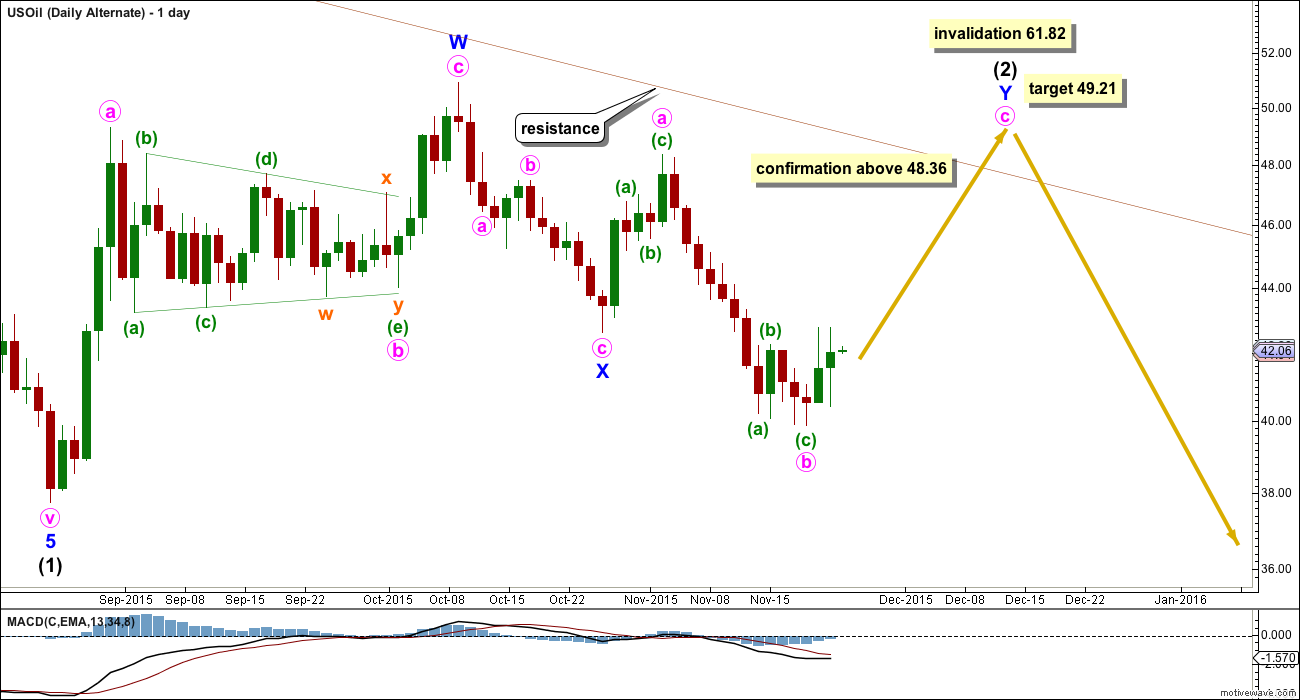
It is also possible that intermediate wave (2) is continuing. The only reason for making this an alternate is if it does continue, then it will possibly breach the upper edge of the maroon channel. That would not have the right look at the monthly chart level. I would expect the upper edge of that channel to provide strong resistance while Oil remains in a bear market.
If intermediate wave (2) does continue, then the most likely structure to remain within the channel would be a double combination. The first structure labelled minor wave W was a zigzag, so the second structure labelled minor wave Y should be a flat correction. Within it minute wave a must subdivide as a three wave structure.
Minute wave b may again be over and is now 1.47 times the length of minute wave a. At 49.21 minute wave c would reach 1.618 the length of minute wave a.
A new high above 48.36 would invalidate the main wave count and confirm this alternate.
Minor wave W lasted a Fibonacci 34 days and minor wave X lasted 12 days (one short of a Fibonacci 13). Minor wave Y may last a total Fibonacci 34 days (give or take up to two either for a reasonable expectation).
TECHNICAL ANALYSIS
DAILY CHART
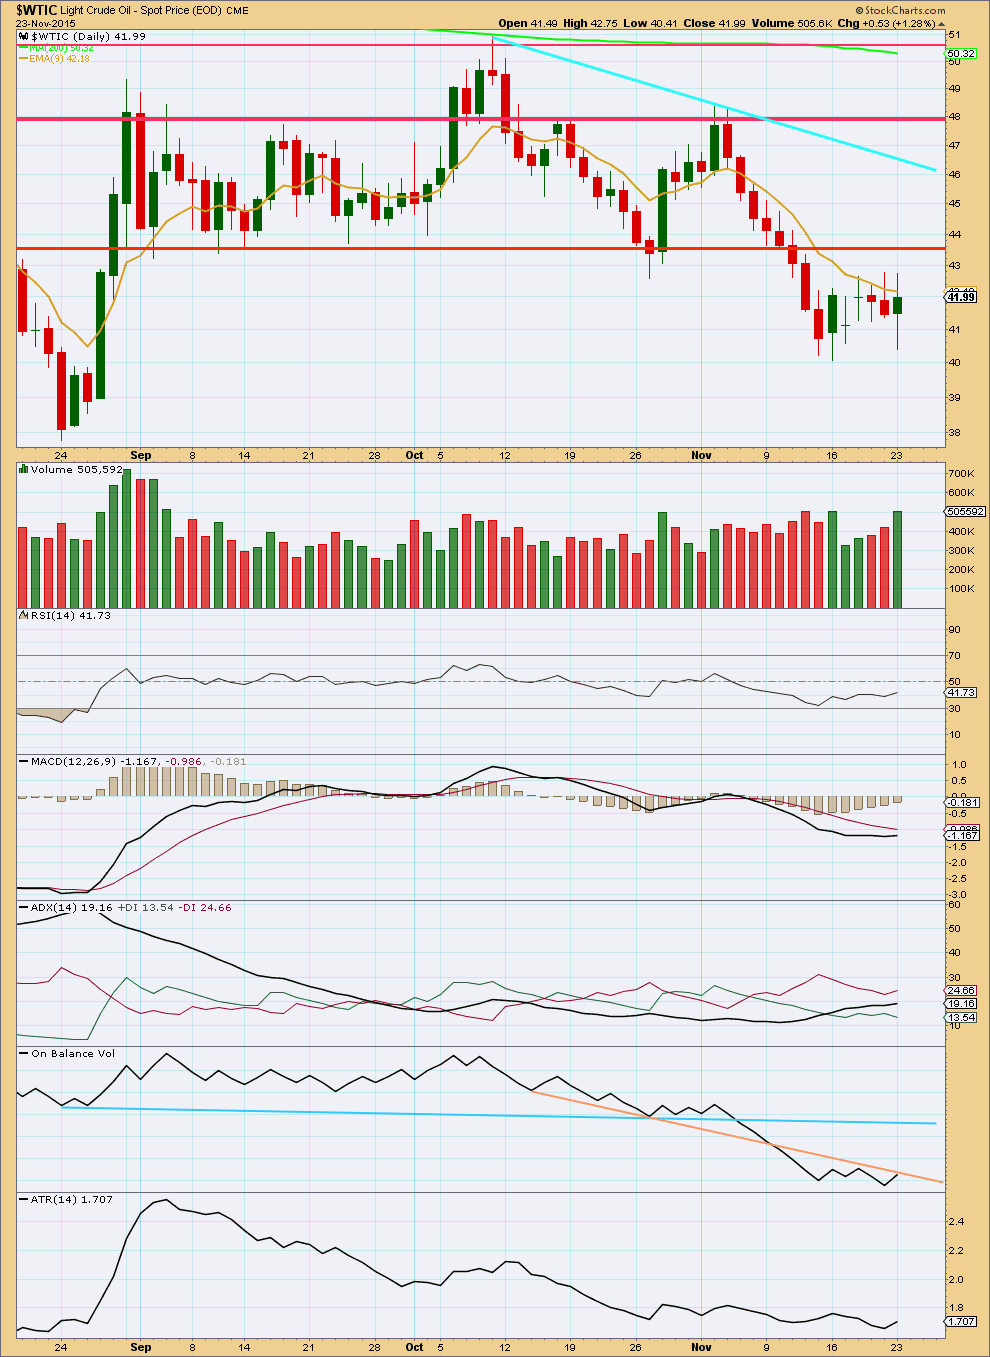
Click chart to enlarge. Chart courtesy of StockCharts.com.
Five days of sideways movement on increasing volume is not a normal volume profile. Normally during sideways corrections volume declines. This may indicate a strong breakout is coming.
Price may find resistance at the horizontal trend line at 43.59.
ADX is indicating a downwards trend is in place.
Divergence with price and On Balance Volume is bullish; the recent fall in price is weak. OBV works better with trend lines though in my experience than it does with divergence. OBV may find resistance at the peach coloured trend line. If that line is breached, then the next blue line of resistance is stronger, which should help to stop a rise in price.
This analysis is published about 03:21 a.m. EST.
Lara: your FXCM chart looks different than Stockchart???
US oil is being held below 9ema. once again there was battle yesterday around 9ema price. Oil has broken below the bearish flag. Hope this is the beginning of a large red candle down soon. ADX is pointing up showing trend down.
The market may have answered. 24th Nov is moving higher.
There are often small differences in StockCharts and FXCM data. Although here the differences are still small it makes the candlestick for 20th Nov green on FXCM and red on stock charts.
Differences for 20th Nov:
StockCharts data:
open 41.89
high 42.76
low 41.37
close 41.46
FXCM data:
open 40.52
high 42.75
low 40.50
close 41.54
December oil closed 4 PM ET @ 40.44, however, it rolled over to January oil contract at 6 PM ET which closed 4 PM ET at 41.74. (An automatic and momentary jump of $1.70 on fxcm data) (go to fxcm/motive wave for this time period and see for yourself)
Exp. As of 6:04 PM ET January oil was 41.84, only 10 cents above its 4 PM ET close.
For those of you in ETF’s, etc., nothing changed.. They are not affected by the contract roll-over. So if you woke up the next day expecting a big gain (or loss) you would have found little changed.
In fact, I don’t think ETF’s are affected by pre and after market oil price changes. (Maybe call direxion and horizon-beta-pro to find out exactly how they calculate)
Some charts don’t include the roll over and some do (fxcm), so I’m glad this issue has been brought up because it begs the question on how it affects TA and e-wave? A $1.70 jump could blow us through an invalidation point or trend line. So do we use data with or without the rollover? Interestingly, a stop-loss would not be affected by the monthly contract change. Because if you put your order in under the December contract, your stop would abide with December values, likewise, if you put your order in during the January contract your stop would follow January values. So Lara, how do we handle these differences with respect to our analysis?
Contracts link:
http://www.cmegroup.com/trading/energy/crude-oil/light-sweet-crude.html?22=
Correction, The values that i presented above are likely the ones I wrote down at the time of contract change from CME data. (Maybe 4 cents difference from fxcm). Nevertheless, my point remains the same ; fxcm “includes” contract roll-overs while some charts don’t. This is what you are occasionally witnessing …but the question still remains.. How do we handle this? What impact does it have, if any. Lara, maybe your CMT resources could help us with this question since you are now an alumni- congrats.
I would say, it is what it is. If the price “jumps” up or down because of the switch from one months futures to the next, it is all a part of price and of course, social mood.
I’m not sure about UWTI and DWTI, but when I used to trade USO, I often was very frustrated each month at rollover time as the price of oil would “jump” and it would not impact USO. Backwardation and Contango could be hazardous to trading USO.
Well, if we are serious about accuracy professional analysts will disagree with you. See this link (interesting stuff):
http://www.nuclearphynance.com/User%20Files/7228/cntcontr.pdf
As long as I’m using a consistent data feed then the Elliott wave analysis on that data would be valid.
Its not that one set of data is right and the other is wrong, they’re different.
I understand about adjusting data for back testing, but that is not the same issue as using data for Elliott wave analysis.
It has to be consistent. I can’t start to pick and choose some days of StockCharts data with my FXCM data. I have to stick with one data feed.
I cannot import StockCharts data into Motive Wave so I can’t use it for Elliott wave analysis.