
Downwards movement was expected to continue, but this is not what is happening.
I have two wave counts for you today that expect the same direction for the short term.
Summary: At least a little more upwards movement should continue to 48.09 – 49.35. It is possible that Oil may make a new high above 50.93.
New updates to this analysis are in bold.
MONTHLY ELLIOTT WAVE COUNT
Click chart to enlarge.
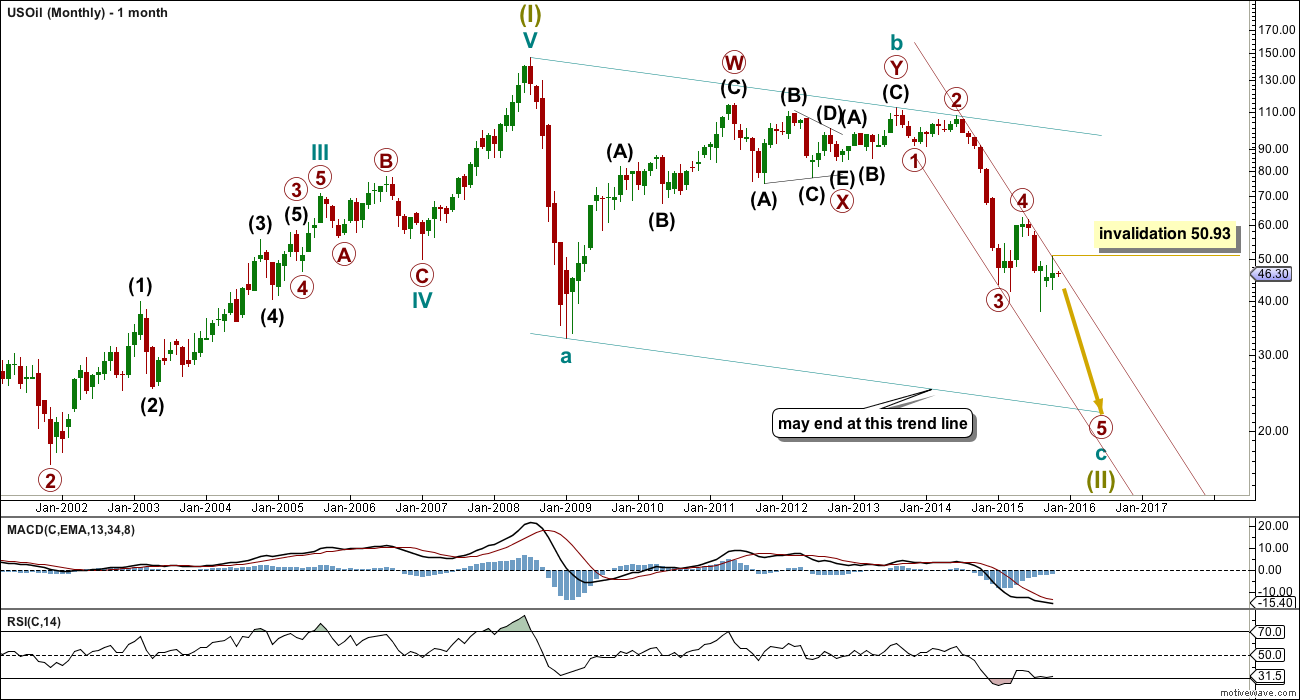
US Oil has been in a bear market since August 2013. While price remains below the upper edge of the maroon channel drawn here and below the 200 day simple moving average it must be accepted that the bear market most likely remains intact. I will not publish a bull wave count while this is the case and while there is no technical confirmation of a trend change from bear to bull.
The structure of cycle wave c is incomplete.
This wave count sees US Oil as within a big super cycle wave (II) zigzag. Cycle wave c is highly likely to move at least slightly below the end of cycle wave a at 32.70 to avoid a truncation. Cycle wave c may end when price touches the lower edge of the big teal channel about this zigzag.
It is just possible that cycle wave c could be complete at the last low of 37.75. However, that would see cycle wave c truncated by 5.05, which is a large truncation. I would consider this possibility only if it is confirmed with a clear breach of the maroon channel on the monthly chart.
Within cycle wave c, primary wave 5 is expected to be extended which is common for commodities.
Within primary wave 5, no second wave correction may move beyond its start above 62.58.
Draw a channel about this unfolding impulse downwards. Draw the first trend line from the highs labelled primary waves 2 and 4 then place a parallel copy on the end of primary wave 3. Next push up the upper trend line slightly to contain all of primary waves 3 and 4. Copy this channel over to the daily chart. The upper edge should provide resistance.
MAIN DAILY ELLIOTT WAVE COUNT
Click chart to enlarge.
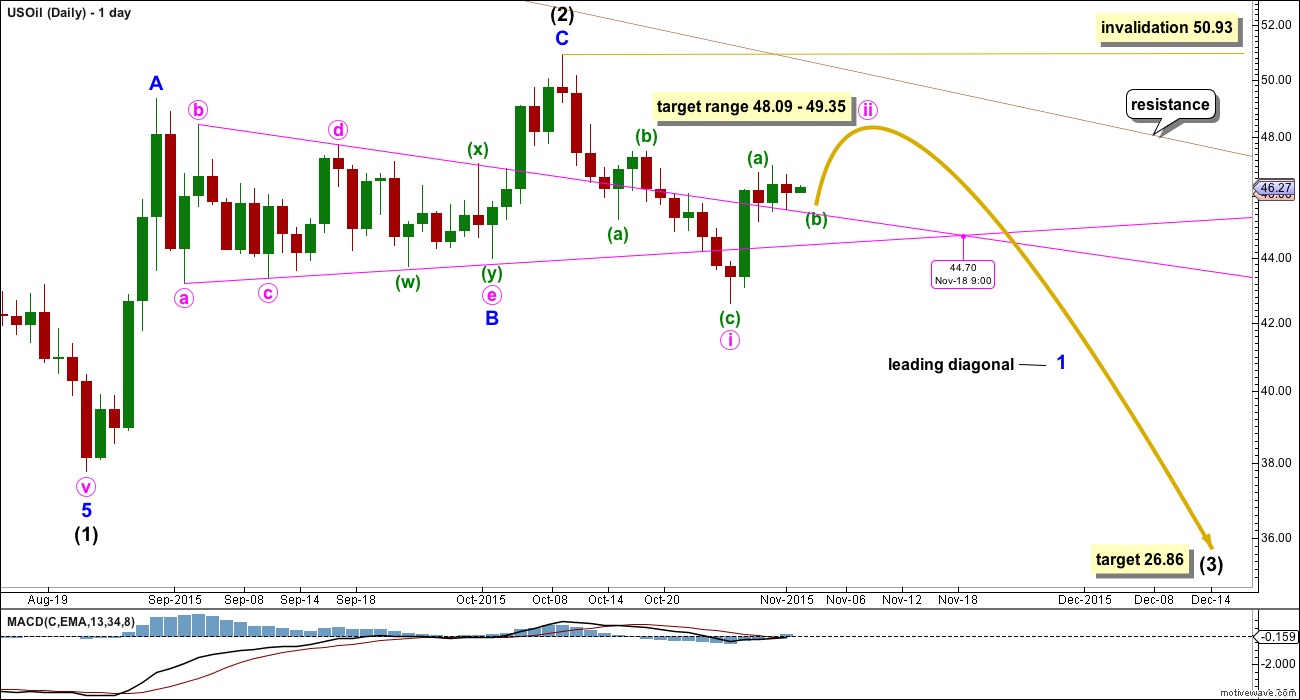
Intermediate wave (3) must subdivide as an impulse.
Within intermediate wave (3), minor wave 1 may be beginning as a leading diagonal. The most common type is contracting.
This is the main wave count because of the channel (maroon, copied over from the monthly chart). While price is reasonably close to the upper edge it looks most likely that intermediate wave (2) is over. Were intermediate wave (2) to continue further, it may have to breach the channel in order to complete.
The first, third and fifth waves are most commonly zigzags within a leading diagonal, but sometimes they may also be impulses. This is why minute wave i is labelled as a zigzag.
Minute wave ii may only be a zigzag. It is likely to end within the normal range for a second wave of a diagonal, between 0.66 to 0.81 the length of minute wave i. This gives a range of 48.09 – 49.35. When minuette waves (a) and (b) are complete, then a target for minuette wave (c) to end may be calculated.
Minute wave ii may not move beyond the start of minute wave i above 50.93. Minute wave i lasted 12 days, one short of a Fibonacci 13. Minute wave ii may also last close to a Fibonacci 13 days, so it may continue for another eight days give or take one either side of this expectation.
At 26.86 intermediate wave (3) would reach equality in length with intermediate wave (1).
Intermediate wave (1) lasted 53 days, two short of a Fibonacci 55. Intermediate wave (2) lasted a Fibonacci 34 days. If intermediate wave (3) is equal in duration as well as length to intermediate wave (1), then it may continue now for a further 38 days to last a total Fibonacci 55. Give or take up to two days either side of this expectation would be reasonable.
ALTERNATE DAILY ELLIOTT WAVE COUNT
Click chart to enlarge.
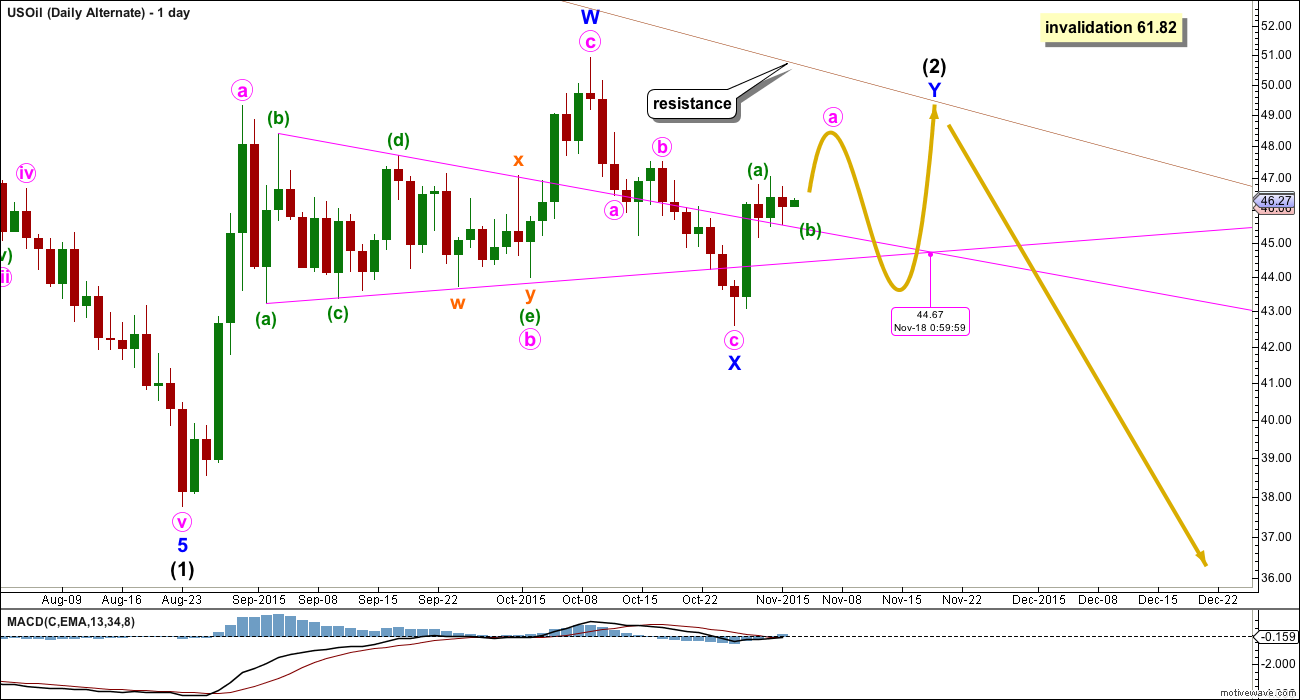
It is also possible that intermediate wave (2) is continuing. The only reason for making this an alternate is if it does continue, then it will possibly breach the upper edge of the maroon channel. That would not have the right look at the monthly chart level. I would expect the upper edge of that channel to provide strong resistance while Oil remains in a bear market.
If intermediate wave (2) does continue, then the most likely structure to remain within the channel would be a double combination. The first structure labelled minor wave W was a zigzag, so the second structure labelled minor wave Y should be a flat correction. Within it minute wave a must subdivide as a three wave structure. The short / mid term expectation for both wave counts is exactly the same.
Minute wave b must be a three wave structure and may move beyond the start of minute wave a.
Minor wave W lasted a Fibonacci 34 days and minor wave X lasted 12 days (one short of a Fibonacci 13). Minor wave Y may last either a total Fibonacci 21 or 34 days (give or take up to two either side of each number for a reasonable expectation).
TECHNICAL ANALYSIS
DAILY CHART
Click chart to enlarge. Chart courtesy of StockCharts.com.
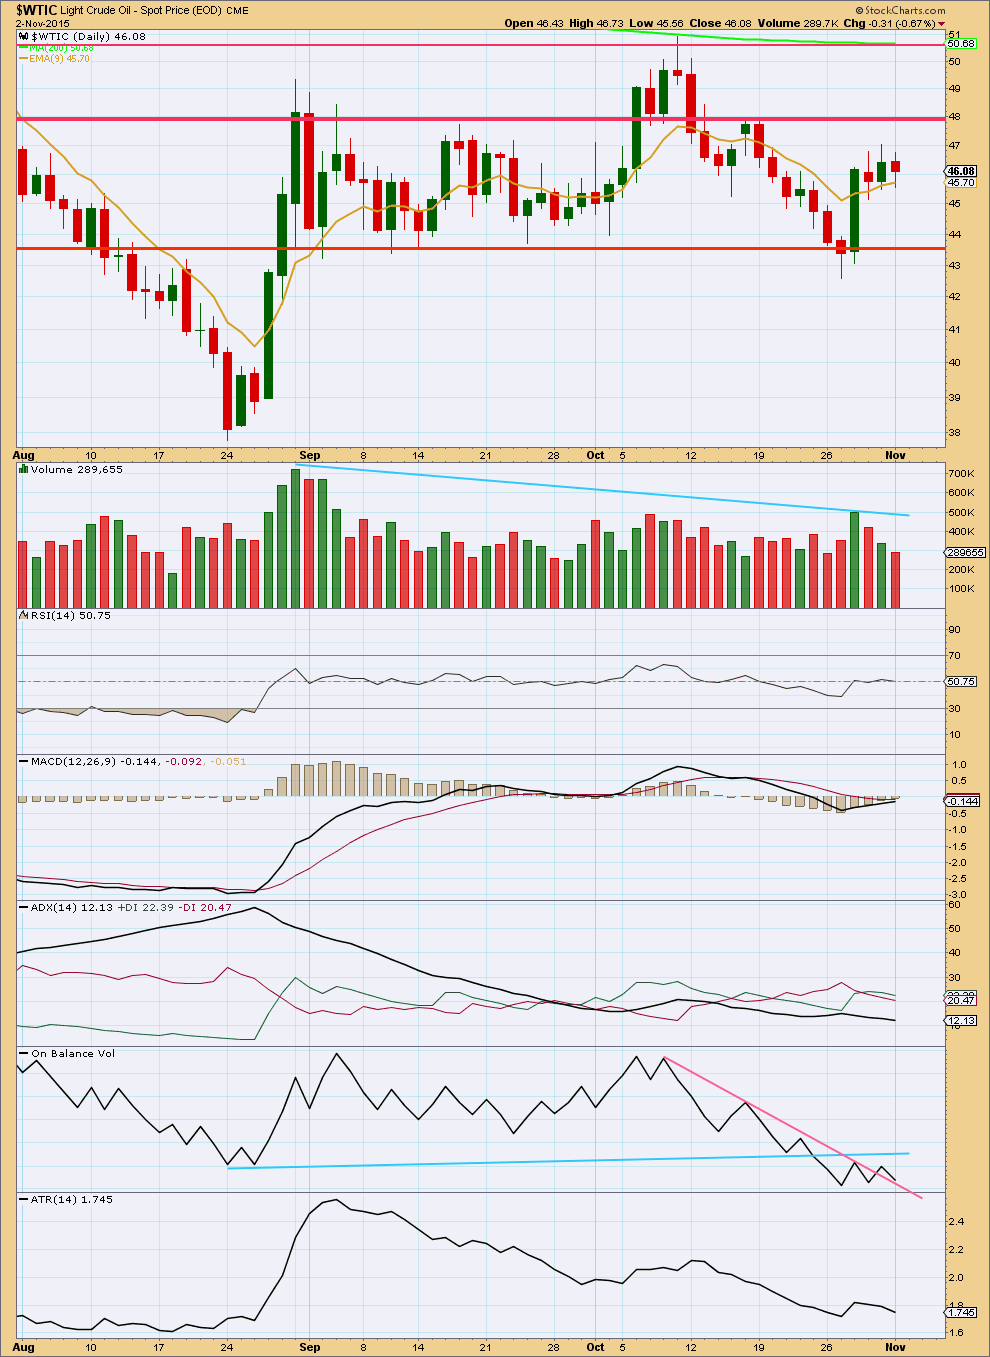
Volume is still overall declining. Price is still range bound within horizontal lines of support and resistance. ADX indicates the market is range bound; there has not yet been a breakout. The strongest volume is for an upwards day during this consolidation phase. This would suggest an upwards breakout would be more likely than downwards, which contradicts the Elliott wave counts.
The market may fall of its own weight. It does not require an increase in sellers for price to fall, only an absence of buyers. During the last big downwards move for US Oil there were periods of time where price fell on declining volume for several days. This may happen again. If there is a break below the lower horizontal line of support, if it comes on light volume, then a downwards breakout may still be indicated. An upwards breakout should come with an increase in volume for confidence.
ATR indicates the range price is moving in continues to decline. This supports ADX in indicating the market most likely is range bound and not yet trending. If ATR turns upwards a new trend may be indicated.
When ATR has been flat or declining for long periods of time it should be expected that it will again turn upwards. The consolidation is very mature, a breakout should occur shortly.
On Balance Volume shows divergence with price: OBV did not manage to make a new high at the price high two days ago. This upwards movement looks to be weak and may be because the last three days are part of a smaller correction within the wave structure.
This analysis is published about 10:02 p.m. EST.
US oil broke thru 9ema and some trend line. Once oil trades full one day candle below the 9ema plan to add more short.
Some bounce may happen but expect it to be short lived.
Wednesdays’ Harami reversal gave confidence to reversal.
Sorry Lara! I am filling up comment section with big charts here.
Is oil in main daily or alternate daily?
Minimum 48.09 upside target for main daily was met but time duration for minute wave ii seems short.
Oil reverse yesterday with Harami candle- inside day.
US Oil is trading lower. If oil closes below 9 ema than wave 3 has begun. Current 9 ema is at 46.20.
Lara’s comment on Oct 26th:
” If intermediate wave (3) is equal in duration as well as length to intermediate wave (1), then it may continue now for a further 44 days to last a total Fibonacci 55. Give or take up to two days either side of this expectation would be reasonable.”
What short sellers mean to a rally in oil Nov 2, 2015 1:46 p.m. ET
http://www.marketwatch.com/story/what-short-sellers-mean-to-a-rally-in-oil-2015-11-02?mod=MW_story_recommended_tab&Link=obnetwork
Is the top in?
If this is a (3) wave, is looking more and more like a diagonal. Will find out and confirm soon I guess. Another observation Lara: If you project a line from the end of wave (1) through the end of the B wave, it cuts through exactly where you have placed the (ii) wave area – is there any relationship there?
Great analysis lara
Thanks Lara for excellent report
US oil view from satellite: A quarterly chart
Target below 22.