
A correction was expected to continue.
Another small inside day fits this expectation.
Summary: The structure of this correction is unclear and it will be impossible to accurately predict the pathway price will take to complete it (because it is impossible to predict what structure it will take and which of more than one valid wave count will be correct). What is clear is that it is unlikely to be over. It may continue for a further five days to end at either 1,088 or 1,104. A new hourly wave count would see the correction end close to where price currently is with more sideways movement.
New updates to this analysis are in bold.
To see weekly charts and the difference between the two wave counts go here.
MAIN ELLIOTT WAVE COUNT
Click chart to enlarge.
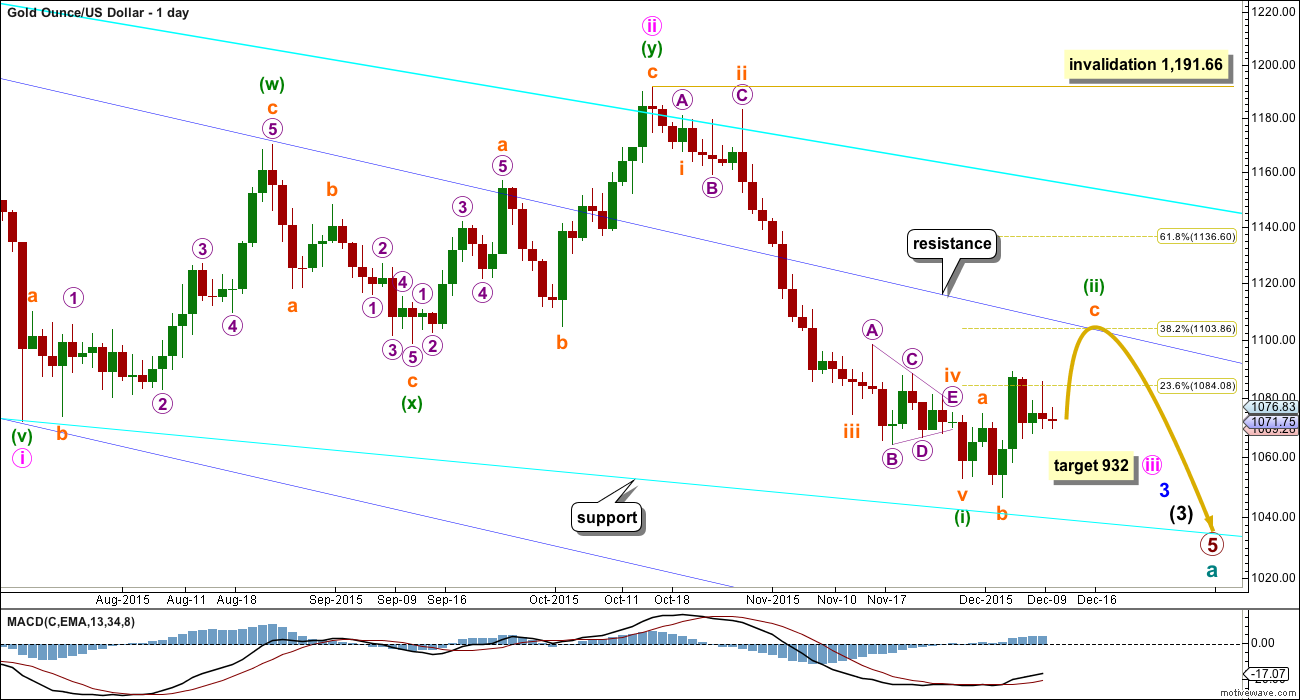
Gold has been in a bear market since September 2011. There has not yet been confirmation of a change from bear to bull, and so at this stage any bull wave count would be trying to pick a low which is not advised. Price remains below the 200 day moving average and below the cyan trend line (copied over from the weekly chart). The bear market should be expected to be intact until we have technical confirmation of a big trend change.
The final line of resistance (cyan line copied over from weekly charts) is only overshot and not so far properly breached. While this line is not breached the bear wave count will remain possible. Simple is best, and the simplest method to confirm a trend change is a trend line.
Minute wave ii is a complete double zigzag and deep at 0.75 the length of minute wave i. It has breached the dark blue base channel drawn about minor waves 1 and 2, one degree higher. When a lower degree second wave correction does this it reduces the probability of the wave count but does not invalidate it. Base channels most often work to show where following corrections find support or resistance, but not always.
At 932 minute wave iii would reach 1.618 the length of minute wave i.
Minuette wave (i) is complete.
Minuette wave (ii) may find resistance at the upper dark blue trend line. This may see it end about the 0.382 Fibonacci ratio of minuette wave (i) at 1,104.
Minuette wave (i) lasted 31 days, three short of a Fibonacci 34. It looks like minuette wave (ii) may be more brief and shallow than second wave corrections normally are, at this stage, due to the strong downwards pull from the middle of a third wave. So far it has lasted nine days. A further four days may see it total a Fibonacci thirteen. If it does not end in a further five days, then the next Fibonacci number in the sequence is twenty one which would see a further twelve days from here.
Today I have three different ways to see minuette wave (ii). The new third idea looks at a combination with the second structure as a triangle. At this stage, I would judge all to have a close to even probability. All hourly charts today show price movement from the low of 3rd December.
The last (third alternate) hourly wave count has a lower probability than the first three ideas.
MAIN HOURLY WAVE COUNT
Click chart to enlarge.
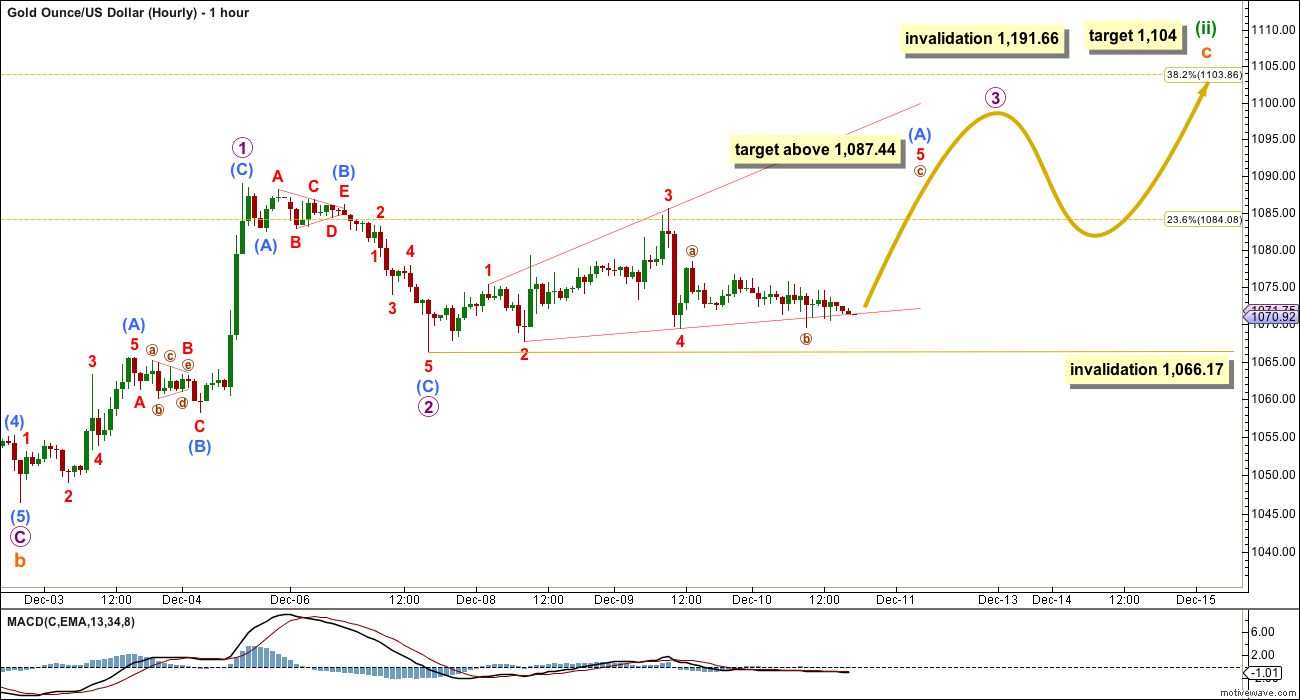
This main wave count looks at minuette wave (ii) as a single incomplete expanded flat correction.
There are two possible structures for subminuette wave c. C waves may be either impulses or ending diagonals. At this stage, an impulse does not fit. Subminuette wave c must be unfolding as an ending diagonal.
If subminuette wave c is unfolding as an ending diagonal, then all the sub waves must subdivide as zigzags. Micro wave 1 is complete.
If the sideways movement labelled sub micro wave (B) within micro wave 2 is seen as a triangle, then micro wave 2 must be over. It is a 0.54 correction of micro wave 1, less than the normal range of 0.66 to 0.81 but still relatively deep, so not too far from normal to be problematic.
No second wave correction nor B wave may move beyond its start below 1,066.17 within micro wave 3.
Micro wave 3 must subdivide as a zigzag. When it is done the type of diagonal should be known, expanding or contracting. If micro wave 3 reaches above 1,108.63, the diagonal should be expanding. But it is more likely to be shorter than this for a contracting diagonal. Micro wave 3 must move above the end of micro wave 1 to make a new high above 1,088.94.
Submicro wave (A) may be unfolding as a leading expanding diagonal within micro wave 3. The final fifth wave up is required. Leading diagonals may not have truncated fifth waves, so minuscule wave 5 must end above 1,080.23. Because the diagonal is expanding, minuscule wave 5 should be longer than minuscule wave 3 and should end above 1,087.44.
When micro wave 3 is a complete zigzag, then micro wave 4 must overlap back into micro wave 1 price territory, should be deep, must be a zigzag, and may not move below the end of micro wave 2 at 1,066.17. The invalidation point will remain the same for this wave count for some time.
The classic technical analysis equivalent (to a contracting diagonal) is a rising wedge. They are terminal structures.
Diagonals are choppy and overlapping; they take time to form. This structure may continue for a further four days, if minuette wave (ii) completes in a Fibonacci thirteen, or a further twelve trading days, if minuette wave (ii) completes in a Fibonacci twenty one days.
At 1,104 subminuette wave c would reach 1.618 the length of subminuette wave a and minuette wave (ii) would correct to the 0.382 Fibonacci ratio of minuette wave (i).
FIRST ALTERNATE HOURLY WAVE COUNT
Click chart to enlarge.
This first alternate wave count looks at minuette wave (ii) as an incomplete double combination or double flat correction.
An expanded flat correction may have been over with a slightly truncated fifth wave within micro wave C, labelled subminuette wave w.
This may have been the first flat correction within a longer lasting double flat or double combination for minuette wave (ii).
The second structure for a double combination may be a zigzag or a triangle. For a double flat, the second structure may be another flat. Double combinations and double flats have the same purpose: to take up time and move price sideways. To achieve this purpose the second structure in the double normally ends about the same level as the first, so subminuette wave y may be expected to end about 1,088.
Within doubles, the two structures are joined by a correction in the opposite direction labelled X. This may be any corrective structure. It may make a new low below the start of the first corrective structure, so there is no lower invalidation point for this wave count for that reason.
Subminuette wave x looks like it may be unfolding as a simple zigzag and that is the most common structure for X waves. Within subminuette wave x, micro wave B may not move beyond the start of micro wave A above 1,088.11. At this stage, micro wave B looks like it may be unfolding as a time consuming triangle.
With micro wave B now possibly incomplete, a target may not yet again be calculated for micro wave C downwards. The channel about subminuette wave x would probably still be the same and downwards movement may still probably find support at the lower edge of it. Micro wave C would most likely be about equal in length with micro wave A which was 21.94.
When subminuette wave x is complete, then choppy overlapping sideways movement for a second corrective structure would unfold over a few days. Of all three ideas for minuette wave (ii), this one may require longer to complete. It may take another twelve days to total a Fibonacci twenty one.
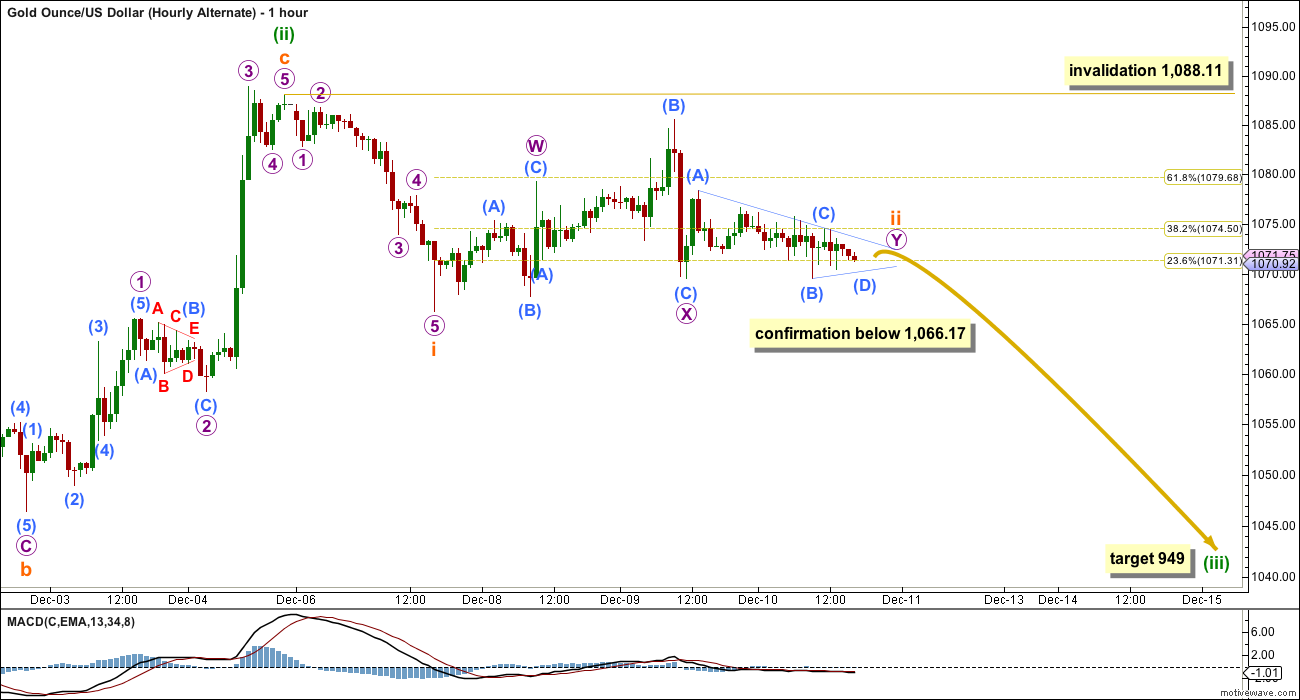
SECOND ALTERNATE HOURLY WAVE COUNT
Click chart to enlarge.
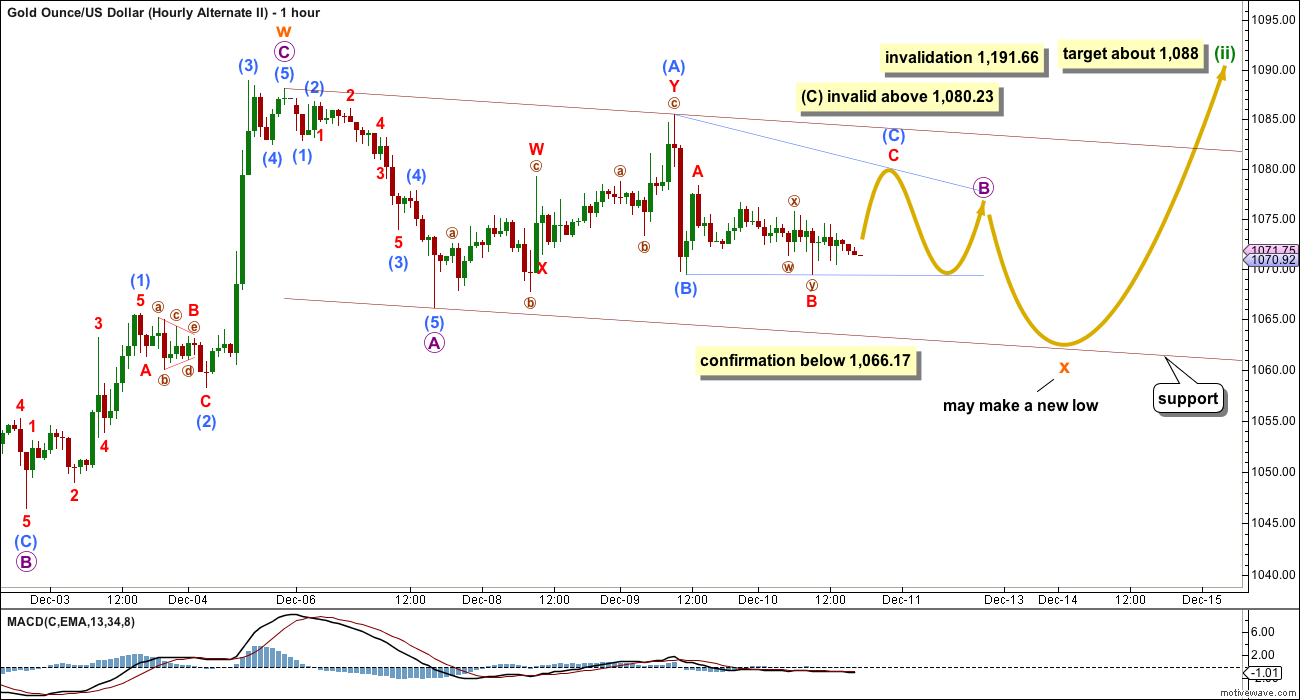
This new alternate idea looks at minuette wave (ii) as a combination, with the first structure a zigzag joined by a three (a zigzag) in the opposite direction labelled X and the second structure a triangle.
At this stage, it does look like a triangle is completing. This perfectly explains two consecutive inside days and MACD hovering about zero. The question is where does the triangle begin and what was the direction of entry into it. When triangles complete price exits the triangle in the same direction it entered.
If the triangle is seen as beginning at the low labelled subminuette wave x, then the trend lines fit and all subdivisions fit perfectly. Of all the ideas I have tried for triangles in current movement, this one has the best fit and best overall look. This idea sees price entering the triangle downwards, so when the triangle is complete price should exit downwards.
This triangle would be a regular contracting or barrier triangle. If micro wave D moves lower, it may not move substantially below the end of micro wave B at 1,066.17; as long as the B-D trend line remains essentially flat the triangle will remain valid.
Micro wave E may not move above the end of micro wave C at 1,085.51. This invalidation point for this idea is black and white. I would not want to move micro wave C any higher.
This idea may see another four days of choppy overlapping sideways movement in an ever decreasing range before a swift strong downwards breakout.
THIRD ALTERNATE HOURLY WAVE COUNT
Click chart to enlarge.
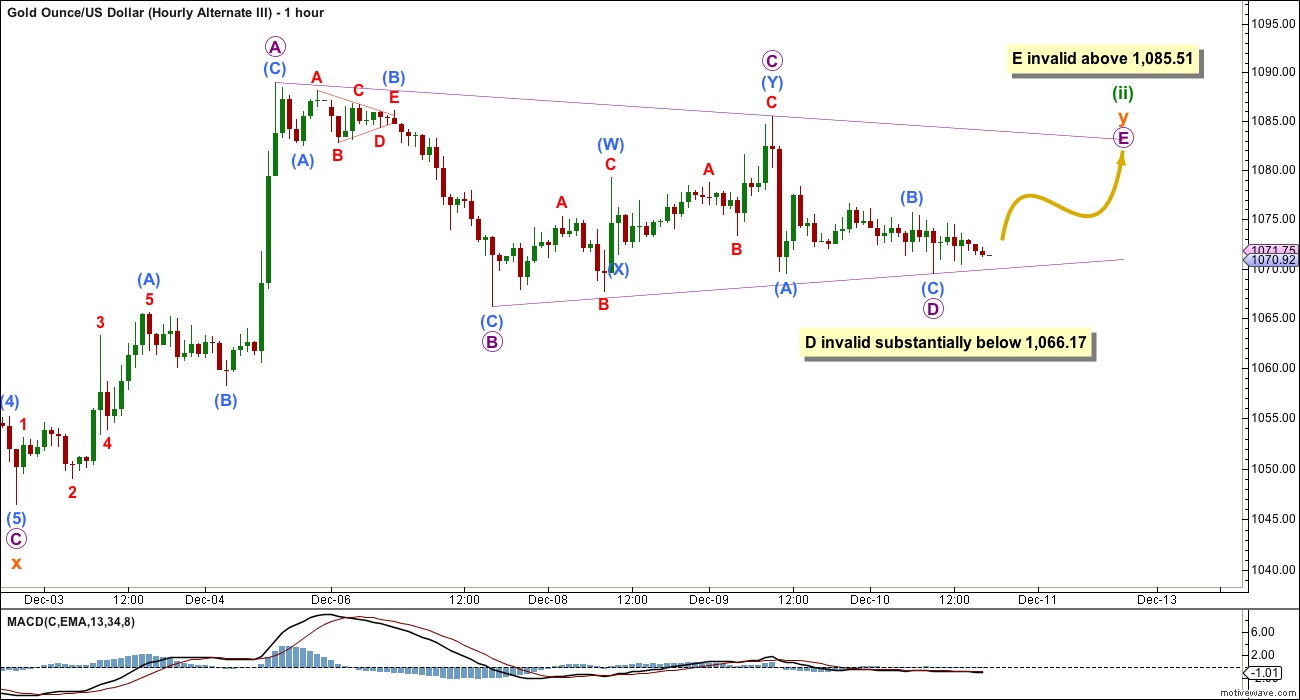
This third (it was the second yesterday) alternate wave count is least likely. It looks at minuette wave (ii) as a complete expanded flat.
This would be a very quick and shallow second wave correction, but the possibility must be considered.
If the main wave count is correct (as opposed to the alternate daily wave count below), then there should be a strong downwards pull from the middle of a big third wave at this stage. Surprises to the downside may turn up.
For this wave count a third wave down is expected. The following correction for a fourth wave may not move back into first wave price territory. The structure of downwards movement should indicate which of the two alternate wave counts is correct.
ALTERNATE ELLIOTT WAVE COUNT
Click chart to enlarge.
I am aware that this is the wave count which EWI and Danerics have. The implications are important, so I will follow this wave count daily for members here too.
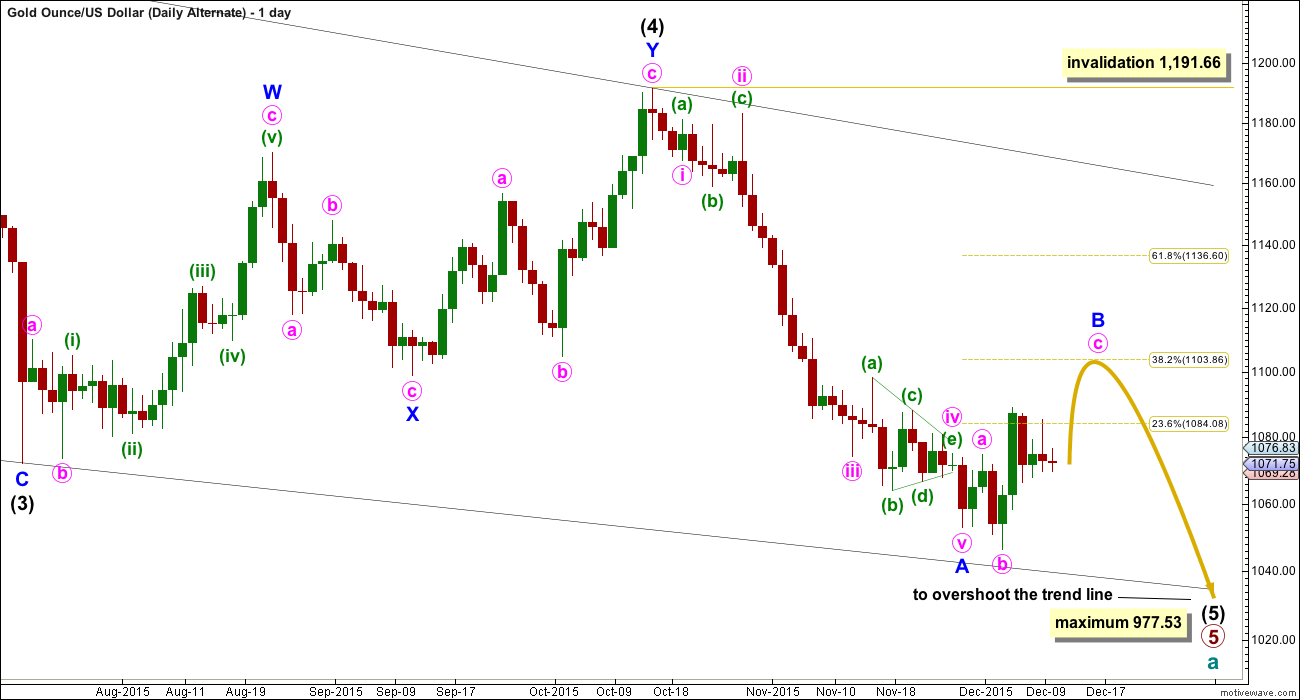
Everything is the same up to the end of the triangle for primary wave 4. Thereafter, primary wave 5 is seen as an ending contracting diagonal.
Within the ending contracting diagonal, it is not possible to see intermediate wave (2) as a zigzag and meet all Elliott wave rules. To see an explanation of why see this video at 10:25.
The same problem exists for the ending diagonal of primary wave 5 itself. Intermediate wave (3) is longer than intermediate wave (1) which would suggest an expanding diagonal, but intermediate wave (4) is shorter than intermediate wave (2) and the trend lines converge which suggests a contracting diagonal.
From “Elliott Wave Principle” by Frost and Prechter, 10th edition, page 88: “In the contracting variety, wave 3 is always shorter than wave 1, wave 4 is always shorter than wave 2, and wave 5 is always shorter than wave 3. In the expanding variety, wave 3 is always longer than wave 1, wave 4 is always longer than wave 2, and wave 5 is always longer than wave 3.”
This structure violates the rules for both a contracting and expanding variety. If the rules in Frost and Prechter are accepted, then this is an invalid wave count.
It may be that the rules need to be rewritten to add “sometimes a third wave may be the longest within a contracting or expanding diagonal”. But I have never seen Robert Prechter publish such a rule, I do not know that it exists.
I cannot reconcile this wave count from EWI with the rules in Frost and Prechter.
If an ending contracting diagonal is unfolding, then the (1) – (3) trend line may be overshot signalling the end of intermediate wave (5). If price behaves thus and turns around and moves strongly higher, then this wave count must be accepted and the rules for diagonals will need to be rewritten.
I will continue to follow this possibility as price moves lower.
Intermediate wave (5) should be shorter than intermediate wave (1). At 977.53 intermediate wave (5) would reach equality in length with intermediate wave (1). A new low below this point would take this possible diagonal structure too far from the rules. At that stage, it really should be finally discarded.
All sub waves within ending diagonals must subdivide as zigzags. Within the zigzag of intermediate wave (5), minor wave B should unfold over several days. At this stage, there is no divergence between this idea and the main Elliott wave count.
Minor wave B may not move beyond the start of minor wave A above 1,191.66.
I am uncomfortable with publishing this wave count and I only do so because it has been published by Elliott Wave International. I am not comfortable with publishing any wave count which violates the rules in Frost and Prechter. However, when looking at primary wave 5 on the weekly chart it does look like a diagonal is unfolding.
Short to mid term there is no divergence in expected direction between this wave count and the main wave count.
TECHNICAL ANALYSIS
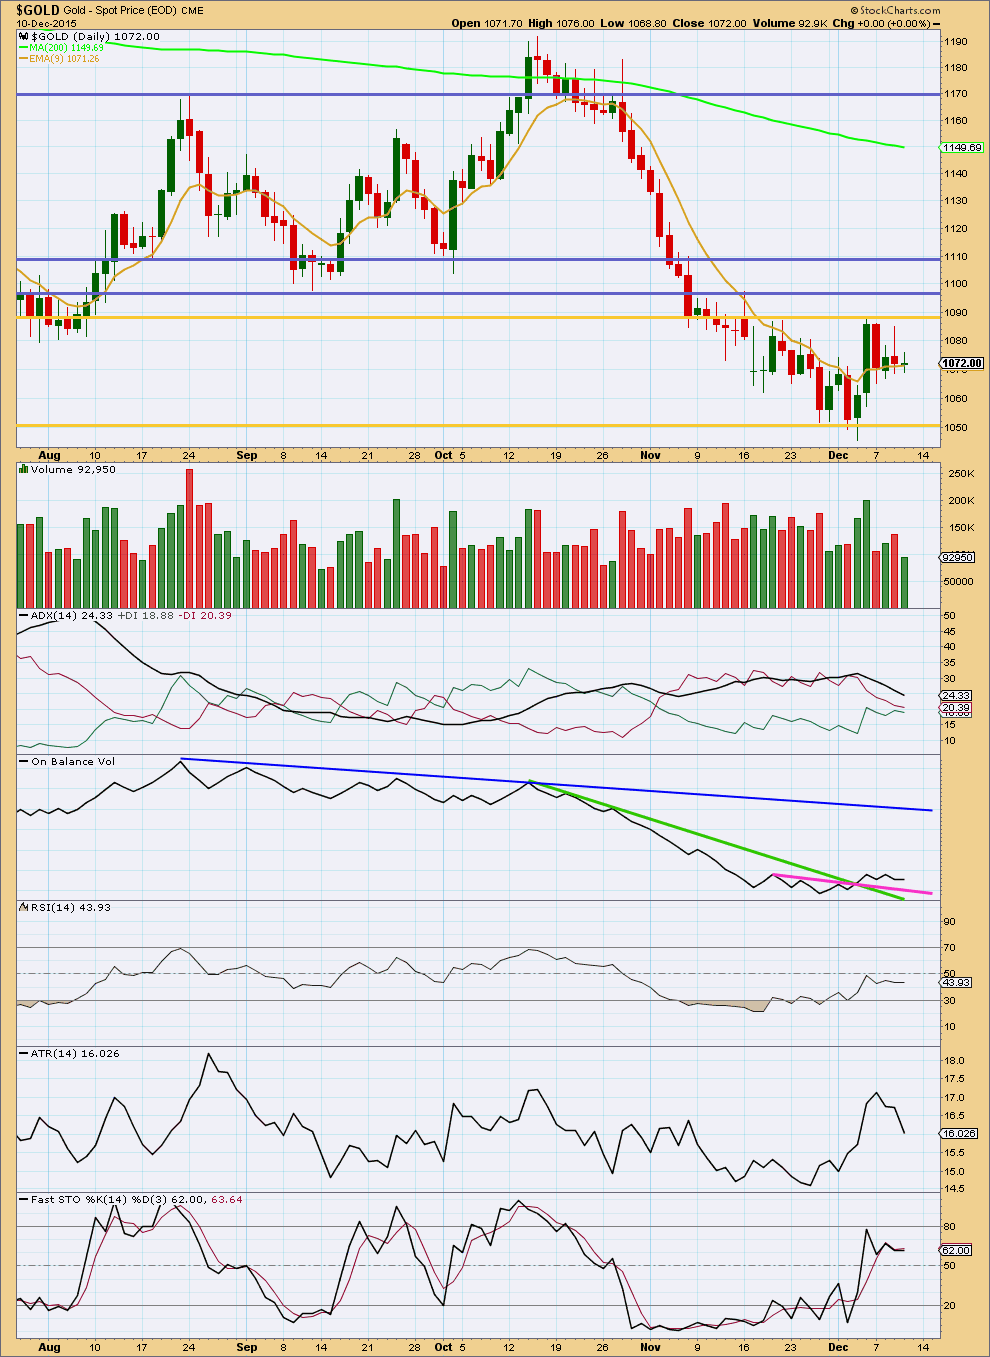
Click chart to enlarge. Chart courtesy of StockCharts.com.
Volume for the last four days is light. ADX is declining as is ATR. This together indicates price is consolidating. A breakout would be indicated with a break above or below either of the gold horizontal trend lines, preferably on increased volume for confidence.
Overall, light volume supports the idea of a correction currently unfolding. The last strong day was an upwards day of 4th December. This indicates more upwards movement should unfold from here.
Price should be expected to swing between support and resistance while price remains within the gold horizontal lines. At this stage, more upwards movement should be expected to continue and to only end when price finds resistance and Stochastics reaches overbought at the same time.
This analysis is published about 06:38 p.m. EST.
At this stage I will have just two hourly wave counts.
The first will be the main preferred wave count which sees minuette (ii) an incomplete double combination or double flat.
The X wave is now a complete zigzag. Chart attached.
This idea now expects choppy overlapping movement to continue for a few days, maybe another three days (this expectation may be too brief) so that minuette (ii) totals a Fiboancci 13. Or a further 11 days for a total Fibonacci 21.
I will also spend some time looking for alternate ideas for minuette (ii).
IMHO Gold price ought to be looking to top now with a possible break above 1079….
Now that gold has put the bottom Lara will have one wave count out of these three alternate.
It will be interesting to see today’s COT report as well.
Not much movement today on COT, my blue line dropped a little, I am targeting 12/22 to 1/5 for my buy period.
Lost a $100 on the GDR puts, they were up this morning, but down in the afternoon. Out of the trade, just going to wait on gold here.
Have a great weekend all.
Richard’s post: “Lara may be able to give investing advice legally around April.”
April 2016 when the PM Sector will begin the bull trend. 2016 will be a profitable year.
Want to mention that gold has made major bottoms in April and August historically. I believe April matches Lara’s time frame for the 5a bottom.
Lara, I have a request (I hope you won’t be offended by this housekeeping request). I noticed you refer to the First alternate with a file name of HourlyAlternateII (and that prints on the chart) and refer to the Third alternate with a name of Hourlyalternate. This is confusing . I’ve been meaning to request this for some time as I see this occurs often. Can you save the charts under the name by which you refer to them? I know re-saving them/re-naming may seem tedious and an insignificant aspect of the excellence you provide, however it makes all the difference when trying to keep things straight by us wee ones in a fast-paced environment.
Appreciate your looking into this.
BTW – I meant to post a congratulations on your following the gold movement over the past couple days. The multiple EW scenarios you presented (and during market hours) were ‘right on’.
Fair enough.
I used to be more careful with this, but after a Motive Wave update it became a nuisance.
When I want to change the name of a wave count I have to close it, change the name then exit Motive Wave and re enter. Then I have to reset all my lines. It’s a hassle, so often I just don’t do it.
But I’ll be more careful to do it, because as you say it can be confusing.
It’s not an issue for me. I just go by the name in your post. I never even look at your motive wave file names.
Wow, I had no idea it was so horrible to re-name these. One suggestion that might make it easier…. start naming the charts something irrelevant to position. That is for example, name cat dog bird fish, then we can match them without confusing ourselves. Or, less exciting you could name the chart by its respective structure. For example, triangle, combination, zigzag. Then when you can switch the order around as needed. Kinda hope you pick the EW naming convention cause it would be kinda silly to see charts named 10 carat, 18 carat 24 carat. And a fish in first place with a bird following a cat — don’t know about that one!
Being kinda silly.
Food for thought. 🙂
MTLSD
Here is post from goldtent. We follow 15 indicators to come up with buy /sell signals.
It is spreadsheet of positions in SM/PM sectors.
http://goldtadise.com/?p=357341
Of course I do check Lara’s ew projections before taking position. Combination has worked well to keep me out of trouble.
Oscar on Market, FED , Crude oil and gold.
http://m.coolworks.com/Stocks/DailyVideo.aspx
Hey, has anybody here heard about Martin Armstrongs forecast about gold for 2016? I know as probably most of you that he predicts a rally. I truly believe in EW principle and daily follow Lara’s analysizes and adds some of mine. I’m very curious about what he said about gold at the World Economic Conference. It would be great to combine EW with his predictions!
Main hourly wave count was invalidated when gold dropped to 1,065.91 at 10:03 pm EST
Completely new wave count is needed now. Other alt wave counts are not valid.?????
Not quite. The double combination is still working, and X is now a complete zigzag which found support right at the lower edge of the channel.
Now it would need a second corrective structure.
Start with the resources on this site. Lara’s wave notation is posted on the right panel, then also go to the Education tab on the right. Then buy yourself a copy of this book:
http://www.amazon.com/Elliott-Wave-Principle-Market-Behavior/dp/1616040491
I want to learn and understand these basic terms like primary wave,intermediate wave,micro,minute,subminute wave etc of EW count
Can anyone link me a video..
Thank u
I posted my reply above.
Thank u
Better book on Elliott wave learning is the one Lara uses. It is 10th edition of Elliott Wave Principle by Frost and Prechter.
Invalidated..
Yesterday i suggested this commodity is becoming unpredictable and we must be on the sell side and playing with these small corrections is like burning our hands…
Lara always say that trading corrections is not advisable..corrections are used to join the trend..
I totally agree her as i got trapped in oil correction last week and made lossess… 🙁
Losses must be an accepted part of trading.
Measuring risk and reward, only entering a trade if the risk is acceptable, and minimising risk to an acceptable amount, is the difference between profit and loss.
Even a not good strategy can be profitable if risk is managed well.
And no one ever will always be right. I will be wrong. Often. The reason why you may remain a member, and many have, is I aim to be right more often than wrong.
Risk management is the key though. The most important aspect of trading.
Yes you are totally right and i agree with you..
Even with the main hourly invalidated, I don’t think the correction is over. A variation of the 1st alternate hourly may be in play. The x wave may be near completion and a move up may start tomorrow morning.
Dreamer excellent forecast.
Thanks. This seems to be the preferred count now, although it may not go as high as my chart shows. I think 1090-1110 is the target zone.
Invalidation for main hourly wave count is 1066.17,
And confirmation for other alternate counts.
I picked up a few puts today, not much but think we drop here. Could be wrong, didn’t risk much.
Which options GLD or futures option???
GDX.
I am still looking at my COT analysis, ideally we would see 2 to 3 more weeks lower here. Plans at this point are still to start taking some longer term positions over the holidays.
I already have. Bot some juniors and seniors for the coffee can.