
The correction continues as expected.
Summary: There is still more than one possible structure which may be unfolding for this correction, but what is clear is that the correction is still very unlikely to be over. It may now continue for three more days to total a Fibonacci thirteen, or eleven more days to total a Fibonacci twenty one.
New updates to this analysis are in bold.
To see weekly charts and the difference between the two wave counts go here.
MAIN ELLIOTT WAVE COUNT
Click chart to enlarge.
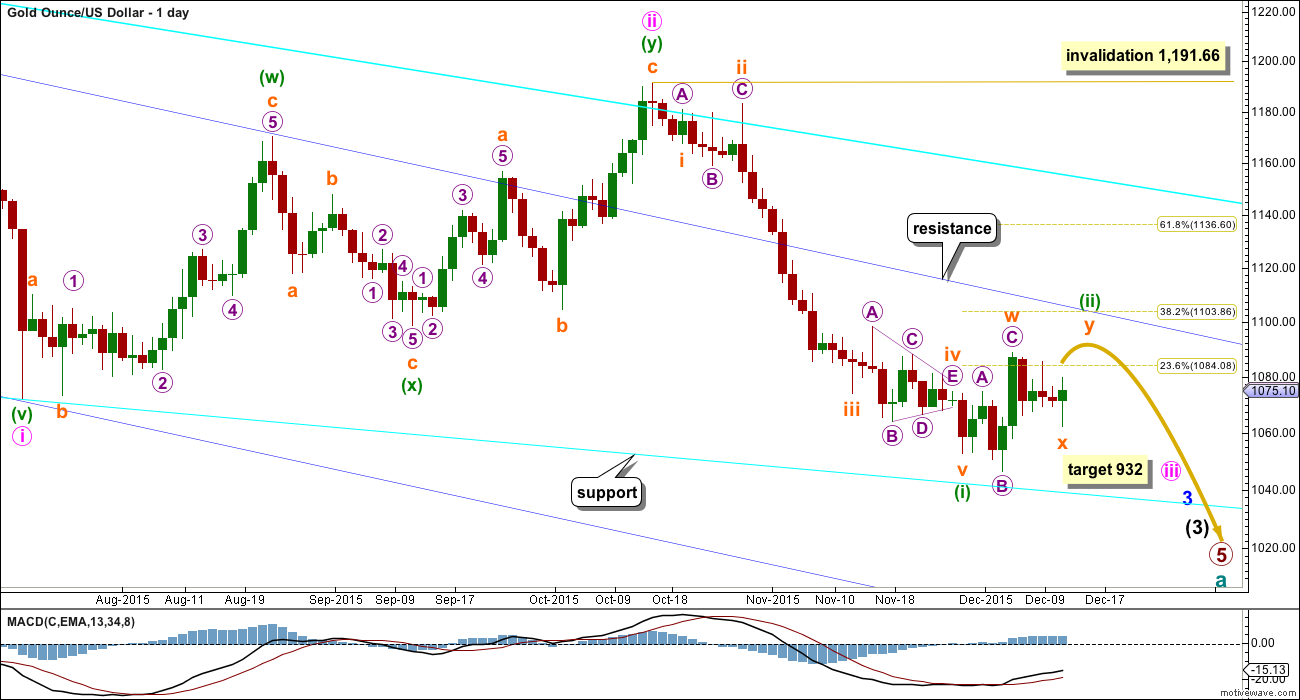
Gold has been in a bear market since September 2011. There has not yet been confirmation of a change from bear to bull, and so at this stage any bull wave count would be trying to pick a low which is not advised. Price remains below the 200 day moving average and below the cyan trend line (copied over from the weekly chart). The bear market should be expected to be intact until we have technical confirmation of a big trend change.
The final line of resistance (cyan line copied over from weekly charts) is only overshot and not so far properly breached. While this line is not breached the bear wave count will remain possible. Simple is best, and the simplest method to confirm a trend change is a trend line.
Minute wave ii is a complete double zigzag and deep at 0.75 the length of minute wave i. It has breached the dark blue base channel drawn about minor waves 1 and 2, one degree higher. When a lower degree second wave correction does this it reduces the probability of the wave count but does not invalidate it. Base channels most often work to show where following corrections find support or resistance, but not always.
At 932 minute wave iii would reach 1.618 the length of minute wave i.
Minuette wave (i) is complete.
Minuette wave (ii) may find resistance at the upper dark blue trend line. This may see it end about the 0.382 Fibonacci ratio of minuette wave (i) at 1,104.
Minuette wave (i) lasted 31 days, three short of a Fibonacci 34. So far it has lasted ten days. A further three days may see it total a Fibonacci thirteen. If it does not end in a further three days, then the next Fibonacci number in the sequence is twenty one which would see a further eleven days from here.
I have again three hourly charts today. The main hourly wave count at this stage may be the most likely, the first alternate is also reasonably likely, and the third is unlikely.
MAIN HOURLY WAVE COUNT
Click chart to enlarge.
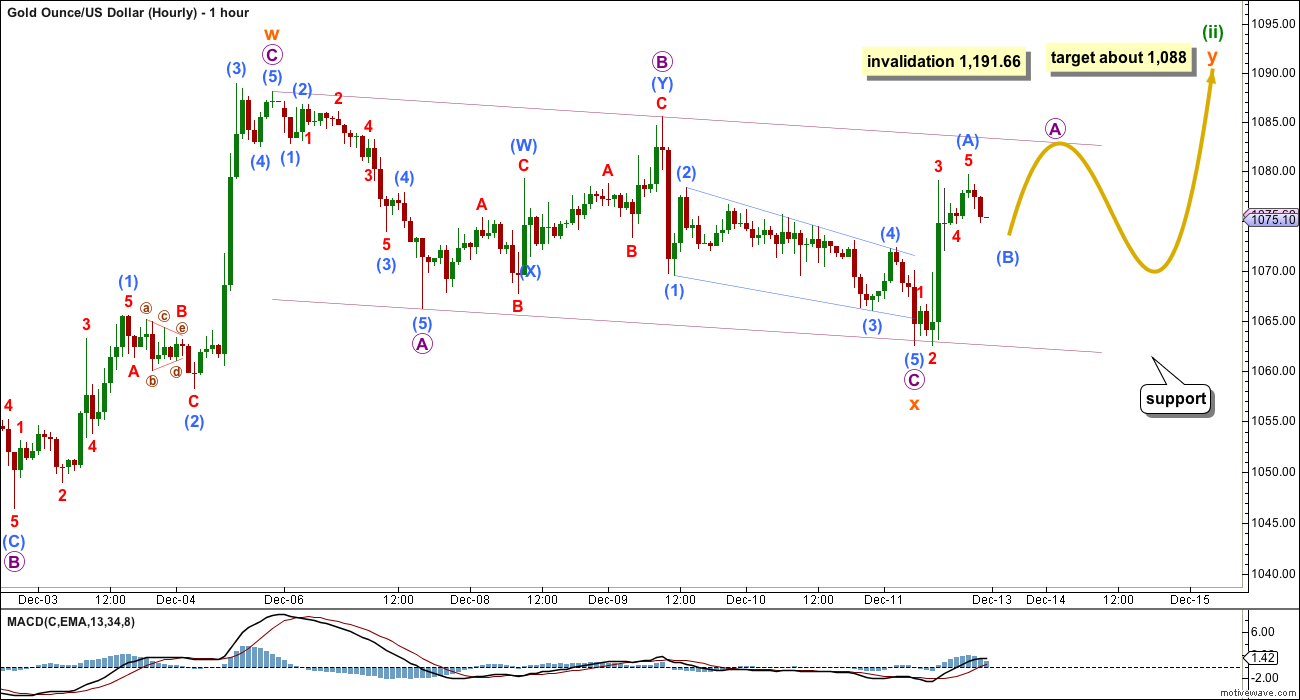
This main wave count looks at minuette wave (ii) as an incomplete double combination or double flat.
The first structure in the double is an expanded flat labelled subminuette wave w.
The double is now joined by a completed three, a zigzag, in the opposite direction labelled subminuette wave x.
The second structure in the double would be labelled subminuette wave y. It may be a flat, zigzag or triangle. A flat or zigzag is much more likely than a triangle.
Subminuette wave y should end about the same level as the first structure in the double, so that the whole correction moves sideways. It should end about 1,088.
If subminuette wave y is an expanded flat, it may include a new low below its start at 1,062.54. It may also include a new low below 1,046.48. There is no lower invalidation point for this wave count.
Subminuette wave y would most likely take about another three days to complete. It may be very choppy and overlapping, if it is a flat correction, or it may be a quicker simpler zigzag.
FIRST ALTERNATE HOURLY WAVE COUNT
Click chart to enlarge.
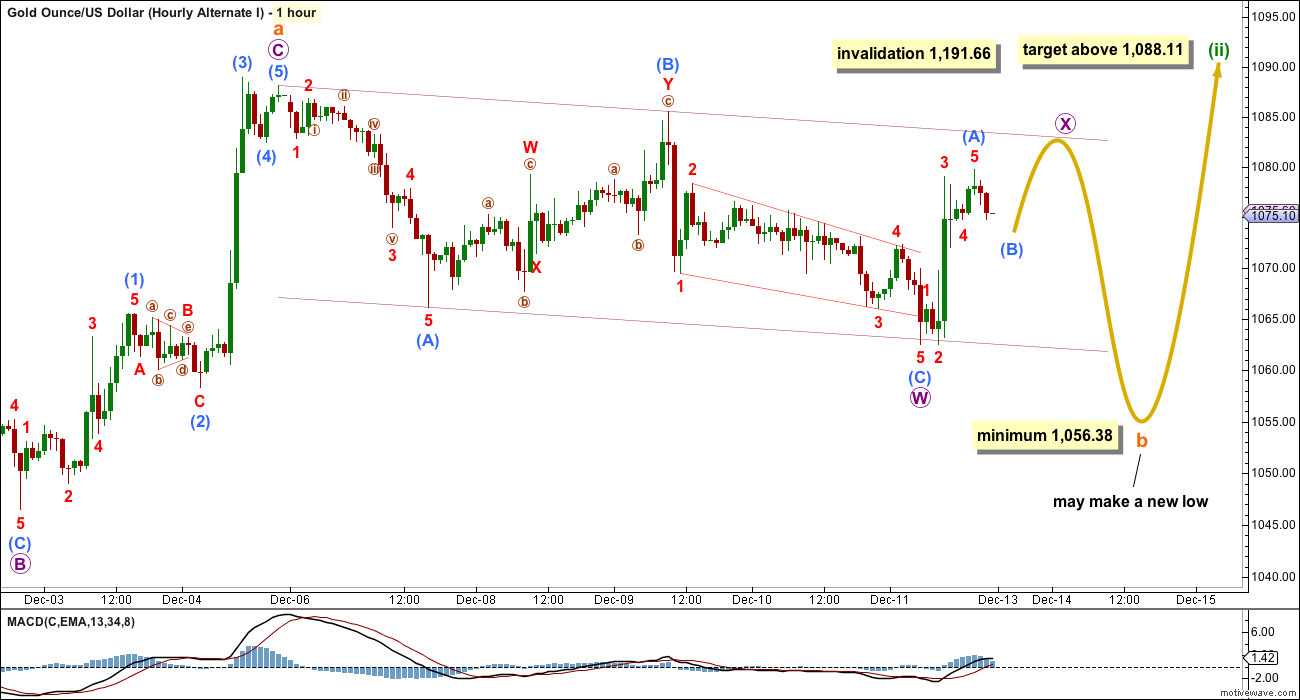
This first alternate wave count today is only slightly less likely than the main wave count.
This first alternate wave count looks at minuette wave (ii) continuing as a single longer lasting flat correction.
Within the flat correction, subminuette wave a is a three wave structure, itself an expanded flat.
Subminuette wave b of a flat correction must retrace a minimum 0.9 length of subminuette wave a at 1,056.38. Subminuette wave b may make a new low below 1,046.48 as in an expanded flat. It must subdivide as a three, and it may be subdividing as a double zigzag.
Within the double zigzag of subminuette wave b, micro wave X must complete as a three wave structure, most likely a simple zigzag. Thereafter, micro wave Y should be a second zigzag to move lower.
When the depth of subminuette wave b is known, then the type of flat, regular or expanding, would be known. At that stage, a target for subminuette wave c to move higher may be calculated.
Subminuette wave c would be extremely likely to at make at least a slight new high above the end of subminuette wave a at 1,088.11 to avoid a truncation.
This second idea may take longer to unfold, possibly a further eleven days to total a Fibonacci twenty one. It would be very choppy and overlapping.
SECOND ALTERNATE HOURLY WAVE COUNT
Click chart to enlarge.
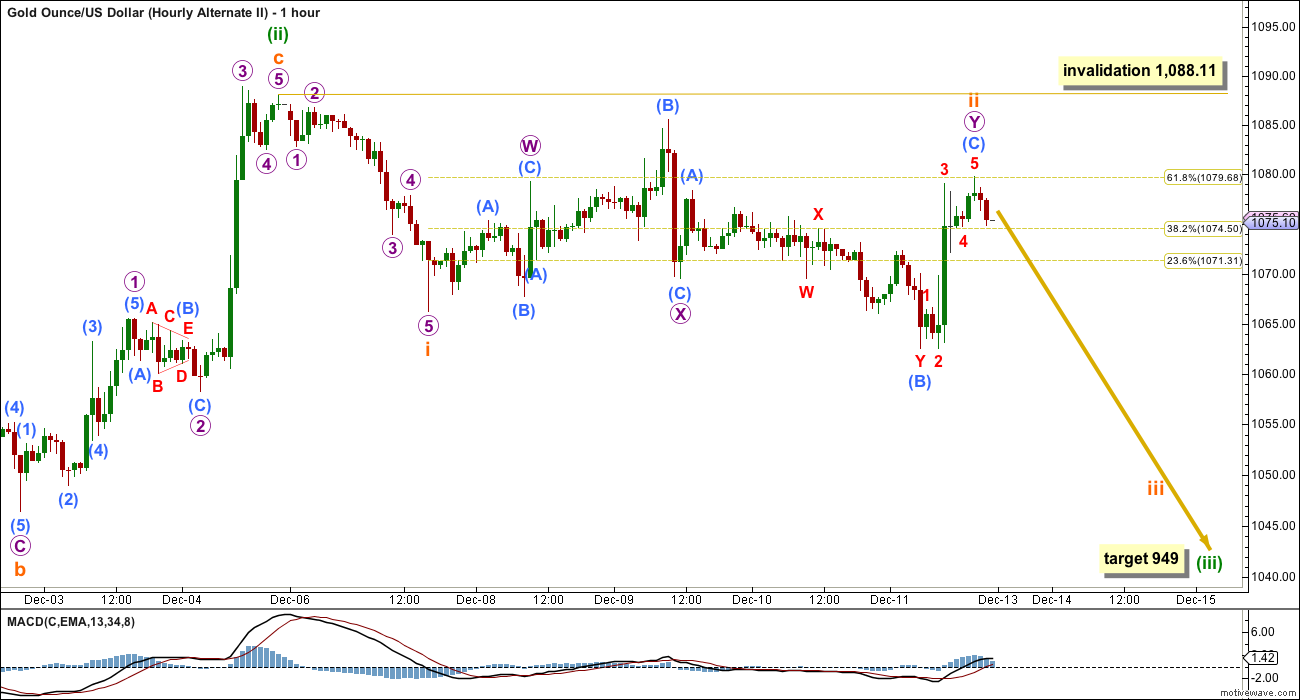
This second alternate wave count is least likely. It looks at minuette wave (ii) as a complete expanded flat.
This would be a very quick and shallow second wave correction, but the possibility must be considered.
If the main wave count is correct (as opposed to the alternate daily wave count below), then there should be a strong downwards pull from the middle of a big third wave at this stage. Surprises to the downside may turn up.
For this wave count a third wave down is expected. The following correction for a fourth wave may not move back into first wave price territory. The structure of downwards movement should indicate which of the two alternate wave counts is correct.
With subminuette wave ii now possibly a time consuming and deep double combination, the probability of this idea has further decreased. It is presented to consider all possibilities, as a what if.
ALTERNATE ELLIOTT WAVE COUNT
Click chart to enlarge.
I am aware that this is the wave count which EWI and Danerics have. The implications are important, so I will follow this wave count daily for members here too.
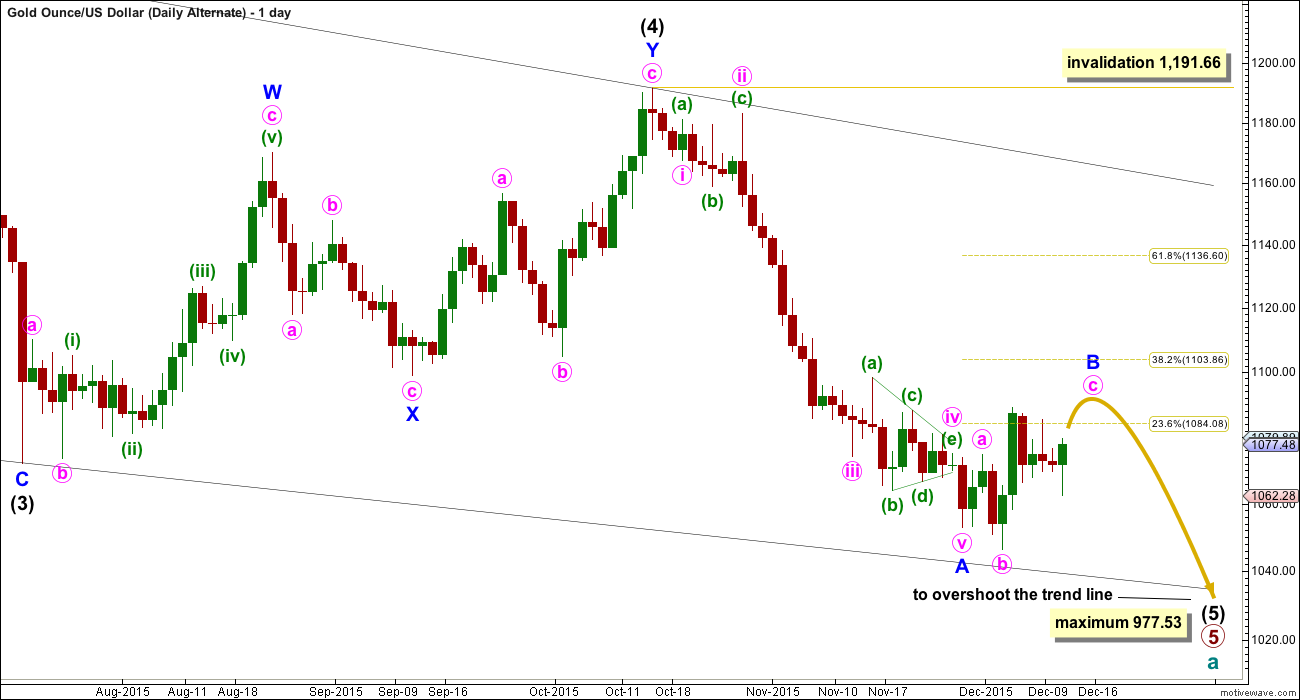
Everything is the same up to the end of the triangle for primary wave 4. Thereafter, primary wave 5 is seen as an ending contracting diagonal.
Within the ending contracting diagonal, it is not possible to see intermediate wave (2) as a zigzag and meet all Elliott wave rules. To see an explanation of why see this video at 10:25.
The same problem exists for the ending diagonal of primary wave 5 itself. Intermediate wave (3) is longer than intermediate wave (1) which would suggest an expanding diagonal, but intermediate wave (4) is shorter than intermediate wave (2) and the trend lines converge which suggests a contracting diagonal.
From “Elliott Wave Principle” by Frost and Prechter, 10th edition, page 88: “In the contracting variety, wave 3 is always shorter than wave 1, wave 4 is always shorter than wave 2, and wave 5 is always shorter than wave 3. In the expanding variety, wave 3 is always longer than wave 1, wave 4 is always longer than wave 2, and wave 5 is always longer than wave 3.”
This structure violates the rules for both a contracting and expanding variety. If the rules in Frost and Prechter are accepted, then this is an invalid wave count.
It may be that the rules need to be rewritten to add “sometimes a third wave may be the longest within a contracting or expanding diagonal”. But I have never seen Robert Prechter publish such a rule, I do not know that it exists.
I cannot reconcile this wave count from EWI with the rules in Frost and Prechter.
If an ending contracting diagonal is unfolding, then the (1) – (3) trend line may be overshot signalling the end of intermediate wave (5). If price behaves thus and turns around and moves strongly higher, then this wave count must be accepted and the rules for diagonals will need to be rewritten.
I will continue to follow this possibility as price moves lower.
Intermediate wave (5) should be shorter than intermediate wave (1). At 977.53 intermediate wave (5) would reach equality in length with intermediate wave (1). A new low below this point would take this possible diagonal structure too far from the rules. At that stage, it really should be finally discarded.
All sub waves within ending diagonals must subdivide as zigzags. Within the zigzag of intermediate wave (5), minor wave B should unfold over several days. At this stage, there is no divergence between this idea and the main Elliott wave count.
Minor wave B may not move beyond the start of minor wave A above 1,191.66.
I am uncomfortable with publishing this wave count and I only do so because it has been published by Elliott Wave International. I am not comfortable with publishing any wave count which violates the rules in Frost and Prechter. However, when looking at primary wave 5 on the weekly chart it does look like a diagonal is unfolding.
Short to mid term there is no divergence in expected direction between this wave count and the main wave count.
TECHNICAL ANALYSIS
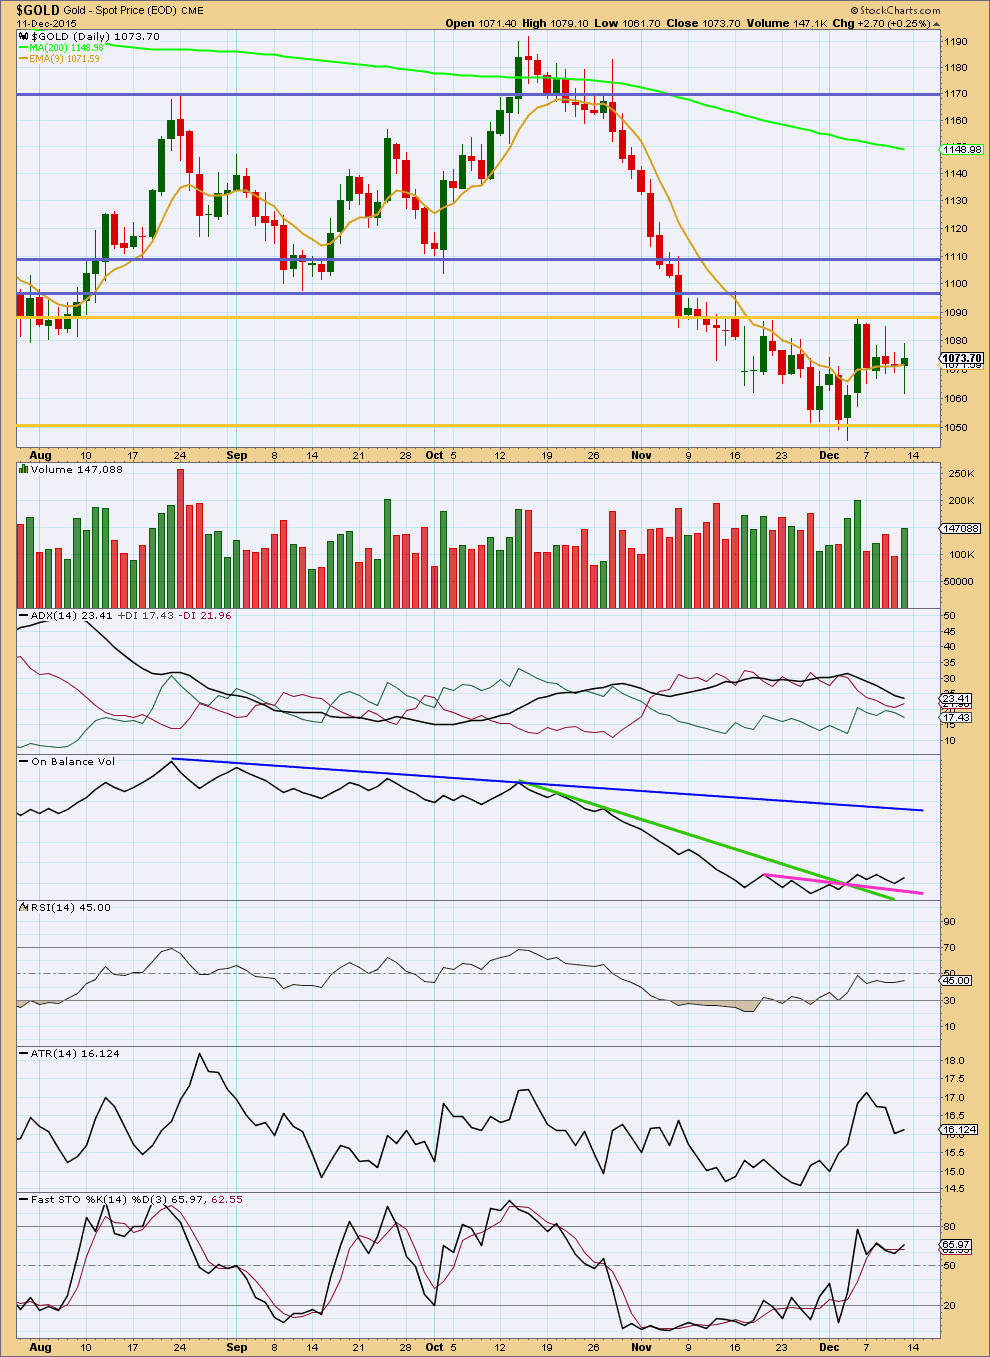
Click chart to enlarge. Chart courtesy of StockCharts.com.
An increase in volume for an upwards day supports the rise in price. This supports the idea that we should expect some more upwards movement as a part of this correction.
Overall, volume remains relatively light for the last five days. During the consolidation the strongest volume is seen for an upwards day. This indicates an upwards breakout would be more likely than downwards. This does not support the Elliott wave count at the daily chart level which expects a downwards breakout.
ADX is declining indicating price is consolidating. ATR agrees as it too is declining.
While On Balance Volume remains above its short term pink trend line, it too is bullish.
At this stage, more upwards movement would be expected to only end when price finds resistance at the upper gold trend line and Stochastics is overbought at the same time.
This analysis is published about 12:13 a.m. EST on 12th December, 2015.
Hopefully 1,058.79 at 4:51 pm Monday was the low for today and gold moves up to 1,088 before FED FOMC 2pm Wed. The earlier low today was 1,063.22 at 1:17 pm.
Gold made new low 1155. Alt 1 in the hunt.
The main and the alt I can both make new lows.
Lara ,why cant i find a gold comment for ∂ec 13th?
Because December 13th was Sunday. Markets are closed.
I’m working on the analysis for Monday 14th now, it’s not published yet. It isn’t usually published until after the NY session ends, and after 6:30pm EST when StockCharts have their volume data finalised.
Here is an updated main hourly wave count.
This downwards movement looks now like it’s subdividing as a five, not a three.
But still, I expect the correction for this second wave is most likely incomplete. That’s the most important thing.
I’ll still expect choppy overlapping movement, this consolidation to continue, for maybe now two more days to total a Fibonacci thirteen. The breakout is expected to be downwards when it is done.
Lara, this chart is really appreciated before the close.
Thanks for your assistance.
No worries. Still working on alternate ideas, so there may be a new wave count if I can see a good one.
The conclusion is the most important bit though; this correction is unlikely to be over.
Will 1062.49 Dec 11th 8:20 am low hold today as down to 1063.34 few minutes ago.
Lara above has wrote that correction will end in two days. FOMC is on the second day. SOOOO if gold gets up to 1088 before than start buying shorts and get out of longs if you have any.
Am I correct????
Sounds good.
We may have a leading diagonal up from the low today, then a wave 2 down and a wave 3 up beginning.
Thanks for your count.
Do you think we may still be in the hourly – micro A or micro X and haven’t begun micro B down yet as that could go very low?
Not sure. Depends on how high this impulse goes. If it gets above 1,088.11, this may be the last move up.
Lara below indicates that main hourly sub micro wave (B) ended by her 4:39 am comment.
I see that at being submicro wave (B) ended at today’s low of 1,065.70 at 3:41 am EST. Maybe micro wave A ended at 1075.21 at 8:45 am?
If so then micro wave B would have to go lower than 1065.70 and may find support below 1,062.54 and may include a new low below 1,046.48 and has no lower invalidation point.
At the hourly chart level I can now see a clear three down, this may be a complete B wave. Now for wave C up to move above A to avoid a truncation.
This would be labelled submicro (B) on the main hourly.
Gunner24 FOMC Crunch time 12/13/2015
Mentions markets and precious metals
http://www.gunner24.com/newsletter/nl-121315/
Don’t be overly presumptive about this Weds being the end of the correction. This is a perfect storm for a maximum amount of pain to be inflicted on the highest number of traders (bulls and bears). Gold will likely swing wildly in both directions and the intermediate path of gold probably won’t be established until at least 24/48 hours later.
I agree Matt. It’s difficult to find anyone not expecting the Fed to tighten and therefore it should all be priced in. However, markets move in mysterious ways and this one more than most.
Also, just because the COT commercials are a little shorter doesn’t mean the correction is necessarily over. I’m not saying I’m bullish. Just that I have absolutely no idea which way it will run post Wednesday.
Whatever may be the outcome of fed…if gold gives me a healthy correction before FED announcement i will probably go short with a minimum quantity atleast…simple formula is to follow the trend…losses will be minimal..
Slight uptick in Commercial Shorts. The bullishness may have peaked.
Commercials continue to be more short in Silver than Gold. I’d say that’s a bearish signal.
That may possibly favour a quicker end to this correction, maybe another three days?
Thank you Lara..
Wednesday being FED meet.. it may supports main hourly count idea of total 13 days…
Any update on oil lara..??..
Its on a very crucial support according to many analysts…
I have an updated daily chart for Oil.
I’m sorry it wasn’t done earlier. But I did not publish it until I had some confidence in the wave count.
It is starting to look a little clearer at this stage. For the last three or four weeks I’ve been lacking in confidence in my Oil wave counts, but today I can say I now have enough confidence to enter a short position there myself. I’ll be looking for an entry point on Monday.
Good luck!
As for “crucial support” I can’t find it.
The closest support I could find was my orange trend line on this chart.
Even looking back at the monthly chart the next support would be the prior low of 32.70 which was way back in January 2009.
Thank you lara 🙂
By saying entering short on monday,what kind of bounce we can see on monday..??..
I mean RSI just getting oversold and minuette (4) about to begun..around what price you think minuette 4 it will end
I don’t think minuette (iv) is going to begin quite yet. The target is 33.61. And when it does begin I expect it to be shallow and only one to three days. I would intend to ride it out, with a stop set close.
I wouldn’t expect a trend change until there’s some divergence (even only between 2 days) from RSI. It can be further oversold before price moves higher for any reasonable time period.
I’ll wait for a correction at the hourly chart level, then time my entry at the 15 min chart level.
Minuette (iv) would most likely end within the fourth wave of one lesser degree; from 36.64 – 38.97…. unless subminuette is extended then minuette (iv) may not reach that high.