
Upwards movement was expected but did not happen.
Downwards movement invalidated the hourly Elliott wave counts.
Summary: Downwards movement is most likely a B wave within an expanded flat. The target for upwards movement from here is 1,086. First, a small channel on the hourly chart needs to be breached by upwards movement and when that is done then the invalidation point may be set at today’s low of 1,050.59. The possibility of a new low will remain while price is in that channel. Technical analysis indicates a low may be in place at this time. There is a hammer and bullish engulfing candlestick pattern at the low, on the hourly chart, and there is divergence with the last low and MACD. On the daily chart, there is divergence with this low and RSI.
New updates to this analysis are in bold.
To see weekly charts and the difference between the two wave counts go here.
MAIN ELLIOTT WAVE COUNT
Click chart to enlarge.
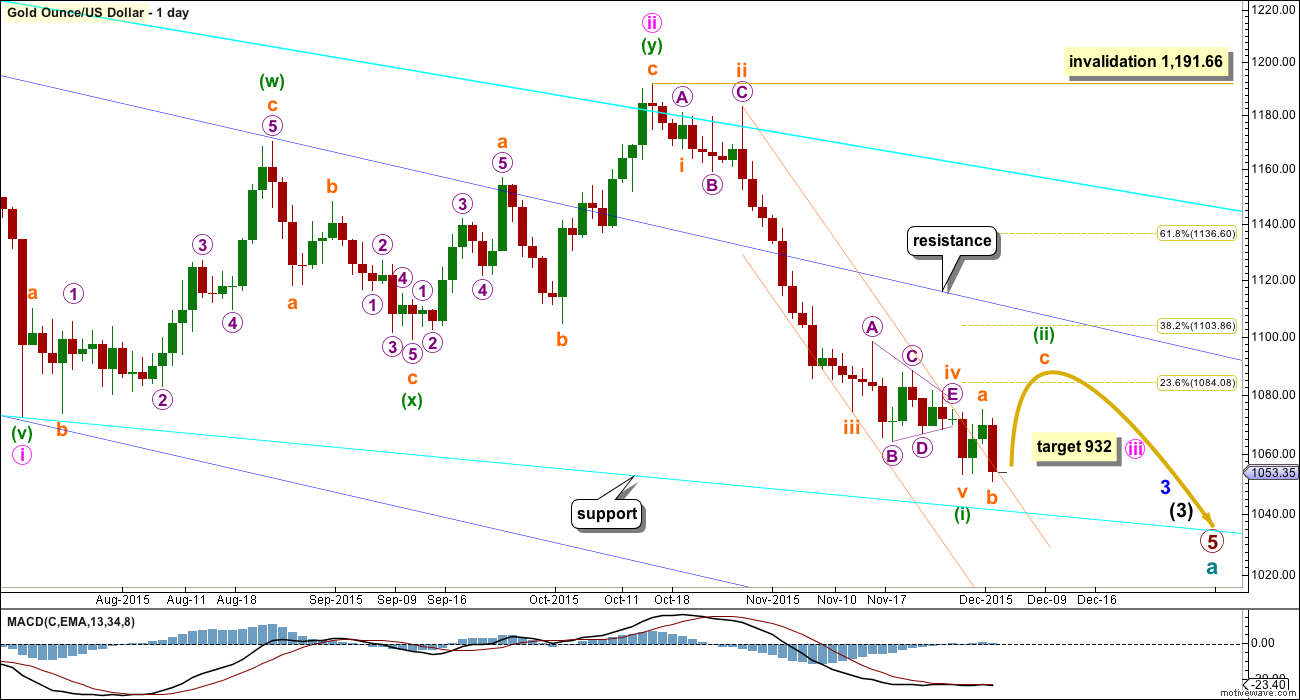
Gold has been in a bear market since September 2011. There has not yet been confirmation of a change from bear to bull, and so at this stage any bull wave count would be trying to pick a low which is not advised. Price remains below the 200 day moving average and below the blue trend line (copied over from the weekly chart). The bear market should be expected to be intact until we have technical confirmation of a big trend change.
The final line of resistance (cyan line copied over from weekly charts) is only overshot and not so far properly breached. While this line is not breached the bear wave count will remain possible. Simple is best, and the simplest method to confirm a trend change is a trend line.
Minute wave ii is a complete double zigzag and deep at 0.75 the length of minute wave i. It has breached the dark blue base channel drawn about minor waves 1 and 2, one degree higher. When a lower degree second wave correction does this it reduces the probability of the wave count but does not invalidate it. Base channels most often work to show where following corrections find support or resistance, but not always.
At 932 minute wave iii would reach 1.618 the length of minute wave i.
Minuette wave (i) is complete.
Minuette wave (ii) may find resistance at the upper dark blue trend line. This may see it end about the 0.382 Fibonacci ratio of minuette wave (i) at 1,104.
Draw a channel about minuette wave (i) using Elliott’s second technique: draw the first trend line from the ends of subminuette waves ii to iv, then place a parallel copy on the end of subminuette wave iii. When price breaks above the upper edge of this channel it should confirm a trend change. Copy the channel over to the hourly chart. This channel is also breached on the daily chart, and so more confidence may be had that minuette wave (i) is over and minuette wave (ii) is underway.
Minuette wave (i) lasted 31 days, three short of a Fibonacci 34. Minuette wave (ii) may be expected to last a Fibonacci 13 or 21 days, with 13 favoured at this stage. It may also be more brief than this due to the strong downwards pull of the middle of a big third wave. Analysis this week and next will focus on identifying a potential end to this correction. At this stage, a new low below 1,031 would see the idea that minuette wave (ii) is continuing discarded. The middle of a third wave down would then be expected to be underway.
Minuette wave (ii) may not now be unfolding as a zigzag or zigzag multiple. It may also not be a triangle. The only two possible structures now would be an expanded flat or a combination. At this stage, I will look at the possibility of an expanded flat (a combination would look mostly the same at the hourly chart level).
MAIN HOURLY WAVE COUNT
Click chart to enlarge.
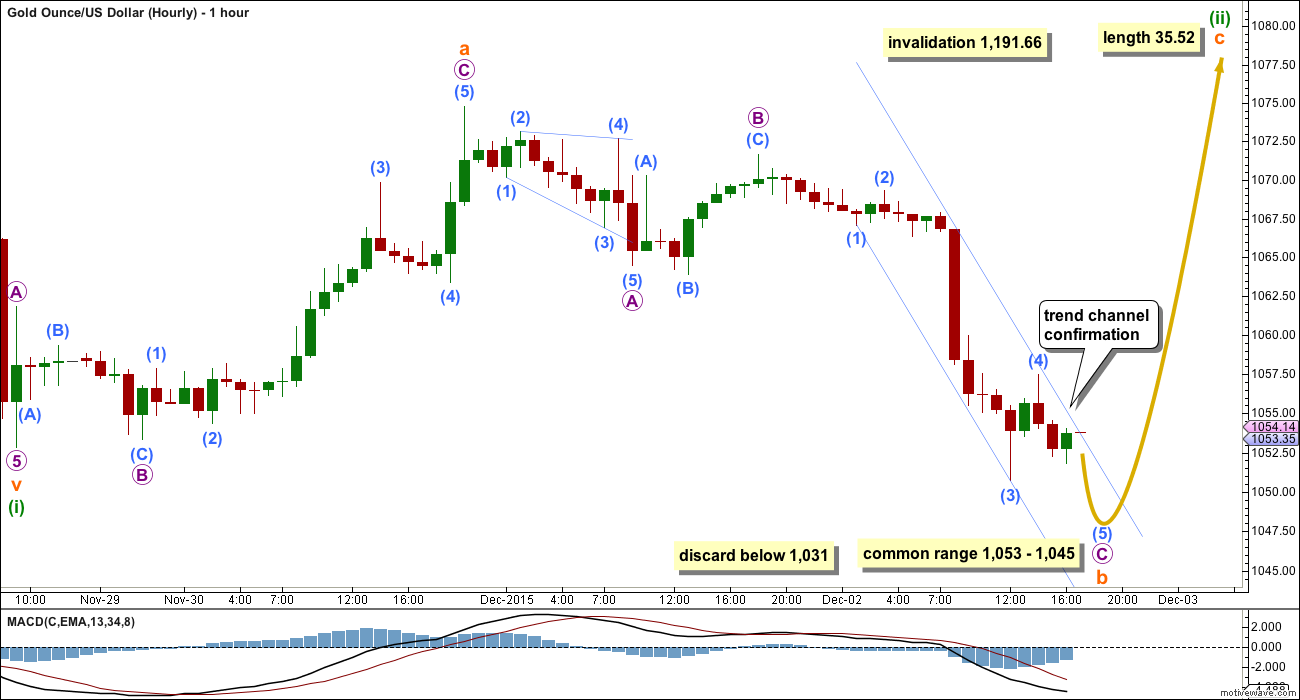
A new low below 1,052.85 invalidated yesterday’s hourly wave counts. Downwards movement may not be a second wave correction within an impulse, nor a B wave within a zigzag. The upwards wave labelled subminuette wave a must be a three and not a five. It will fit well as a three. (This should have been an alternate in yesterday’s analysis.)
We should always assume the trend remains the same until proven otherwise. We should assume that we shall see new lows until the channel about micro wave C is breached by upwards movement.
If subminuette wave b continues, then the normal range for a B wave within a flat correction is between 1 to 1.38 times the length of the A wave. This gives a normal range for subminuette wave b from 1,053 – 1,045.
There is no Elliott wave rule stating the maximum length of a B wave within a flat correction. There is an Elliott wave convention that states when the B wave reaches 2 times the length of the A wave the probability that a flat is unfolding is so low the idea should be discarded. This point would be at 1,031. Subminuette wave b would be most unlikely to end below 1,031.
When subminuette wave b is complete, then subminuette wave c upwards should unfold as a five wave structure. If it is 35.52 in length, it would be 1.618 times the length of subminuette wave a.
Subminuette wave c would be extremely likely to end at least slightly above the end of subminuette wave a at 1,074.80 to avoid a truncation and a very rare running flat.
If minuette wave (ii) is a combination, then this wave count would be relabelled subminuette w-x-y. The second structure would need to be a flat correction or a triangle, with a flat much more likely. Subminuette wave y should end about the same level as subminuette wave w at 1,074.80, so that the whole structure moves sideways. When the idea of a combination diverges from an expanded flat I will chart it separately. For now both ideas expect upwards movement shortly.
ALTERNATE HOURLY WAVE COUNT
Click chart to enlarge.
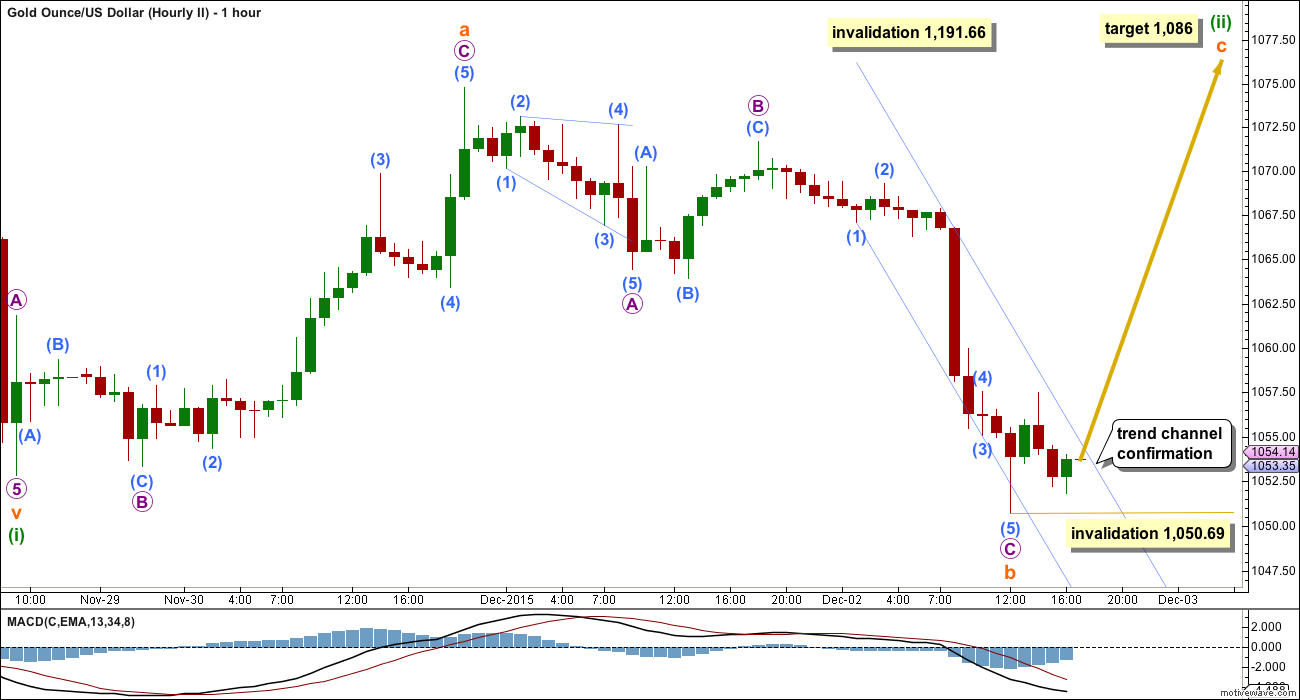
It is possible to see micro wave C as complete. There is a red hammer candlestick pattern at today’s low, which forms part of a small bullish engulfing candlestick pattern with the first green candlestick. This gives some information that a low may be in place. There is also some small divergence with this low and the last low in price, and MACD.
If subminuette wave b is over at today’s low, then it is 1.1 times the length of subminuette wave a, so the type of flat correction would be an expanded flat.
At 1,086 subminuette wave c would move above the end of subminuette wave a avoiding a truncation, and it would be 1.618 the length of subminuette wave a.
No second wave correction may move beyond its start below 1,050.69 within subminuette wave c.
While the candlesticks at today’s low indicate a trend change, there is still no confirmation of this. Only a clear breach of the small channel drawn about micro wave C would provide trend channel confirmation that a low is in place. For this reason this idea is an alternate with a slightly lower probability than the main hourly wave count.
ALTERNATE ELLIOTT WAVE COUNT
Click chart to enlarge.
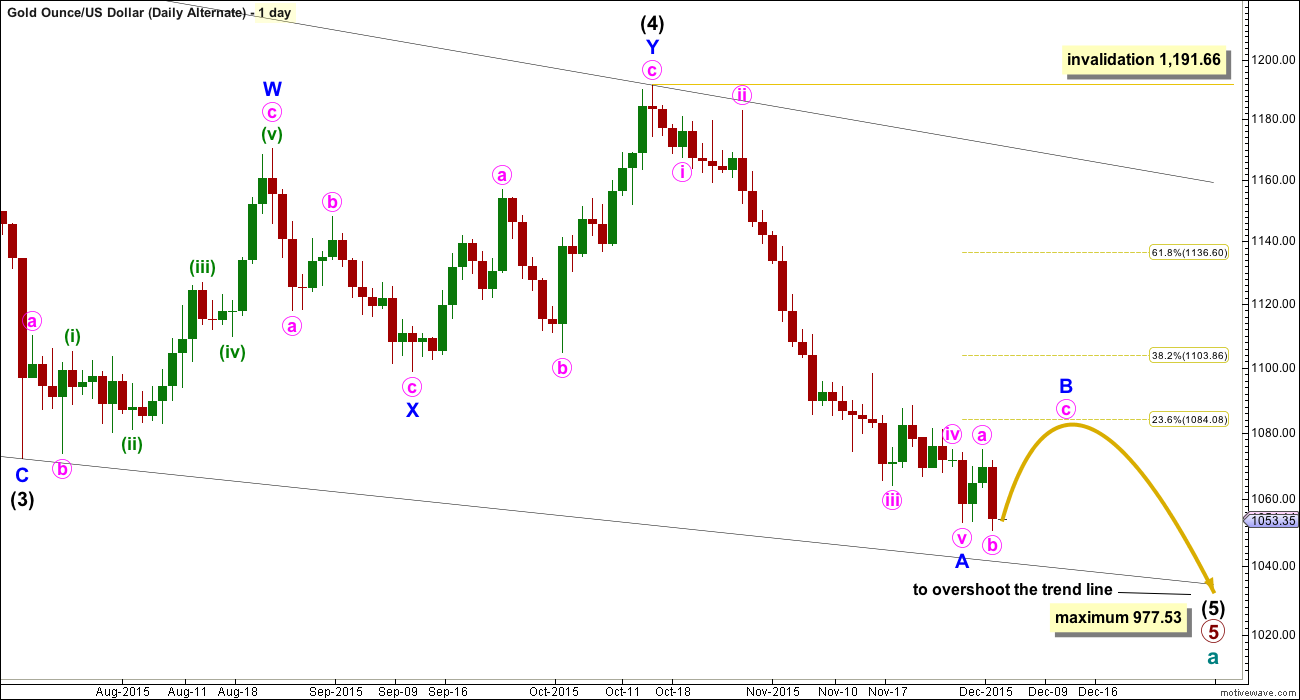
I am aware that this is the wave count which EWI and Danerics have. The implications are important, so I will follow this wave count daily for members here too.
Everything is the same up to the end of the triangle for primary wave 4. Thereafter, primary wave 5 is seen as an ending contracting diagonal.
Within the ending contracting diagonal, it is not possible to see intermediate wave (2) as a zigzag and meet all Elliott wave rules. To see an explanation of why see this video at 10:25.
The same problem exists for the ending diagonal of primary wave 5 itself. Intermediate wave (3) is longer than intermediate wave (1) which would suggest an expanding diagonal, but intermediate wave (4) is shorter than intermediate wave (2) and the trend lines converge which suggests a contracting diagonal.
From “Elliott Wave Principle” by Frost and Prechter, 10th edition, page 88: “In the contracting variety, wave 3 is always shorter than wave 1, wave 4 is always shorter than wave 2, and wave 5 is always shorter than wave 3. In the expanding variety, wave 3 is always longer than wave 1, wave 4 is always longer than wave 2, and wave 5 is always longer than wave 3.”
This structure violates the rules for both a contracting and expanding variety. If the rules in Frost and Prechter are accepted, then this is an invalid wave count.
It may be that the rules need to be rewritten to add “sometimes a third wave may be the longest within a contracting or expanding diagonal”. But I have never seen Robert Prechter publish such a rule, I do not know that it exists.
I cannot reconcile this wave count from EWI with the rules in Frost and Prechter.
If an ending contracting diagonal is unfolding, then the (1) – (3) trend line may be overshot signalling the end of intermediate wave (5). If price behaves thus and turns around and moves strongly higher, then this wave count must be accepted and the rules for diagonals will need to be rewritten.
I will continue to follow this possibility as price moves lower.
Intermediate wave (5) should be shorter than intermediate wave (1). At 977.53 intermediate wave (5) would reach equality in length with intermediate wave (1). A new low below this point would take this possible diagonal structure too far from the rules. At that stage, it really should be finally discarded.
All sub waves within ending diagonals must subdivide as zigzags. Within the zigzag of intermediate wave (5), minor wave B should unfold over several days. At this stage, there is no divergence between this idea and the main Elliott wave count.
Minor wave B may not move beyond the start of minor wave A above 1,191.66.
I am uncomfortable with publishing this wave count and I only do so because it has been published by Elliott Wave International. I am not comfortable with publishing any wave count which violates the rules in Frost and Prechter. However, when looking at primary wave 5 on the weekly chart it does look like a diagonal is unfolding.
Short to mid term there is no divergence in expected direction between this wave count and the main wave count.
TECHNICAL ANALYSIS
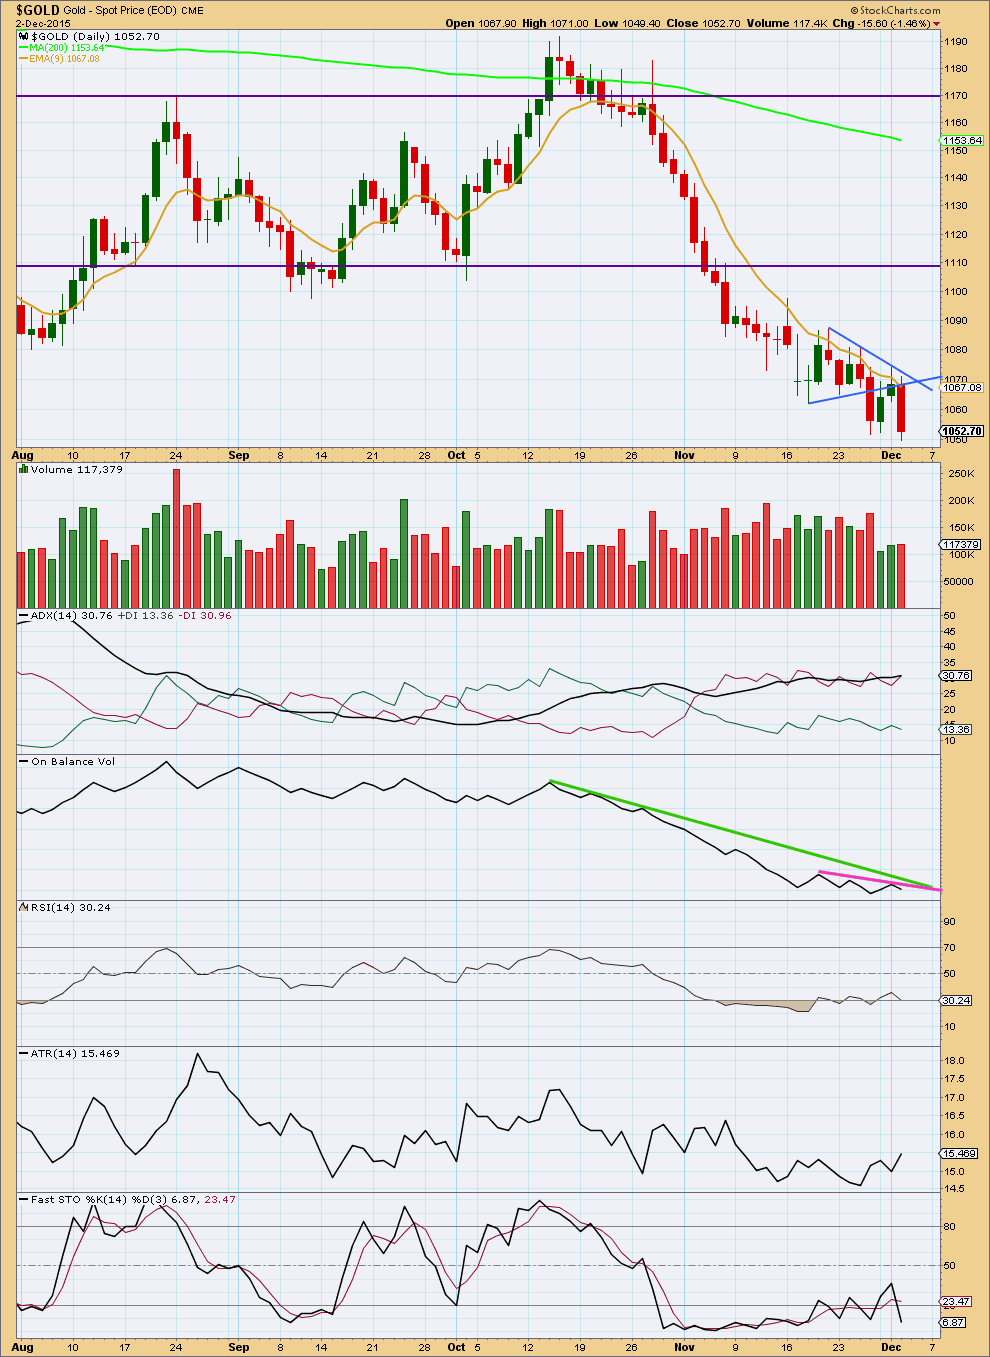
Click chart to enlarge. Chart courtesy of StockCharts.com.
A very slight increase in volume gives some support for downwards movement, but volume for Wednesday is light which is more typical of a consolidation and not a trend.
Upwards movement looks to have found resistance right at the upper edge of the triangle trend line.
ADX still indicates a downwards trend is in place. ATR is beginning to increase again, which is typical of a trend and not a consolidation. However, both of these indicators are lagging.
There is double divergence today between price and RSI: for the last two lows in price RSI has failed to make corresponding lows. This is reasonably strong indication that we should see upwards movement either here or very soon.
On Balance Volume is finding some resistance just below the longer held green line and the new pink line drawn today. If OBV breaks above either of those lines, then I would have strong confidence that we have a short term low in place. For now, while OBV remains below both trend lines, it must be accepted that the risk of a low is not yet in place.
This analysis is published about 06:43 p.m. EST.
Hi,
The dollars dropping – could be in a big second wave.
Looks like everyone could have been fooled!
It certainly makes tomorrow much easier. Many feared that the jobs report was going to be the biggest mover and shaker of the week and thrust the dollar to new heights, but Draghi took all of the air out of it. Gold is now free to correct. I think it is finally safe to say that an intermediate low is in for gold.
Hourly chart so far.
Next I’ll work on an alternate to consider minuette (ii) as a combination. The second structure may be a flat or triangle, which unfortunately could include a new low. I judge the idea to have a somewhat low probability really only because at this stage this correction looks like a really typical expanded flat, but all possibilities should be considered.
Any wave counts?
The main hourly wave count looks right today.
Subminuette b is 1.29 times the length of subminuette a so this is an expanded flat.
The target for subminuette c should be 1,082 – 1,084.
Within it micro 1 is almost complete. I can see an impulse 1-2-3-4 and now in wave 5 upwards. Likely to move above 1,063.26 to avoid a truncation. Target 1,068 it would reach equality with 3.
Will post a chart soon. That would be more useful.
It looks to me that the hourly channel has been breached by at least 1 hourly candlestick up.
“We should assume that we shall see new lows until the channel about micro wave C is breached by upwards movement.”
Watch this Oscar Carboni. Gold at 6 minutes…..
https://www.youtube.com/user/futuresanalysts
Wow! Draghi announces stimulus and gold’s jumping into sub-min wave c. I’m long GG. Go baby go.
Trader DAN take on gold COT and more.
http://goldtadise.com/?p=356844
FYI Lara added two new charts in the last USOil post comments section. More down is now expected.
I’m not comfortable at all with that prediction to be honest.
I’ve tried to see if it could go up from here… technically possible but the diagonal trend lines would look wrong.
Remember Friday 8:30 am US news may move Gold.
FRIDAY, DEC. 4
8:30 am Nonfarm payrolls Nov. 200,000 271,000
Wednesday 8:15 am strong ADP payroll news pushed down gold $15 by 12:30 PM to a new low, due to expectations for an FED FOMC interest rate hike Dec 15-16th.
Yellen Wednesday afternoon gave a speech and supported a rate hike and gold made another new low at 8:20 pm.
Yes I know it was all within EW movements and part of the market gold sentiment.
Gold Breaks $1,050 To 6-Year Low; Goldman Sees Euro Slump 3% In One Day
December 2, 2015, 8:50 P.M. ET
http://blogs.barrons.com/asiastocks/2015/12/02/gold-breaks-1050-to-6-year-low-goldman-sees-euro-slump-3-in-one-day/?mod=yahoobarrons&ru=yahoo
ECB Thursday anouncement may drop EURO, boost US Dollar and push gold down?
You want to follow GS???
Euro up almost 3%
Black Friday For Gold, Too? December 1, 2015 – EW – Avi Gilburt
http://www.gold-eagle.com/article/black-friday-gold-too
Its a roller coaster ride..
Every single person is bearish on metals..im new to EW counts…but im in this market for more than 10years…i firmly believe that this market behaves very surprisingly when theres a one sided shout for the trend…all are bearish here…i think that the friday Nonfarm data and umemployment data will be much better than expected and it is pretty clear for every trader in this market…as well as the december rate hike is pretty sure on the cards…markets already discounted…big playerss are ready to trap small traders creating such a bearish enviornment…i think the final countdown begins for the end of 3rd wave…where..??..market knows:))..
Thanks to Lara for her efforts..
And Is it possible that the drop from 1191 was the start of the final strong wave..as we hav dropped 150 dollars from there in a month…and we are near to complete the large 3rd wave…??.
As i said new to this concept..bear with me .:)
The main wave count does have that drop as the start of a third wave at three degrees. That’s a strong third wave, yes.
Not everyone is bearish as the miners have stayed relatively strong lately even though gold has dropped. Many are bullish however not here and the commercials may be bearish but not everyone and the big players are not out to trap the little guy they may take the money from the Country central banks who are known to made lousy timing. The little guy is free to trade how they want to.
This year gold may drop into the year end for the 5th year in a row.
Another record low $1,048.38 at 8:20 pm
Lara warned us against investing against the trend which is bearish gold.
Good I didn’t buy GDX of NUGT as my 195 minute MACD indicator gave a SELL signal today so I didn’t buy any bullish mining ETF to hold overnight and the warning was right gold just dropped to another record low $1,048.38 at 8:20 pm, which is the lowest since 1,044.53 Feb 5, 2010.
Lara,
Can Minuette wave ii be complete at the high on Nov 30th? That is what I think may be unfolding.
To me that fits with the break of the small consolidation triangle, subsequent backtest, and now continued move down.
M
You mean the high of 1st December? The high which is labelled subminuette wave a?
Yes. Technically.
But as I point out early on in the video although it’s possible it must necessarily have a low probability. The second wave would be remarkably brief and shallow, and would be quicker than the second and fourth wave corrections one degree lower (subminuette waves ii and iv within minuette wave (i) down).
I am still sitting on my hands waiting for the drops to finish. I think the lack of upside move on this correction is telling, if it is still a correction.
Edit: Gold just hit another new low according to investing.com
My mistake, a new low has not been made yet, I was looking on too short of a time frame…
Lara, that’s a wild header picture for this month. What is it? The only thing that I can think of is time lapse on a highway?
Its not a time lapse, it just used a slow shutter speed to blur the light.
Its a street scene, we think it was probably taken in Auckland.