
The target at 1,082 – 1,084 was met and exceeded by 4.94.
Summary: The structure of this C wave upwards is incomplete. A target for it to end on Monday or Tuesday is at 1,104. At the hourly chart level, the invalidation point can be moved up to 1,065.54.
New updates to this analysis are in bold.
To see weekly charts and the difference between the two wave counts go here.
MAIN ELLIOTT WAVE COUNT
Click chart to enlarge.
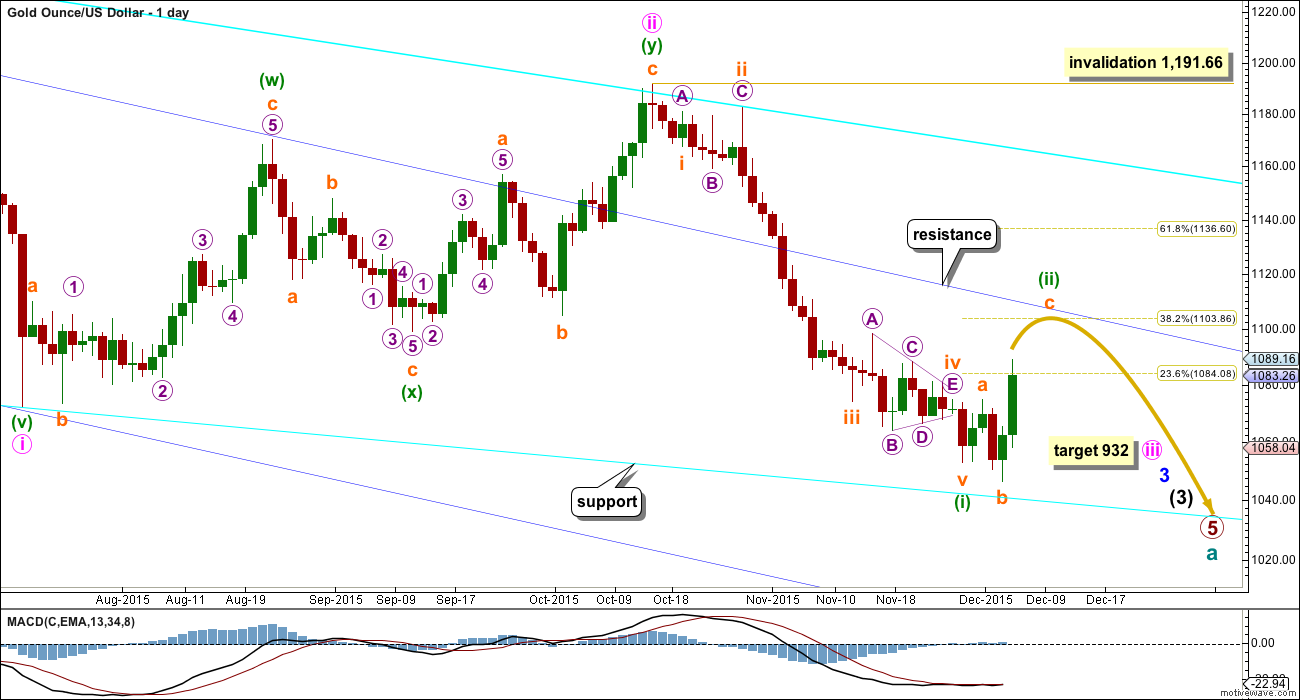
Gold has been in a bear market since September 2011. There has not yet been confirmation of a change from bear to bull, and so at this stage any bull wave count would be trying to pick a low which is not advised. Price remains below the 200 day moving average and below the cyan trend line (copied over from the weekly chart). The bear market should be expected to be intact until we have technical confirmation of a big trend change.
The final line of resistance (cyan line copied over from weekly charts) is only overshot and not so far properly breached. While this line is not breached the bear wave count will remain possible. Simple is best, and the simplest method to confirm a trend change is a trend line.
Minute wave ii is a complete double zigzag and deep at 0.75 the length of minute wave i. It has breached the dark blue base channel drawn about minor waves 1 and 2, one degree higher. When a lower degree second wave correction does this it reduces the probability of the wave count but does not invalidate it. Base channels most often work to show where following corrections find support or resistance, but not always.
At 932 minute wave iii would reach 1.618 the length of minute wave i.
Minuette wave (i) is complete.
Minuette wave (ii) may find resistance at the upper dark blue trend line. This may see it end about the 0.382 Fibonacci ratio of minuette wave (i) at 1,104.
Minuette wave (i) lasted 31 days, three short of a Fibonacci 34. It looks like minuette wave (ii) may be more brief and shallow than second wave corrections normally are, at this stage, due to the strong downwards pull from the middle of a third wave. So far it has lasted five days. If it continues now for a further three days, it may total a Fibonacci eight; give or take one either side of this number would produce an acceptable Fibonacci relationship.
Minuette wave (ii) looks like it is most likely unfolding as an expanded flat correction at this stage. When this structure is complete, then we must consider the alternate idea that the expanded flat is only wave A within the correction. An alternate would then be published that moves the degree of labelling within the expanded flat down one degree and expects minuette wave (ii) to continue further as a larger flat correction, double flat or combination.
Minuette wave (ii) may not now be unfolding as a zigzag or zigzag multiple. It may also not be a triangle. At the end of this week, it also looks very unlikely to be a double combination as I had labelled it previously with the second structure underway, but it may yet be a double flat with this expanded flat only the first of two.
MAIN HOURLY WAVE COUNT
Click chart to enlarge.
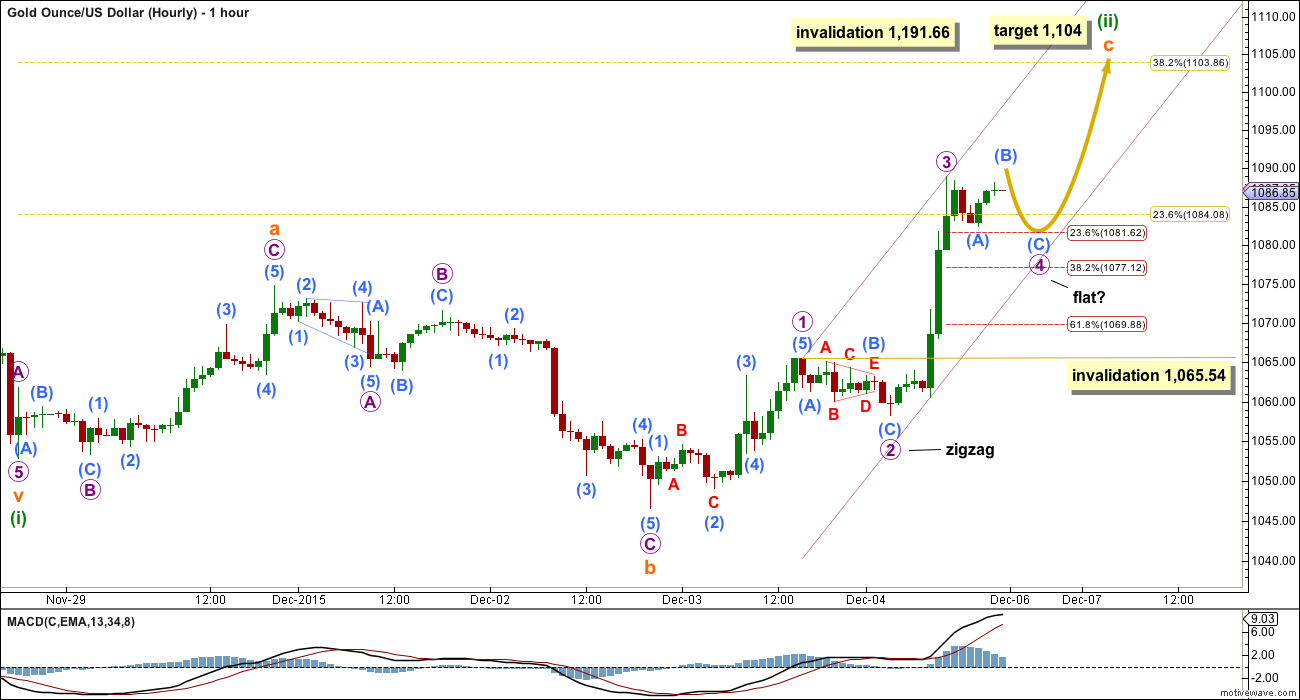
Subminuette wave c is unfolding as a simple impulse.
Within subminuette wave c, there are two ways to look at micro wave 3. It may be over as labelled here, or it may yet require a final fifth wave as per the labelling on the alternate hourly chart below. It is more likely that it is over here. The subdivisions fit, it has a typical impulse look for Gold, and it is just 0.17 short of 1.618 the length of micro wave 1.
Micro wave 2 was a zigzag and shallow at 0.381 the depth of micro wave 1. Micro wave 4 should exhibit some alternation. It may be unfolding as a flat correction and it may be more shallow to end about the 0.236 Fibonacci ratio of micro wave 3 at 1,082. If micro wave 4 is an expanded flat (or combination or running triangle), then within it sub micro wave (B) may make a new high above the start of sub micro wave (A) at 1,088.94. Sub micro wave (B) must reach up to a minimum 0.9 length of sub micro wave (A) at 1,088.29 for a flat correction to be valid. It has not quite managed to do that yet, so markets may open next week with at least a small amount of upwards movement before continuing sideways to complete micro wave 4.
The channel drawn about subminuette wave c is a best fit. Use the lower edge for support. If price touches it, that may be the end of micro wave 4.
At 1,104 subminuette wave c would reach 2.618 the length of subminuette wave a. This is also the 0.382 Fibonacci ratio of minuette wave (i) and so this target has a good probability.
Micro wave 4 may not move into micro wave 1 price territory below 1,065.54. If downwards movement breaches this invalidation point, then the alternate below should be considered.
ALTERNATE HOURLY WAVE COUNT
Click chart to enlarge.
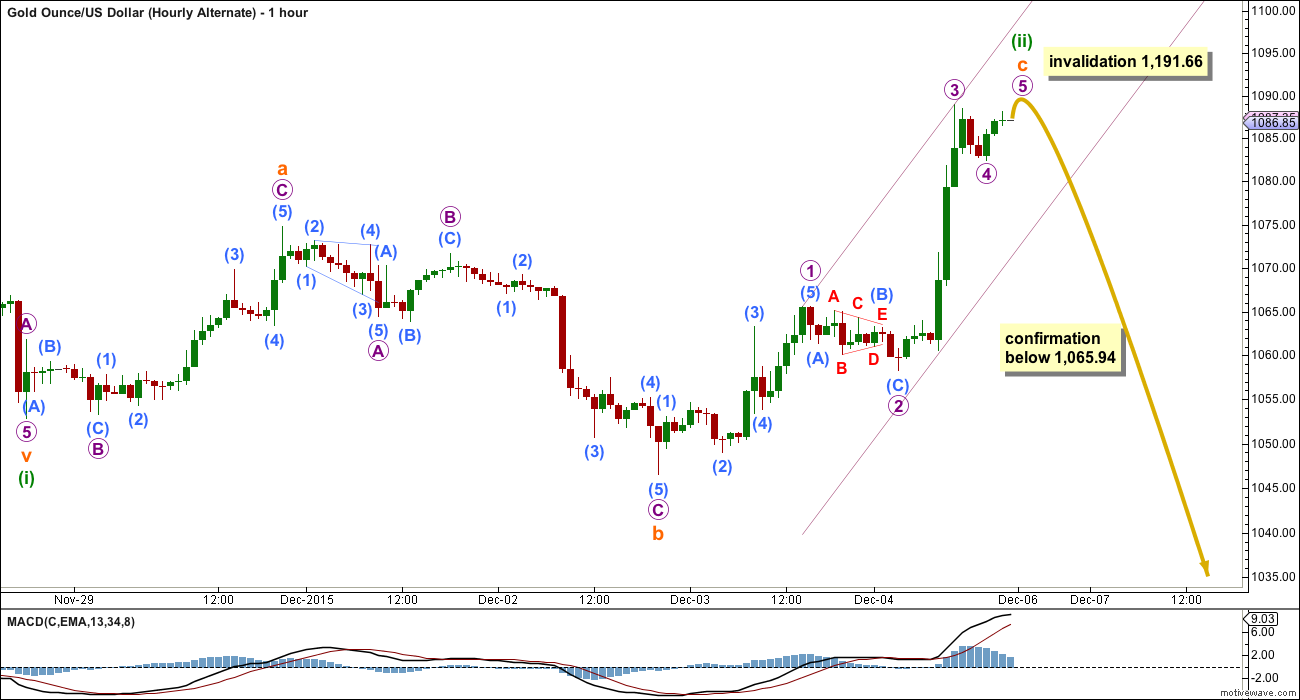
A possible combination looks to be very unlikely at this stage. Combinations move sideways, but so far this correction has a slope. It’s an expanded flat. The questions are: when is it over? And when the structure is complete, is that minuette wave (ii) in its entirety or just the first of a double flat correction?
If price breaks below 1,065.94 on Monday, then the probability of minuette wave (ii) being over must be seriously considered. The next wave down should be a strong third wave at four degrees. There may now be enough of a strong downwards pull to force this second wave correction to be more brief and shallow than otherwise. There is little support from regular technical analysis for this idea though, so it has a low probability.
If micro wave 4 is over as labelled, then both micro waves 2 and 4 are zigzags and there is little alternation between them. This also reduces the probability of this idea.
Micro wave 5 may make a slight new high above the end of micro wave 3 to avoid a truncation. Once that is done, then it is possible that the whole correction for minuette wave (ii) could be over.
A new low below 1,065.94 could not be a fourth wave correction within the impulse unfolding upwards, so at that stage the impulse must be over. At that stage, there would be two possibilities to consider.
1. Minuette wave (ii) is over as per this alternate.
2. Minuette wave (ii) is not quite halfway complete. It may continue sideways as a double flat and this expanded flat is just the first in the double. A three in the opposite direction for an X wave may unfold.
If this wave count is confirmed with a new low below 1,065.94 on Monday, then for confidence it would absolutely require a five down to be clear on the hourly chart.
ALTERNATE ELLIOTT WAVE COUNT
Click chart to enlarge.
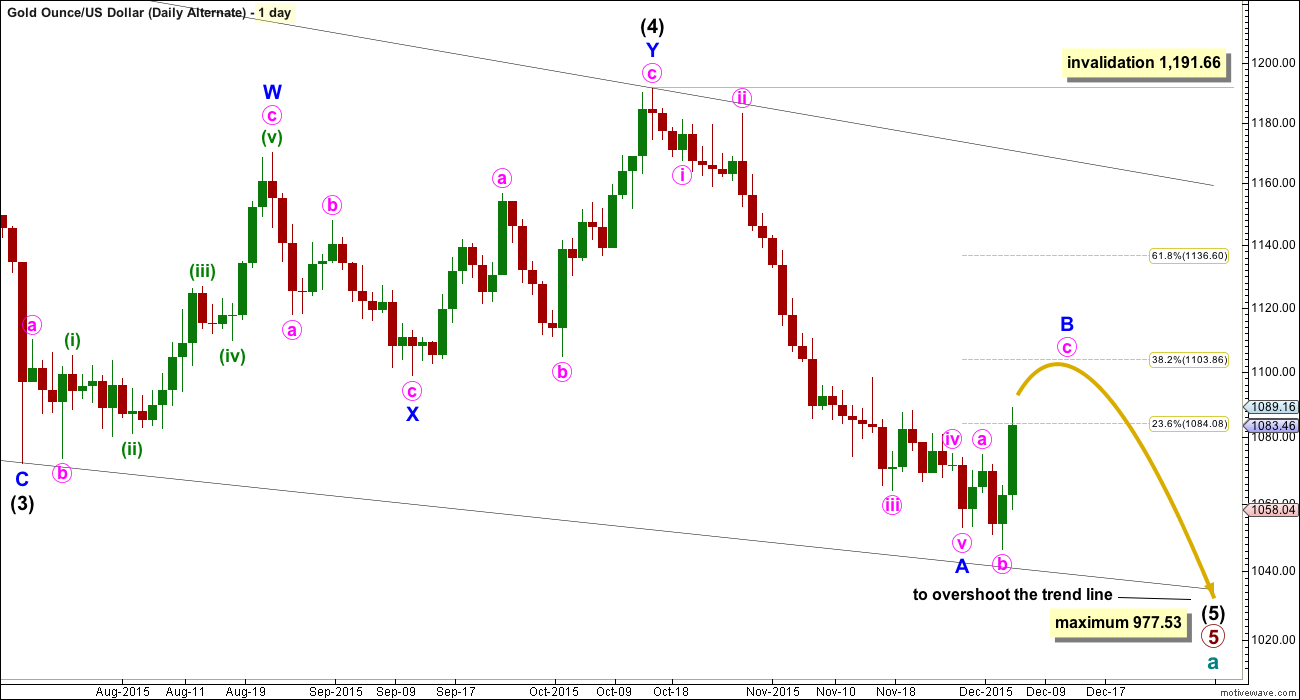
I am aware that this is the wave count which EWI and Danerics have. The implications are important, so I will follow this wave count daily for members here too.
Everything is the same up to the end of the triangle for primary wave 4. Thereafter, primary wave 5 is seen as an ending contracting diagonal.
Within the ending contracting diagonal, it is not possible to see intermediate wave (2) as a zigzag and meet all Elliott wave rules. To see an explanation of why see this video at 10:25.
The same problem exists for the ending diagonal of primary wave 5 itself. Intermediate wave (3) is longer than intermediate wave (1) which would suggest an expanding diagonal, but intermediate wave (4) is shorter than intermediate wave (2) and the trend lines converge which suggests a contracting diagonal.
From “Elliott Wave Principle” by Frost and Prechter, 10th edition, page 88: “In the contracting variety, wave 3 is always shorter than wave 1, wave 4 is always shorter than wave 2, and wave 5 is always shorter than wave 3. In the expanding variety, wave 3 is always longer than wave 1, wave 4 is always longer than wave 2, and wave 5 is always longer than wave 3.”
This structure violates the rules for both a contracting and expanding variety. If the rules in Frost and Prechter are accepted, then this is an invalid wave count.
It may be that the rules need to be rewritten to add “sometimes a third wave may be the longest within a contracting or expanding diagonal”. But I have never seen Robert Prechter publish such a rule, I do not know that it exists.
I cannot reconcile this wave count from EWI with the rules in Frost and Prechter.
If an ending contracting diagonal is unfolding, then the (1) – (3) trend line may be overshot signalling the end of intermediate wave (5). If price behaves thus and turns around and moves strongly higher, then this wave count must be accepted and the rules for diagonals will need to be rewritten.
I will continue to follow this possibility as price moves lower.
Intermediate wave (5) should be shorter than intermediate wave (1). At 977.53 intermediate wave (5) would reach equality in length with intermediate wave (1). A new low below this point would take this possible diagonal structure too far from the rules. At that stage, it really should be finally discarded.
All sub waves within ending diagonals must subdivide as zigzags. Within the zigzag of intermediate wave (5), minor wave B should unfold over several days. At this stage, there is no divergence between this idea and the main Elliott wave count.
Minor wave B may not move beyond the start of minor wave A above 1,191.66.
I am uncomfortable with publishing this wave count and I only do so because it has been published by Elliott Wave International. I am not comfortable with publishing any wave count which violates the rules in Frost and Prechter. However, when looking at primary wave 5 on the weekly chart it does look like a diagonal is unfolding.
Short to mid term there is no divergence in expected direction between this wave count and the main wave count.
TECHNICAL ANALYSIS
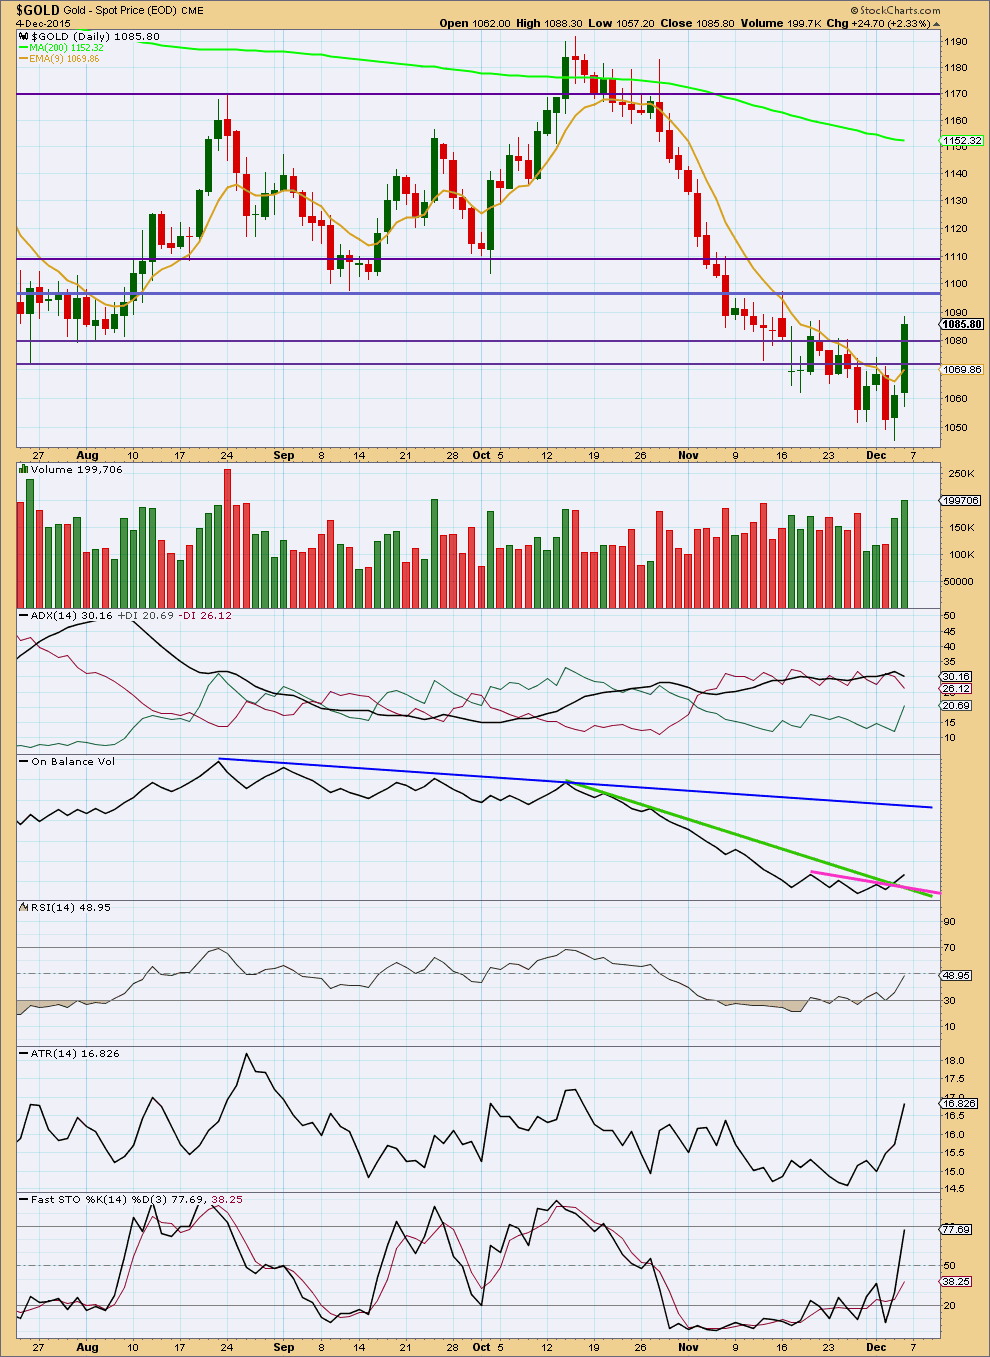
Click chart to enlarge. Chart courtesy of StockCharts.com.
A strong upwards day with a strong increase in volume supports the upwards movement in price. This supports the idea that price should continue higher next week. Friday’s volume was the strongest since the downwards day of 24th August.
On Balance Volume is bullish now that it has broken above both its short held trend lines. The next line of resistance for OBV is the new dark blue line which is a reasonable distance away.
There is a zone of resistance about 1,097 – 1,104 where price previously found support. This supports the target for the Elliott wave count at 1,104.
ADX is declining and no longer indicates a downwards trend is in place. ATR is strongly increasing. Together these two lagging indicators may be beginning to indicate a new upwards trend. If ADX turns upwards and the green +DX line crosses above the red -DX line, then an upwards trend would be indicated. For now a correction against the trend should be expected until proven otherwise.
This analysis is published about 11:58 p.m. EST.
Conclusion: the structure of this correction is unclear. It may be a flat or a double combination or a double flat.
What is most likely is that it is not over yet.
Main hourly wave count:
Downwards movement is micro wave 4. Fourth waves aren’t always nicely contained within the first drawn channel, that’s why Elliott developed a second technique to use when the fourth wave breaches the channel.
I am concerned at the lack of alternation in structure between micro waves 2 and 4 here. They’re both zigzags with a triangle for the B wave. There is alternation in depth though. And alternation is a guideline not a rule, it should be applied with flexibility. But the lack of it does reduce the probability of this idea, so the second idea must be seriously considered.
Target is the same at 1,104.
Second likely scenario:
Minuette (ii) is continuing sideways as a double flat or double combination.
Subminuette x downwards is an incomplete three wave structure.
When it is done then more sideways movement for a second structure which may be a zigzag, flat or triangle, to last a few days.
This is entirely valid. It needs to be seriously considered. If volume for today is light then downwards movement would not be supported, that would support this wave count which sees downwards movement as a correction within a correction.
If volume today is heavy then the least likely scenario posted below would be supported.
Least likely scenario which may be unfolding:
Minuette (ii) is over. Minuette (iii) down has begun.
This idea absolutely needs to be confirmed with a new low below 1,065.94 AND a clear five down, not a three.
I think that the low of today at 1,073.90 at 10:10 am EST may have been the end of Micro wave 4 down. Then maybe sub micro wave 1 up ended at 1,077.85 at 1:09 pm. Sub micro wave 2 may end just above 1073.90 maybe at a few minutes. Then sub micro wave 3 moves up higher above 1,077.85. Unless gold moves below 1,065.54 then minuette wave (ii) is over.
GDX should be ready to move up. Chart by Mark.
LARA, Do you believe we have more upside to appox. 1104
Most likely.
The situation is really unclear for the short term.
I’ll have three hourly charts for everyone to consider today. Will post each above.
The lower edge of the hourly channel was at about 1,084 and gold has already dropped to 1,073.90 at 10:10 am. So that support didn’t hold.
“The hourly channel drawn about subminuette wave c is a best fit. Use the lower edge for support. If price touches it, that may be the end of micro wave 4.”
In which case we have completed (ii) and are looking for 5 wave impulse type waves to signal the beginning of (iii) down?
Lara:”Micro wave 4 may not move into micro wave 1 price territory below 1,065.54.”
Once gold moves above the channel gold will be in micro wave 5 up. Target may be 1104????
Wave ii is not complete yet.
I agree. More up is coming.
Huge Rambus post on darn near everything: Dow, USD, Oil, and Gold…
http://rambus1.com/2015/12/06/weekend-report-78/
Stick to Lara’s EWSM reports. SM is on the move to down.
All One Market globally.
Trader Dan Norcini post on Gold and COT.
http://traderdan.com/?p=8292
“IN closing this short set of comments, I bring you back to a chart posted earlier this week detailing the falling open interest in the gold futures market, something which in my opinion is reflective of the decline of interest in gold by Western-based investors. “
Dan on Gold ADX:
“In looking at the ADX/DMI indicator, note that the ADX has turned lower, indicating a HALT in the ongoing downtrend. Remember, it was just earlier this week when the market looked as if it was getting ready to start a fresh leg lower as downside momentum was picking up. That was of course before the gold longs were rescued by Draghi and company. Now, the trend has been halted for the time being and as you can see, Negative Directional Movement ( -DMI) is receding and Positive Directional Movement ( +DMI) is rising.
There has not of yet been generated a clear “buy” signal but the downturn in both the ADX and the -DMI is enough that most shorts should be covered ( unless one is holding hedges against physical gold in possession). “
Good Afternoon Everyone,
Attached is my COT analysis. Based on the data behind this, I don’t plan to take a long position for 2 to 3 more weeks. Basically what is happening in the background is that there are very big positive divergent weeks coming up – 4 of them – that will drop off and be replaced by a current week. So think about it like this – the next 4 weeks have the following positive numbers drop off – 29K, 16K, 48K, and 61K. These 4 weeks out of the current 10 are holding the blue line UP (even though it is pointing down). So if you drop off a positive 29K, then the divergence between Swap and MM needs to be MORE than that in order to have the blue line turn up. The positive divergence happens when the Swaps get more net short and the MMs get more net long. So, based on the 4 upcoming weeks, I am guessing we are 3 days into a rally that might last up to 7 more trading days. Then when we hit the 48K and 61K weeks, the blue line is going to fall and trough. That is the way I see this playing out. It fits well with tax loss selling season, it fits well with the last 4 or 5 years of gold price trends going into Christmas. Now, I am not saying we will get a lower low….we may or may not. I am using this analysis to notice when I think the swaps and MMs are going to start building positions against each other in the opposite direction.
Chart attached. For what it’s worth, I haven’t had a gold trade for about 5 weeks. I am patiently waiting to follow this blue line trough. If it does trough when I expect it too, I will be long some OTM GDX and GLD options that go out about 3 or 4 months. IF it has troughed already…well, I will likely wait 3 months for the next peak.
Also note, the last 4 troughs came at 10, 11, 7, and 8 weeks from the peak. We are currently at 6 weeks, so it feels early yet for a longer rally.
This all jives with the counts Lara is presenting, we are either going to trough and be in a new trend in the alternate count, or we are going to be in a 80-120 point correction after the next decent third wave down.
Have a great weekend.
I’d like to underscore your analysis by simply pointing to the GOLD/XAU ratio and how elevated it is. Basically, it says either gold stocks move up be 2x very quickly, or gold falls by half. Its probably somewhere in the middle, but a washout low in gold could very well happen in the next 4-5 weeks.
Below is analysis of recent COT data for gold.
—————————————————–
Current net short by commercial is at 7050 vs. 170000+ .
Gold COT Data Again Proclaiming a Price Bottom
“Back in June 2013, when gold was making its lowest price low since early 2011, I pointed out that commercial gold futures traders were at a really low net short position according to the Commitment of Traders data, and that this was a meaningful sign of a price bottom. Now we are seeing a similar condition in the commercial traders’ net position, which is conveying a similar message.”
Read more……….
http://www.321gold.com/editorials/mcclellan/mcclellan120913.html
Lara: Looking at Gold’s stockchart chart last two times gold crossed 9ema with high volume and green candle, price of gold continued much higher.
9ema cross on:
Aug 10 from 1100 to top @ 1169.91.
Oct 1 from 1130 to top @ 1191.91.
This Friday again gold crossed above 9ema with heavy volume. A $60 dollar rise may be in the cards??????
Magic carpet of 9ema is that it will be a strong support till gold closes below.
Any Comments????
Hi Papudi, I think you could be right. I usually watch the 9ema on the monthly chart for confirmation. the monthly comes in at 1101 which lines up close to Lara’s target. if broken 1140 look more likely, and more typical coming of a new low with a strong green candlestick.
I think this strong red candlestick is the answer.
And that’s the problem with technical analysis. Just because the market behaved in a certain way before does not mean it should behave the same way again. It’s an exercise in probability.
Yet another super bullish gold COT report!!!
Only watching large commercial shorts. Current report commercial shorts dropped by 6370 to lowest level to 225,105 and net shorts dropped to 7050.
At top of gold at 1160 commercial net shorts were 170,000+ and gold came down to 1057.
Target for it to end may be between 1104 to 1120 like Lara says in the video.
Waiting to see MTSLD COT report on 10 week basis.
TA report Lara: “The next line of resistance for OBV is the new dark blue line which is a reasonable distance away.”
There can be another resistance line drawn underneath of OBV lows.
Great report as usual.
Lengthy, 16 minute video by Gary Savage if interested. Gives his thoughts on why this may be the bottom, bullish divergence between miners and gold, etc.
http://blog.smartmoneytrackerpremium.com/2015/12/dec-5-weekend-commentary.html#comments
Hello Lara,
For me it looks like GOLD is completing a triangle of the 4th wave and upwards movement will end somewhere at 1092. What do you think?