
Upwards movement was expected but did not happen.
Price remains above the invalidation point on the hourly chart.
Summary: The structure of this correction is unclear. But what looks most likely is that it is not over and may end in two more days at 1,104. Or it may continue sideways in very choppy overlapping movement for a further seven days.
New updates to this analysis are in bold.
To see weekly charts and the difference between the two wave counts go here.
MAIN ELLIOTT WAVE COUNT
Click chart to enlarge.
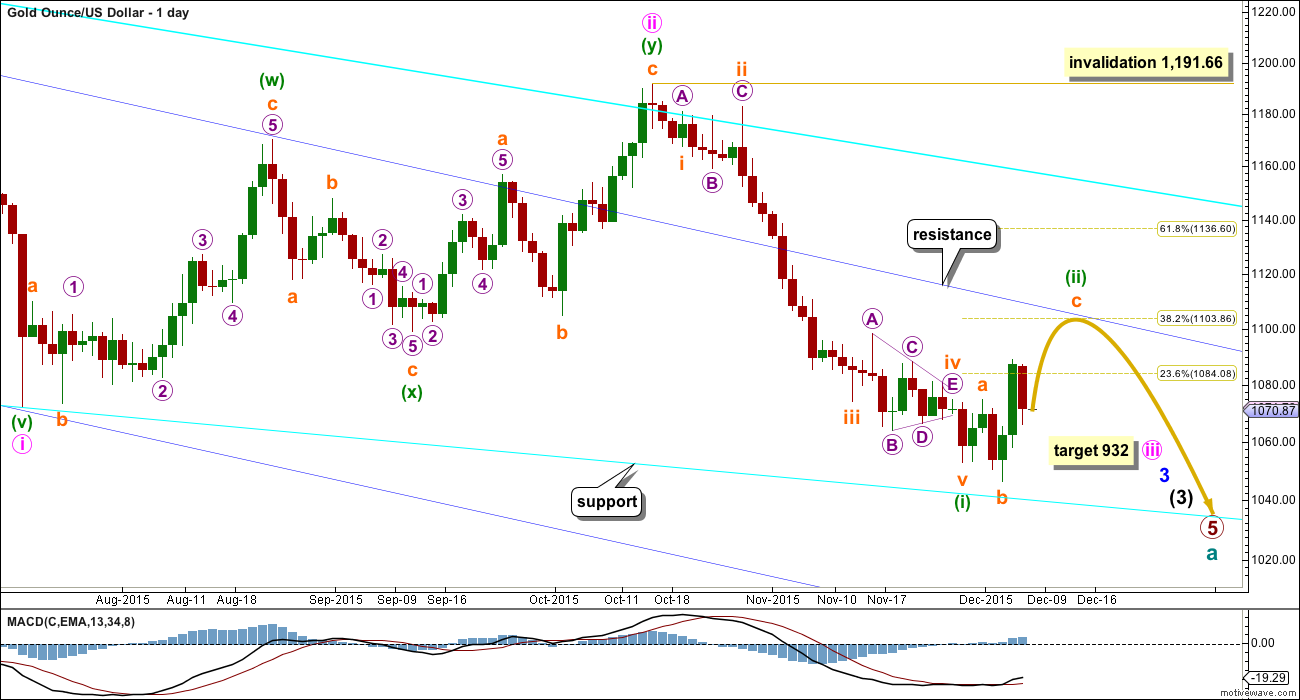
Gold has been in a bear market since September 2011. There has not yet been confirmation of a change from bear to bull, and so at this stage any bull wave count would be trying to pick a low which is not advised. Price remains below the 200 day moving average and below the cyan trend line (copied over from the weekly chart). The bear market should be expected to be intact until we have technical confirmation of a big trend change.
The final line of resistance (cyan line copied over from weekly charts) is only overshot and not so far properly breached. While this line is not breached the bear wave count will remain possible. Simple is best, and the simplest method to confirm a trend change is a trend line.
Minute wave ii is a complete double zigzag and deep at 0.75 the length of minute wave i. It has breached the dark blue base channel drawn about minor waves 1 and 2, one degree higher. When a lower degree second wave correction does this it reduces the probability of the wave count but does not invalidate it. Base channels most often work to show where following corrections find support or resistance, but not always.
At 932 minute wave iii would reach 1.618 the length of minute wave i.
Minuette wave (i) is complete.
Minuette wave (ii) may find resistance at the upper dark blue trend line. This may see it end about the 0.382 Fibonacci ratio of minuette wave (i) at 1,104.
Minuette wave (i) lasted 31 days, three short of a Fibonacci 34. It looks like minuette wave (ii) may be more brief and shallow than second wave corrections normally are, at this stage, due to the strong downwards pull from the middle of a third wave. So far it has lasted six days. If it continues now for a further two days, it may total a Fibonacci eight; give or take one either side of this number would produce an acceptable Fibonacci relationship.
If minuette wave (ii) unfolds as a double combination or double flat as per the first hourly alternate wave count below, then it may continue in sideways choppy overlapping movement for a further seven days to total a Fibonacci thirteen.
MAIN HOURLY WAVE COUNT
Click chart to enlarge.
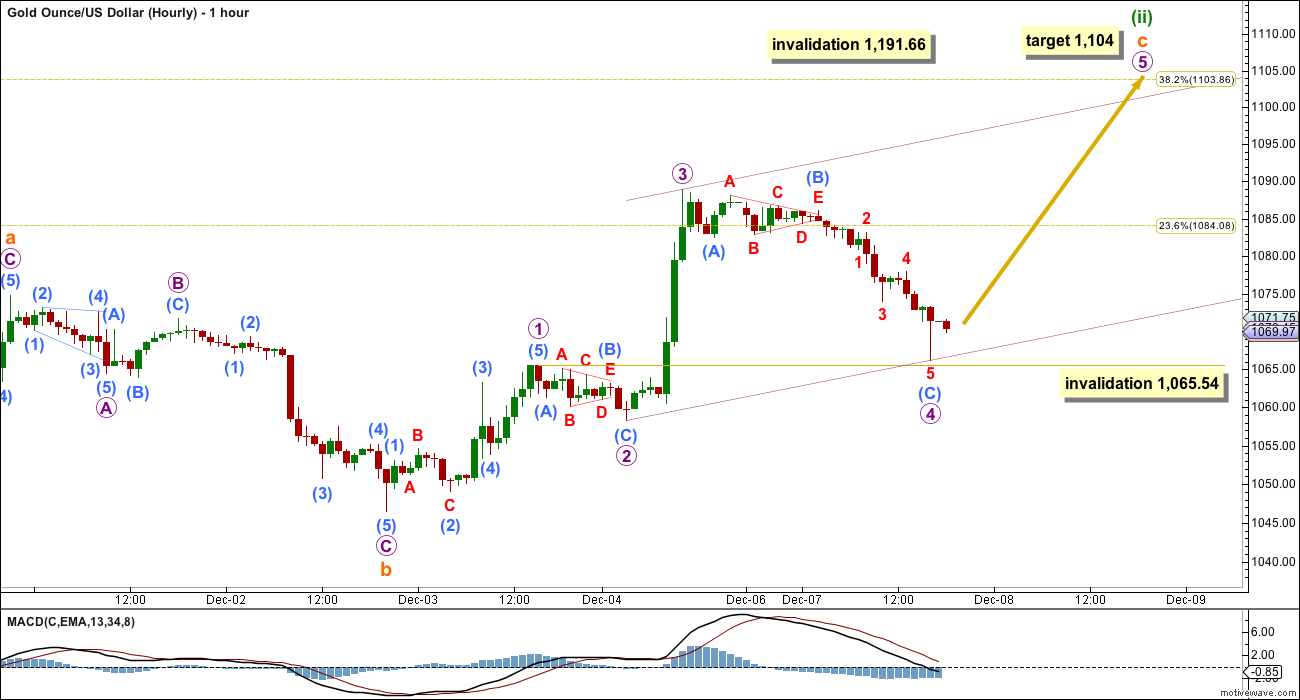
This wave count remains valid while price remains above 1,065.54, but subminuette wave c no longer has a typical look at the daily chart level. Within subminuette wave c, micro wave 2 was much more brief than micro wave 4. Micro wave 4 shows up clearly on the daily chart, but micro wave 2 does not. This would give subminuette wave c a three wave look at the daily chart level.
There is inadequate alternation now between micro waves 2 and 4. Micro wave 2 is a shallow 0.38 zigzag. Micro wave 4 is a much more deep 0.74 zigzag. They are the same structure, but there is good alternation in depth. Alternation is a guideline, not a rule, and should be applied flexibly. Alternation in structure is most common but not always seen. The lack of alternation in structure reduces the probability of this wave count and is the biggest reason why the first alternate below must be seriously considered.
The target remains the same. At 1,104 subminuette wave c would reach 2.618 the length of subminuette wave a. This is also the 0.382 Fibonacci ratio of minuette wave (i).
Minuette wave (ii) may not move beyond the start of minuette wave (i) above 1,191.66.
Micro wave 4 may not move into micro wave 1 price territory below 1,065.54. If this first hourly wave count is invalidated, then the first alternate below should be used.
At the time of preparing this chart, the red hammer candlestick pattern at the end of micro wave 4 indicates downwards movement has most likely ended there today.
FIRST ALTERNATE HOURLY WAVE COUNT
Click chart to enlarge.
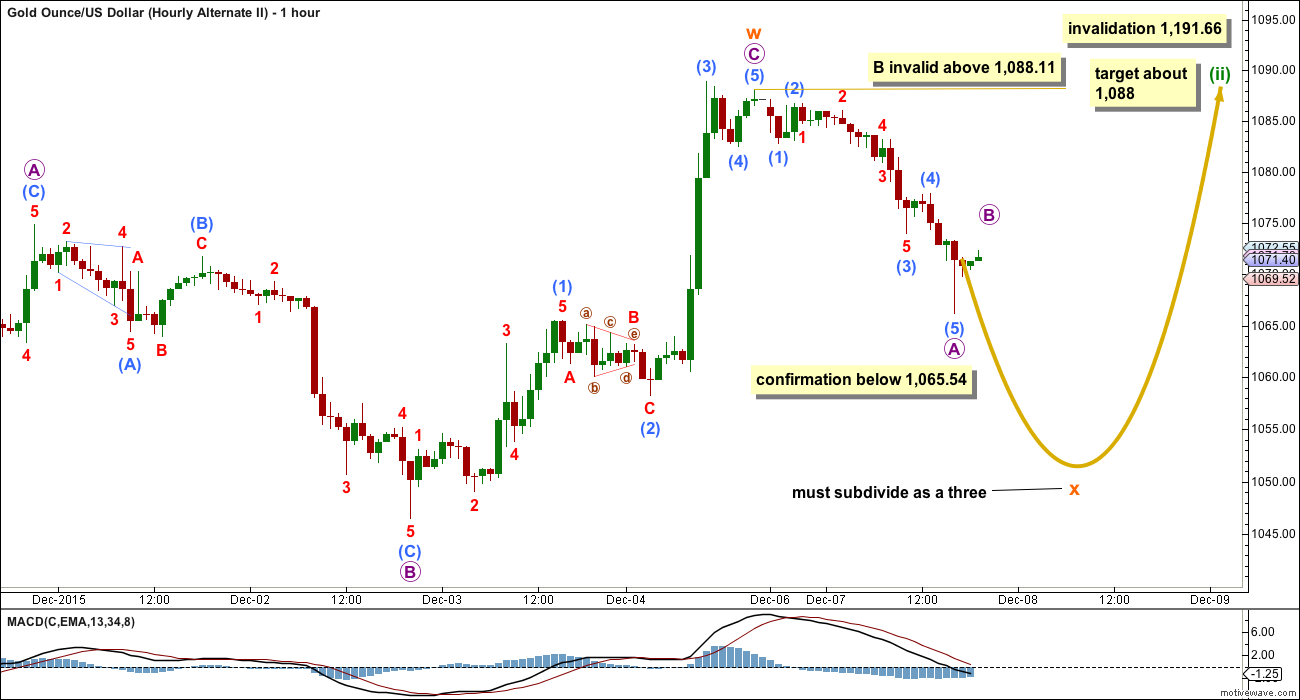
This idea is looking more likely, with Monday’s strong downwards movement, but it remains unconfirmed.
An expanded flat correction may have been over with a slightly truncated fifth wave within micro wave C, labelled subminuette wave w.
This may have been the first flat correction within a longer lasting double flat or double combination for minuette wave (ii).
The second structure for a double combination may be a zigzag or a triangle. For a double flat, the second structure may be another flat. Double combinations and double flats have the same purpose: to take up time and move price sideways. To achieve this purpose the second structure in the double normally ends about the same level as the first, so subminuette wave y may be expected to end about 1,088.
Within doubles, the two structures are joined by a correction in the opposite direction labelled X. This may be any corrective structure. It may make a new low below the start of the first corrective structure, so there is no lower invalidation point for this wave count for that reason.
Subminuette wave x looks like it may be unfolding as a simple zigzag and that is the most common structure for X waves. Within subminuette wave x, micro wave B may not move beyond the start of micro wave A above 1,088.11.
When subminuette wave x is complete, then choppy overlapping sideways movement for a second corrective structure would unfold over a few days. If this continues now for a further seven days, then minuette wave (ii) may last a total Fibonacci thirteen days.
SECOND ALTERNATE HOURLY WAVE COUNT
Click chart to enlarge.
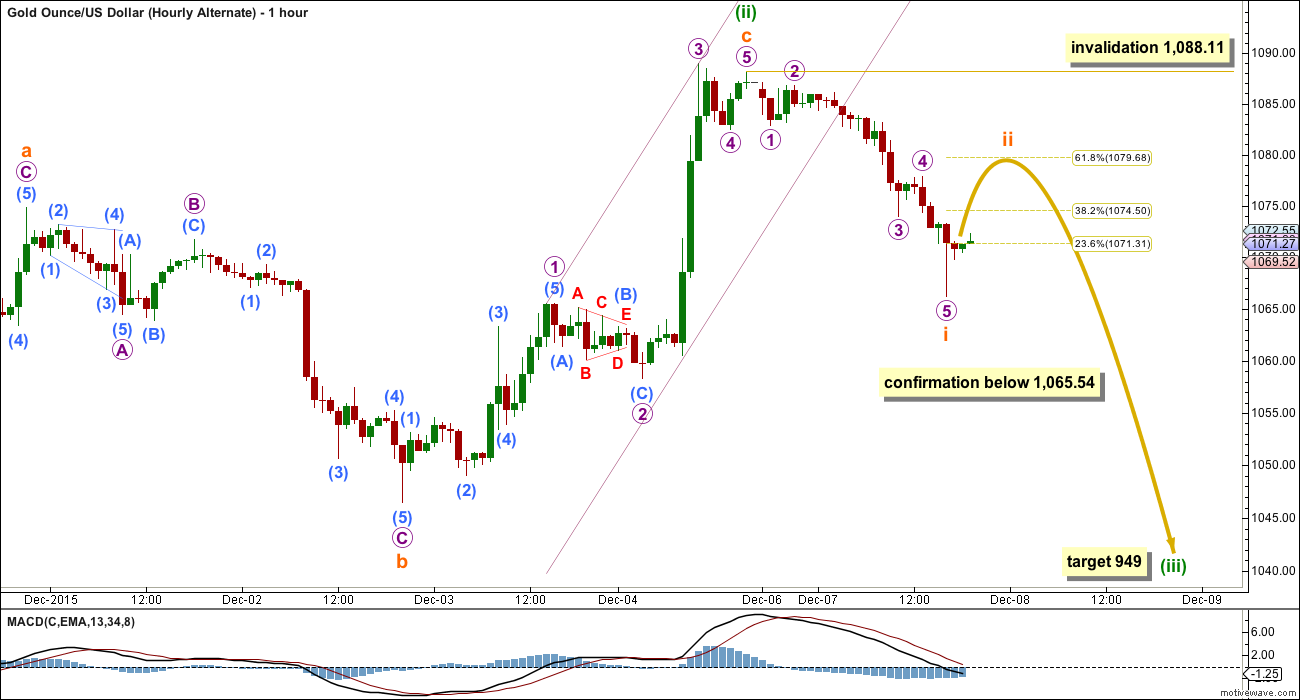
It is possible that minuette wave (ii) is over as a complete expanded flat. The subdivisions are all complete. This would be a very quick and shallow second wave correction, but the possibility must be considered.
If the main wave count is correct (as opposed to the alternate daily wave count below), then there should be a strong downwards pull from the middle of a big third wave at this stage. Surprises to the downside may turn up.
In the short term, all wave counts expect some upwards movement. A new high above 1,088.11 would invalidate this idea because subminuette wave ii may not move beyond the start of subminuette wave i. How high this next wave goes may begin to clarify the picture.
For this wave count, a second wave correction may end about the 0.618 Fibonacci ratio at 1,080. Thereafter, a third wave down is expected. The following correction for a fourth wave may not move back into first wave price territory. The structure of downwards movement should indicate which of the two alternate wave counts is correct.
ALTERNATE ELLIOTT WAVE COUNT
Click chart to enlarge.
I am aware that this is the wave count which EWI and Danerics have. The implications are important, so I will follow this wave count daily for members here too.
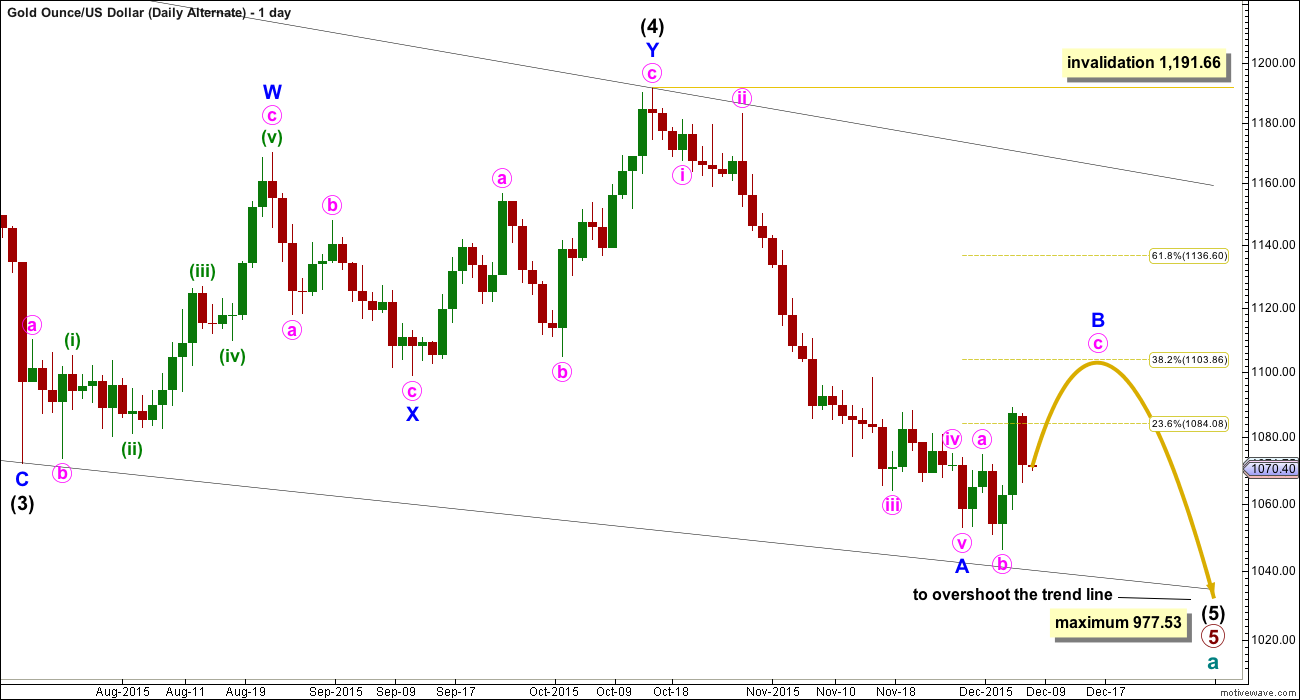
Everything is the same up to the end of the triangle for primary wave 4. Thereafter, primary wave 5 is seen as an ending contracting diagonal.
Within the ending contracting diagonal, it is not possible to see intermediate wave (2) as a zigzag and meet all Elliott wave rules. To see an explanation of why see this video at 10:25.
The same problem exists for the ending diagonal of primary wave 5 itself. Intermediate wave (3) is longer than intermediate wave (1) which would suggest an expanding diagonal, but intermediate wave (4) is shorter than intermediate wave (2) and the trend lines converge which suggests a contracting diagonal.
From “Elliott Wave Principle” by Frost and Prechter, 10th edition, page 88: “In the contracting variety, wave 3 is always shorter than wave 1, wave 4 is always shorter than wave 2, and wave 5 is always shorter than wave 3. In the expanding variety, wave 3 is always longer than wave 1, wave 4 is always longer than wave 2, and wave 5 is always longer than wave 3.”
This structure violates the rules for both a contracting and expanding variety. If the rules in Frost and Prechter are accepted, then this is an invalid wave count.
It may be that the rules need to be rewritten to add “sometimes a third wave may be the longest within a contracting or expanding diagonal”. But I have never seen Robert Prechter publish such a rule, I do not know that it exists.
I cannot reconcile this wave count from EWI with the rules in Frost and Prechter.
If an ending contracting diagonal is unfolding, then the (1) – (3) trend line may be overshot signalling the end of intermediate wave (5). If price behaves thus and turns around and moves strongly higher, then this wave count must be accepted and the rules for diagonals will need to be rewritten.
I will continue to follow this possibility as price moves lower.
Intermediate wave (5) should be shorter than intermediate wave (1). At 977.53 intermediate wave (5) would reach equality in length with intermediate wave (1). A new low below this point would take this possible diagonal structure too far from the rules. At that stage, it really should be finally discarded.
All sub waves within ending diagonals must subdivide as zigzags. Within the zigzag of intermediate wave (5), minor wave B should unfold over several days. At this stage, there is no divergence between this idea and the main Elliott wave count.
Minor wave B may not move beyond the start of minor wave A above 1,191.66.
I am uncomfortable with publishing this wave count and I only do so because it has been published by Elliott Wave International. I am not comfortable with publishing any wave count which violates the rules in Frost and Prechter. However, when looking at primary wave 5 on the weekly chart it does look like a diagonal is unfolding.
Short to mid term there is no divergence in expected direction between this wave count and the main wave count.
TECHNICAL ANALYSIS
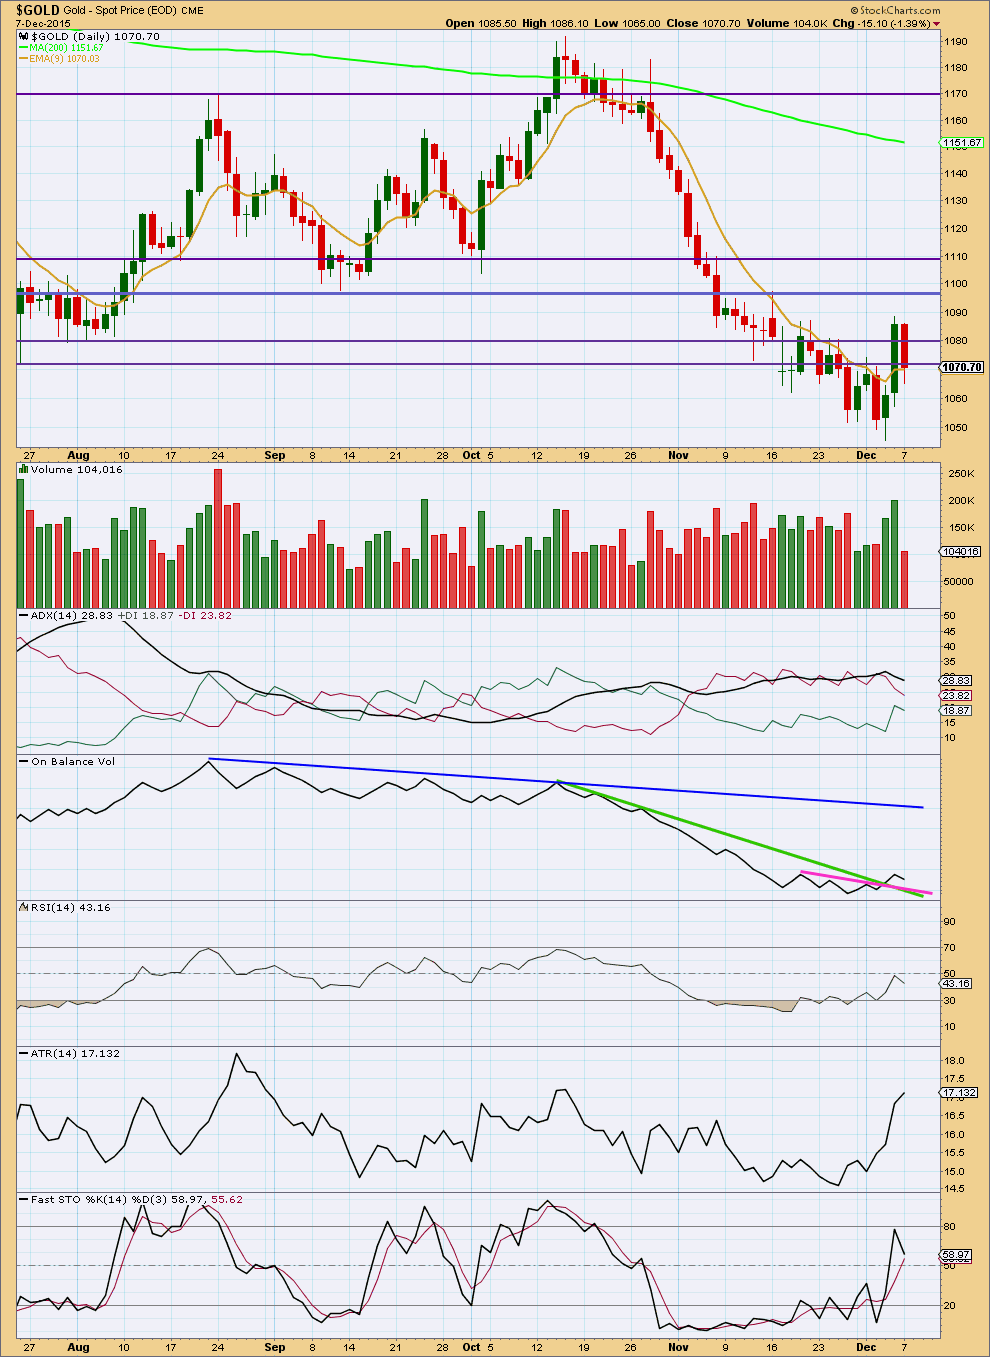
Click chart to enlarge. Chart courtesy of StockCharts.com.
Volume for Monday’s downwards day is light. The fall in price was not supported by volume. This favours the main and first alternate hourly wave counts which see this fall in price as part of a correction.
ADX currently indicates no clear trend. The downwards trend is interrupted by a correction. Price is whipsawing sideways, typical behaviour for a correction. This supports the first two hourly wave counts and the daily wave count which sees a second wave correction currently unfolding.
This correction is resolving RSI and Stochastics being oversold. They have both returned to neutral.
The only piece of technical analysis which does not currently fit is ATR. It is increasing, when normally during a correction it would be expected to decrease.
This analysis is published about 07:06 p.m. EST.
Has anybody here heard about Martin Armstrongs forecast about gold for 2016? I know as probably most of you that he predicts a rally. I truly believe in EW principle and daily follow Lara’s analysizes and adds some of mine. I’m very curious about what he said about gold on World Economic Conference. It would be great to combine EW with his predictions!
The main hourly wave count is changed to see a diagonal unfolding upwards, and now to see the second wave complete and a third wave up unfolding.
And so this will diverge now from the other two wave counts.
To see the second wave continuing lower would ignore a B wave triangle which should be complete within it. I want to leave the triangle there for that wave count, it has such a neat fit.
And so with that change the three hourly wave counts are no longer all expecting downwards movement. Two of the three are.
You know best Lara, it’s all in your expert hands.
Conclusion: short term all wave counts expect downwards movement for a bit from here. Target 1,057.
If B (or ii) moves higher the target must move correspondingly higher.
Thanks for the clarity on all hourly wave counts target 1,057 and that the Second Alternate the one heading for 949 is not probable.
I bought some DUST until gets near the 1,057 area.
How do you know 1057 will not happen when NY market is closed?
Nobody knows how fast gold will hits targets it is all an estimate or guess and surprises are to the downside. I only bought a little DUST at $16.85 and hoping it hits 1057 during market hours. Anyone holding anything overnight is taking a risk.
Any bullish overnight holds have no way of knowing if the 1088 or 1104 targets will happen overnight or during market hours.
The main hourly wave count will change to see a possible diagonal unfolding upwards.
It would be an ending contracting diagonal most likely.
The subdivisions will all be the same, a 5-3-5 up for the first wave, and now a 5-3-5 down for a second wave.
I’ll be doing this because the upwards movement of this session doesn’t subdivide well at all as the start of micro wave 5. And because this would also resolve the problem I have with micro 4 showing up on the daily chart while micro 2 does not.
The two alternates will remain the same. The first more likely sees a zigzag unfolding downwards with A and B now complete. C will = A at 1,057. It may make a new low.
The second alternate sees subminuette i and now ii complete. I’m so reluctant to provide a target for that one…. the probability is not good at all and I fear that providing a target would lend a false sense of confidence to that wave count.
Which hourly wave count are we most likely in now?
Any wave count?
I am still concerned that 2 of the hourly wave counts may still go below 1,065.54 and only one will then move back up to 1088.
The Hourly alternate target was 1079.68 then down to 949 and gold hit 1079.25 and had dropped to 1071.34 and may still drop below 1065.54.
Lara: ” The lack of alternation in structure reduces the probability of this wave count and is the biggest reason why the first alternate below must be seriously considered.
The target remains the same. At 1,104 subminuette wave c would reach 2.618 the length of subminuette wave a. ”
In first alternate target for wave ii is 1079 and chart show wave iii down. Yet Lara above mentions target for wave ii remain same.
I am confused from the first alt chart. Any one??????
I asked about it yesterday. See reply below. I don’t believe there is a hard target for the B wave of X.
You’re right. No target for wave B or X could be calculated yesterday because if it’s a zigzag then within it I can only use the ratio of the A and C waves within it to calculate a target.
Now I can see it may have waves A and B complete I can calculate a target for it to end. The target is 1,057 where C = A
So far I think that the main count is in play with a leading diagonal up for submicro 1 of micro 5 and now we are in a deep retrace for submicro 2 that may end around 1,067. If this is correct, we may then start a strong rally up toward the 1,100 range. This looks to be supported by a bearish rising wedge in the USD.
Good video update. Also, what to expect for USD when the Fed raises rates.
http://thedailygold.com/precious-metals-video-market-update-15/
I think shorts to be covered in crude for time being…i can see a double bottom formation in chartss here..
Great analysis laraa…
Im waiting for the day when lara will start her service of giving entry,exit points and daily trading calls…I will surely subscribe.. 🙂 ..
After I have CMT I’ll be applying to be a registered financial advisor in New Zealand.
Once that’s done then I can legally do this.
For now I cannot.
Latest from Martin Armstrong indicates a low for gold this week then a correction up into possibly January before move to final low at minimum 930.
I get warm fuzzy feelings when Lara’s and Armstrong’s analysis agree.
Lara: the first hourly alternate seems most realistic to me. However, I was not totally clear on what you meant with your comment about X completing as a simple zigzag. Does that mean that it may be forming an ABC down? In other words, gold may have completed an A wave down and could now go up to perhaps 1080ish for a B wave, and then back down to finish a C wave? I realize that gold could spin off in any which direction, and get more complex, but just wanted some clarification on this one possibility and if that formation is what you were referring to. Thanks.
Matt, I believe that is exactly what she means. Therefore, much above 1080 and the first hourly looks more likely. Below 1080 and the two alternates are very much in play.
Thx
Yes. Exactly.
Either of these counts works for me, I’m expecting down into year end after this correction. Upside seems limited.
I believe that the correction may be more time consuming. I’m thinking that the low is in for Dec and that gold may grind up over the next couple months. Then the final drop comes sometime during the first half of 2016.
COT is very compelling at this time, as you point out. However, the pendulum has swayed so far in one direction that it may take several weeks to work itself out.
Matt, I tend to agree, see my comment on Martin Armstrong above. Don’t know what your analytical approach is but you seem to have a handle on gold.
If Matt, Lara and Martin agree–I take that wave!
Thanks. In addition to learning from Lara, I also like to look for repetitive time patterns. It’s just speculation really, but late January or February is my estimate for a possible peak. I am also still looking at an 1130 target, but will play this by ear.
Lara thanks a lot for the helpful comments and charts before the market close today.
You’re welcome