
Choppy overlapping movement was expected for the week. This is exactly what happened.
Summary: The correction should complete with some upwards movement to a target at 14.695 – 14.855. This may be met in another two days, if the correction lasts a total Fibonacci twenty one days.
New updates to this analysis are in bold.
Notice: I am using a new data feed. I have switched from using FXCM data feed for the Silver cash market to using a feed via BarChart which comes directly from COMEX for the Silver Spot (cash) market. BarChart data should be more reliable. This new data feed has changed the Silver wave counts slightly.
MAIN WAVE COUNT
Click chart to enlarge.
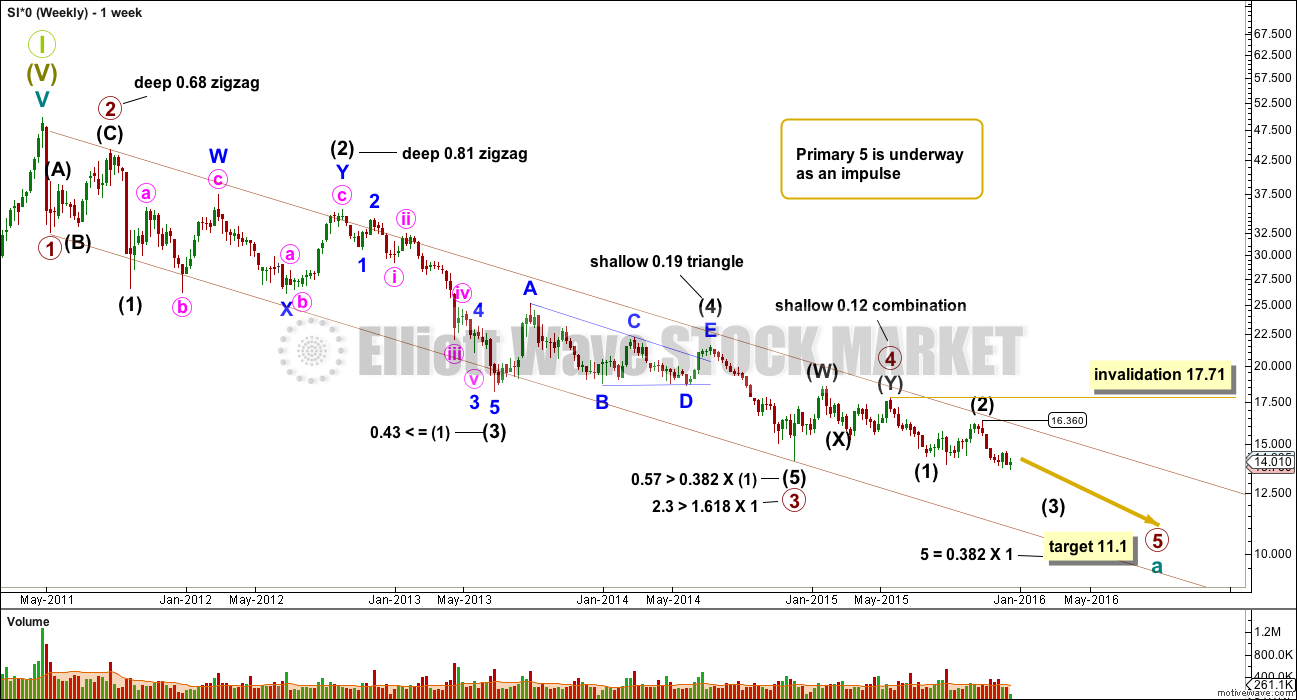
Primary wave 4 may be complete and primary wave 5 may be underway.
Primary waves 2 and 4 exhibit perfect alternation and good proportion: primary wave 2 was a deep zigzag lasting 15 weeks and primary wave 4 was a shallow combination lasting 24 weeks, 1.618 the duration of primary wave 2.
At 11.1 primary wave 5 would reach 0.382 the length of primary wave 1.
This wave count is preferred primarily for the reason that there has been no technical confirmation of a trend change from bear to bull for Silver.
Intermediate wave (2) may not move beyond the start of intermediate wave (1) above 17.779. A breach of this invalidation point would now also require a strong breach of the bear market channel, so this invalidation point should not be moved any higher. When that channel is breached that should indicate a trend change for Silver from bear to bull. At that stage, only bullish wave counts should be seriously considered.
Click chart to enlarge.
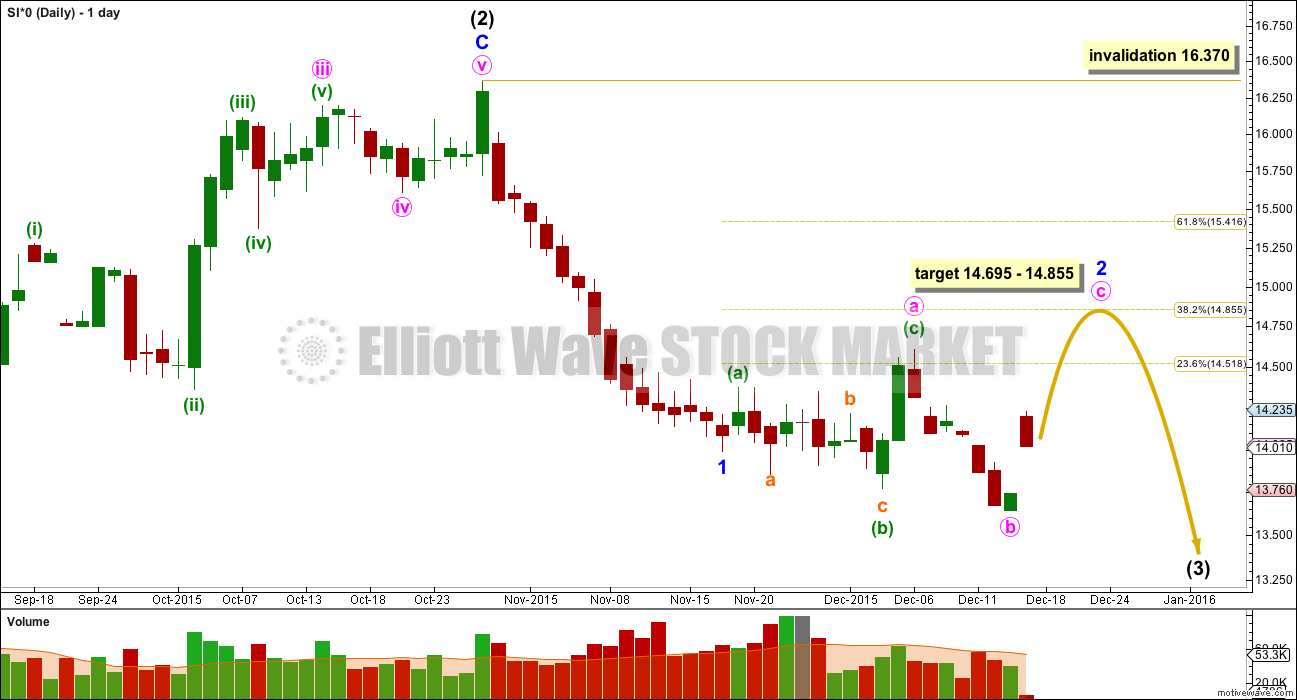
All wave counts at the daily chart level this week will show movement since the high at 16.37 on 28th October.
Minor wave 2 would be a relatively quick and very shallow correction, if it was over at the high labelled minute wave a. Downwards movement labelled minute wave b subdivides as a zigzag on the hourly chart. At this stage, minor wave 2 looks like a fairly typical expanded flat correction. Minute wave b is a 1.54 length of minute wave a, longer than the maximum common length of 1.38 but within the allowable convention of up to 2.
At 14.695 minute wave c would reach 1.618 the length of minute wave a. This is somewhat close to the 0.382 Fibonacci ratio of minor wave 1 at 14.855.
Minor wave 2 may not move beyond the start of minor wave 1 above 16.37.
ALTERNATE WAVE COUNT
Click chart to enlarge.
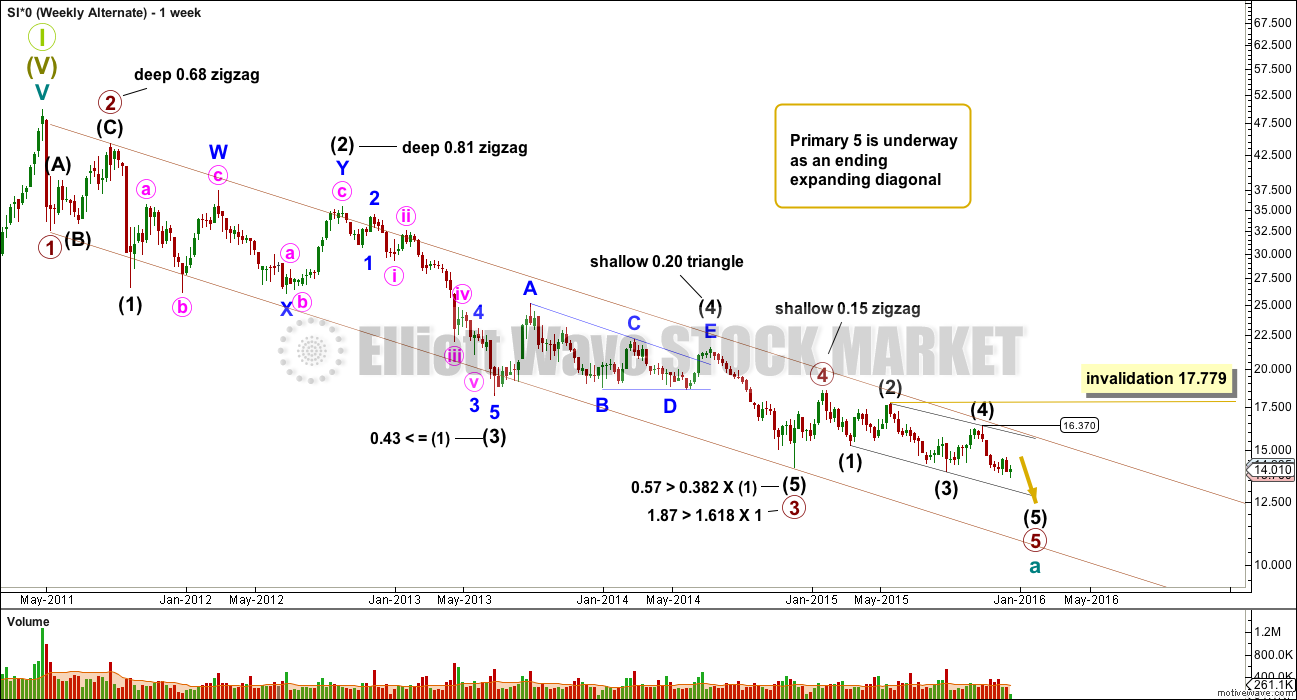
This second alternate wave count is identical to the first main wave count up to the low labelled primary wave 3. It sees primary wave 5 as underway. There are only two possible structures for a fifth wave within an impulse: either an impulse (main wave count) or an ending diagonal (this alternate wave count).
With this data from COMEX this wave count now fits and meets all the rules for an ending expanding diagonal.
All the sub waves must subdivide as zigzags within an ending diagonal. The fourth wave should overlap back into first wave price territory and may not move beyond the end of the second wave.
Intermediate wave (1) is now 3.215 in length, intermediate wave (2) is 2.44 in length, intermediate wave (3) is longer than intermediate wave (1) at 3.80 in length, and intermediate wave (4) is longer than intermediate wave (2) at 2.46 in length. The rules regarding wave lengths for an expanding diagonal are met.
Click chart to enlarge.
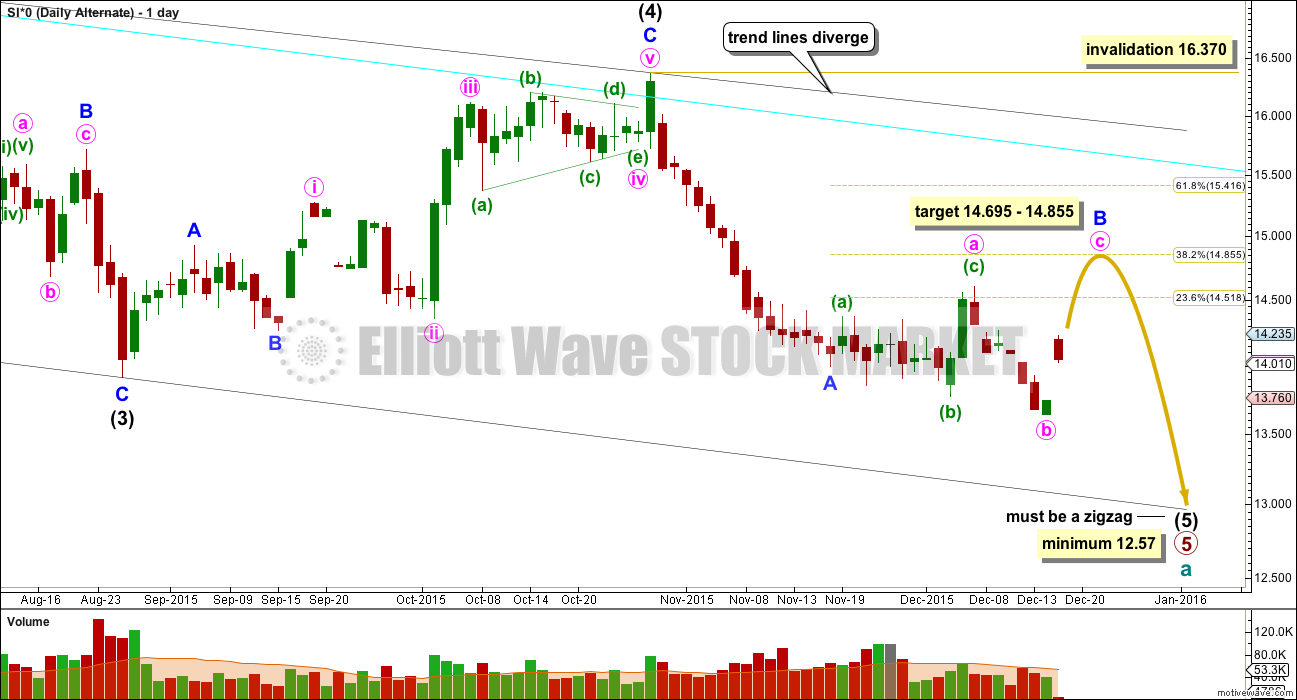
The trend lines of the diagonal diverge, so this rule is also met. The cyan trend line is a copy of the (1)-(3) trend line to illustrate that the black (2)-(4) trend line diverges from the black (1)-(3) trend line.
Intermediate wave (5) must be longer than intermediate wave (3) in length, so it must end at or below 12.57. Intermediate wave (5) must subdivide as a zigzag and within it minor wave B is an incomplete expanded flat. In the short term, this wave count does not diverge from the main wave count.
The fact that this wave count now meets all Elliott wave rules for Silver goes some small way to supporting the same idea for Gold. However, for Gold the rules regarding wave lengths are still not met with COMEX data. For Gold the idea of an ending diagonal still violates Elliott wave rules.
TECHNICAL ANALYSIS
WEEKLY CHART
Click chart to enlarge. Chart courtesy of StockCharts.com.
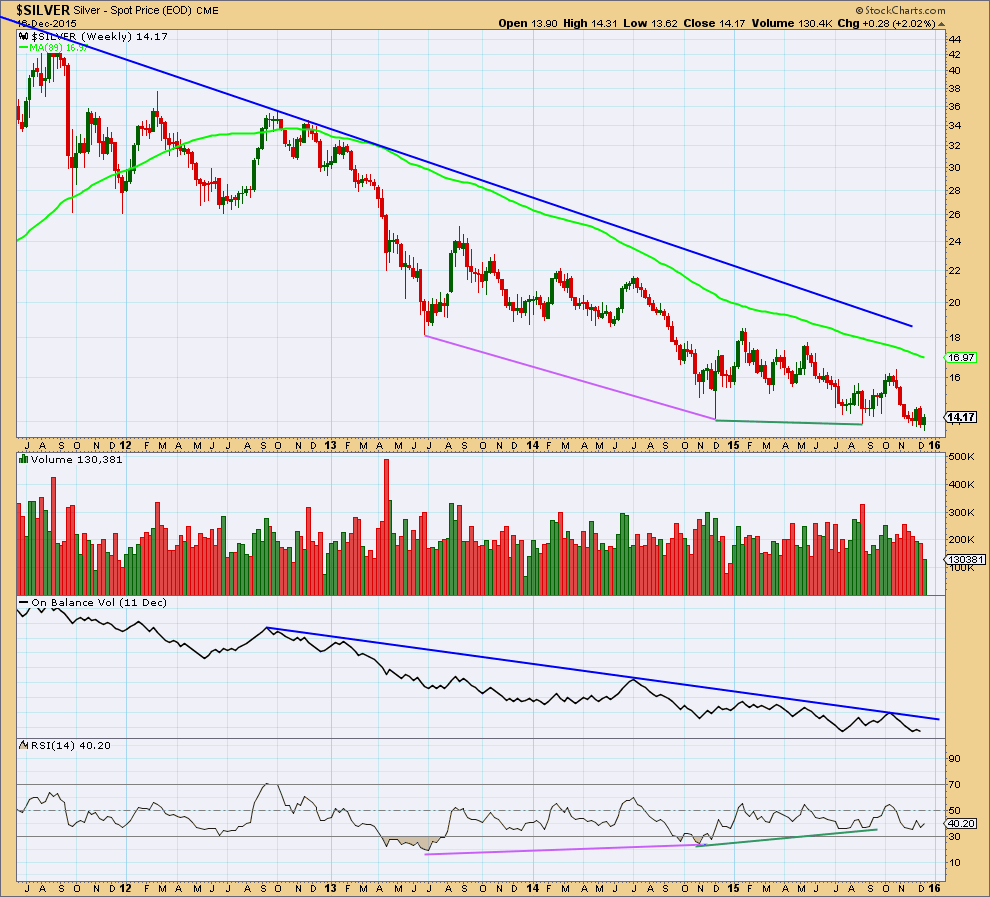
Silver has been in a bear market since April 2011. I am adjusting the length of the weekly moving average, so that it shows where this bear market has been finding resistance. The 89 week (a Fibonacci number) Simple Moving Average works well for this bear market. If that is breached by a weekly candlestick, it would be strong indication that Silver has changed from bear to bull.
Of recent weeks, strongest volume is for a downwards week. This is bearish. The last four completed weeks of overall downwards movement have come with declining volume. This indicates there is weakness in downwards price movement.
On Balance Volume remains below a long held trend line. This trend line is somewhat shallow, repeatedly tested, and reasonably technically significant. While OBV remains below that trend line it will remain bearish.
RSI shows strong double divergence with price over a long time period (pink and green lines on price and RSI). While price made new lows RSI failed to make new lows. This indicates weakness in downwards movement and is bullish. Because this divergence is double and over such a long time period it is highly technically significant. This indicator is often leading (anticipates a trend change).
The regular technical analysis picture is unclear at the weekly chart level. A trend change will come and RSI is indicating it may come sooner or have arrived already. It needs to be confirmed by price, and a break above the blue bear market trend line would be full and final confirmation of a trend change.
DAILY CHART
Click chart to enlarge. Chart courtesy of StockCharts.com.
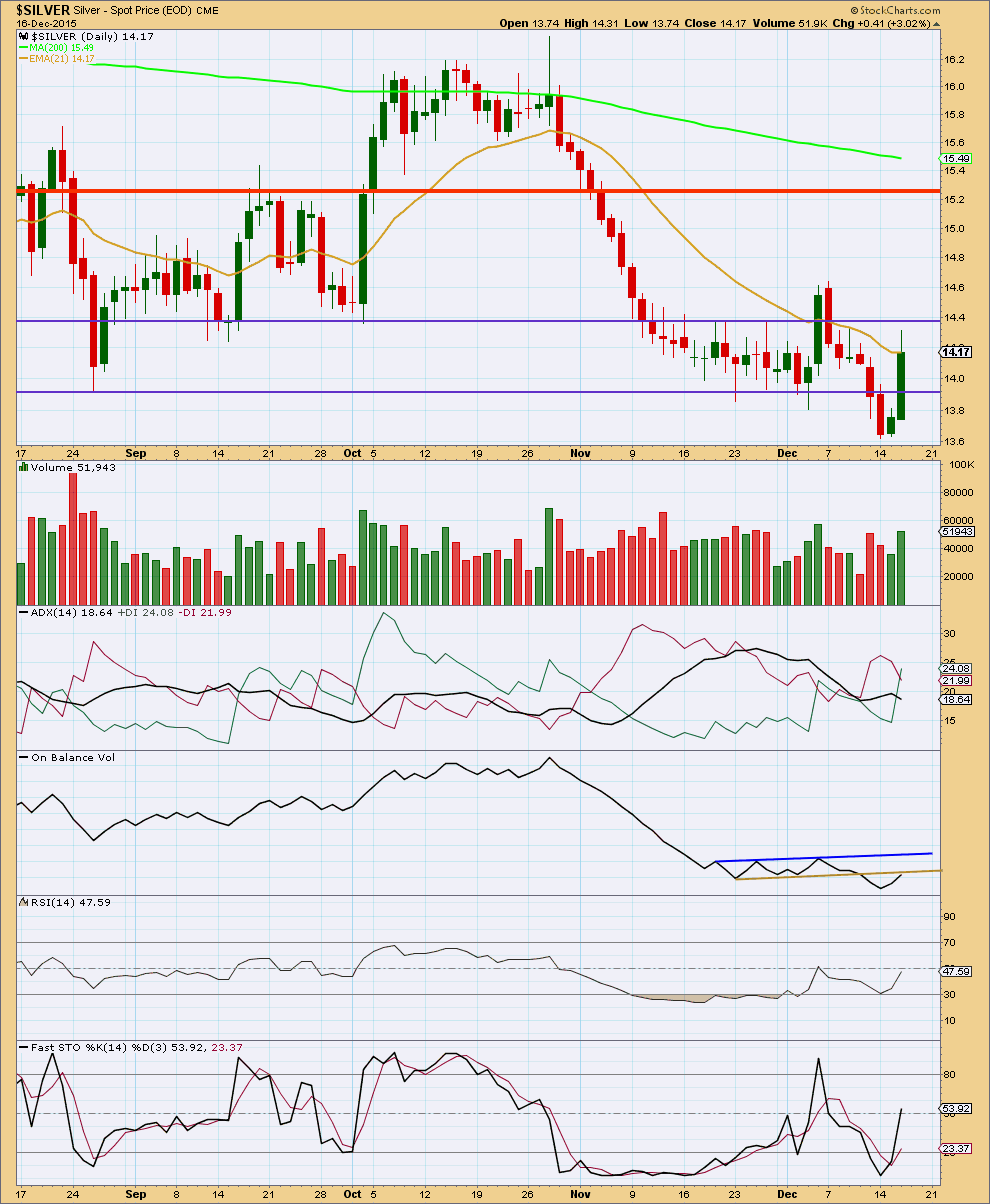
Thursday’s strong upwards day comes on an increase in volume. This suggests more upwards movement is likely and supports the Elliott wave count short term.
During this sideways consolidation that Silver entered back in about 24th November, it is an upwards day which shows strongest volume. This suggests that when the breakout comes it is more likely to be upwards than downwards, but this does not support the Elliott wave counts. This trick of looking for the day with strongest volume to indicate a breakout direction often works, but not always. It is indicative and not definitive.
ADX still indicates the market is not trending. It is consolidating. Price should be expected to swing from resistance to support and back again. Currently some more upwards movement should be expected until price reaches resistance (and may overshoot it again) and Stochastics reaches overbought at the same time.
A breakout would be indicated with a break above or below the purple horizontal trend lines coming on a day with an increase in volume.
On Balance Volume has come up to find resistance at the brown trend line. If it breaks above that line, the next line of resistance is just above. This may assist to show when upwards movement from price comes to an end and when the next downwards swing begins.
This analysis is published about 01:29 a.m. EST.
Wow! Now we have a conundrum. Since the ending diagonal is a real possibility for Silver, we will need to watch Gold closely as it heads back down toward the lower trend line, around 1,040ish. Historical data shows that Gold has done well SOMETIMES during periods that the FED is raising rates. Cycle wave a may be coming to an end very soon….or not…
One article about FED rate raising and Gold price:
http://thedailygold.com/the-effect-of-a-fed-rate-hike-on-precious-metals/
I know. It is a conundrum.
I am suspicious that the diagonal for Gold will play out.
For Silver it looks like the best count, with RSI showing so much divergence over such a long period of time.
And so I don’t think there is too much longer for this bear market to go.