
Price behaved exactly as expected.
Overall, lower movement for an inside day continues the fourth wave correction that Gold is currently in.
Summary: More sideways movement is expected for a few days yet. It is possible Gold may make a new high above 1,112.19 in the next day or two, which is most likely to be part of the correction and not the resumption of the short term bull trend. This correction should remain above 1,081.57 and may find support at the violet channel on the daily and hourly charts.
New updates to this analysis are in bold.
To see the last long term analysis with weekly charts click here.
MAIN ELLIOTT WAVE COUNT
Click chart to enlarge.
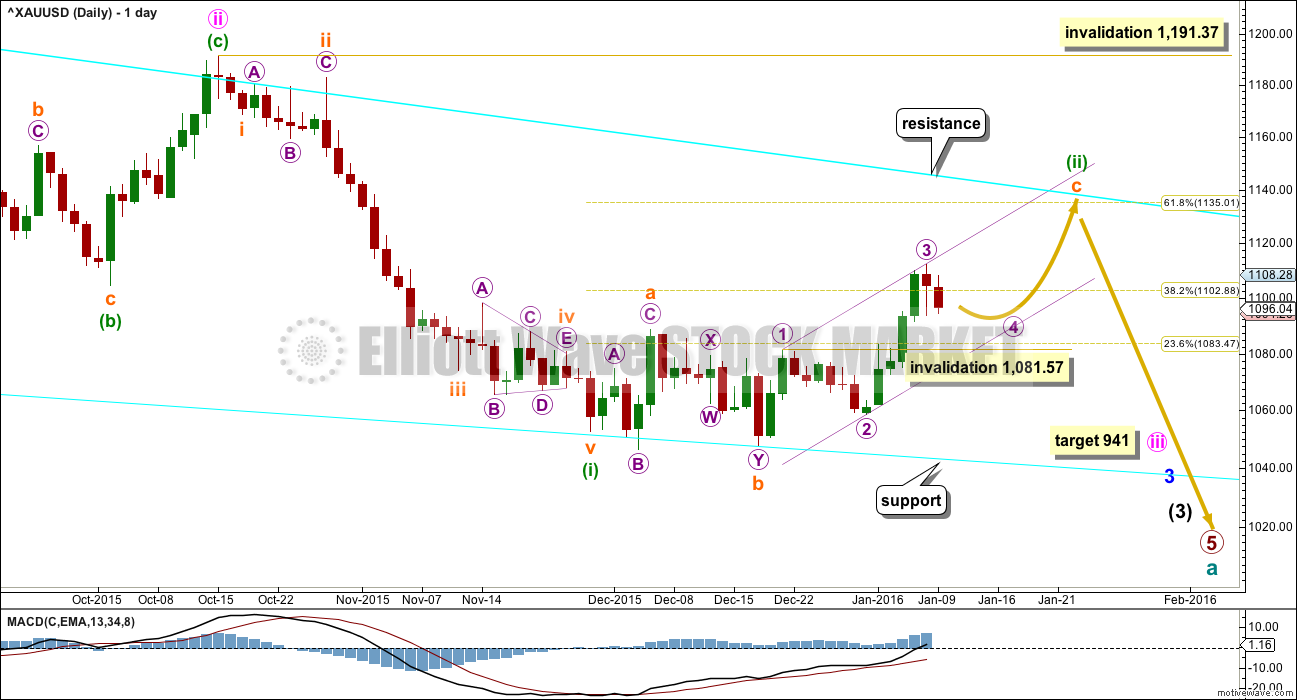
Gold has been in a bear market since September 2011. There has not yet been confirmation of a change from bear to bull, and so at this stage any bull wave count would be trying to pick a low which is not advised. Price remains below the 200 day moving average and below the cyan trend line (copied over to the daily chart). The bear market should be expected to be intact until we have technical confirmation of a big trend change.
That technical confirmation would come with a breach of the upper cyan trend line by at least one full daily candlestick above and not touching the line. A new high above 1,191.37 would provide full and final price confirmation.
The final line of resistance (cyan line copied over from weekly charts) is only overshot and not so far properly breached. Simple is best, and the simplest method to confirm a trend change is a trend line.
Minute wave ii is a complete zigzag and deep at 0.73 the length of minute wave i.
At 941 minute wave iii would reach 1.618 the length of minute wave i.
Minuette wave (i) is complete.
Minuette wave (ii) looks like a fairly typical expanded flat correction which may end about the 0.618 Fibonacci ratio at 1,135.
Draw a channel about subminuette wave c using Elliott’s first technique: draw the first trend line from the ends of micro waves 1 to 3, then place a parallel copy on the end of micro wave 2. Look for micro wave 4 to find support at the lower edge of the channel. Copy the channel over to the hourly chart.
Click chart to enlarge.
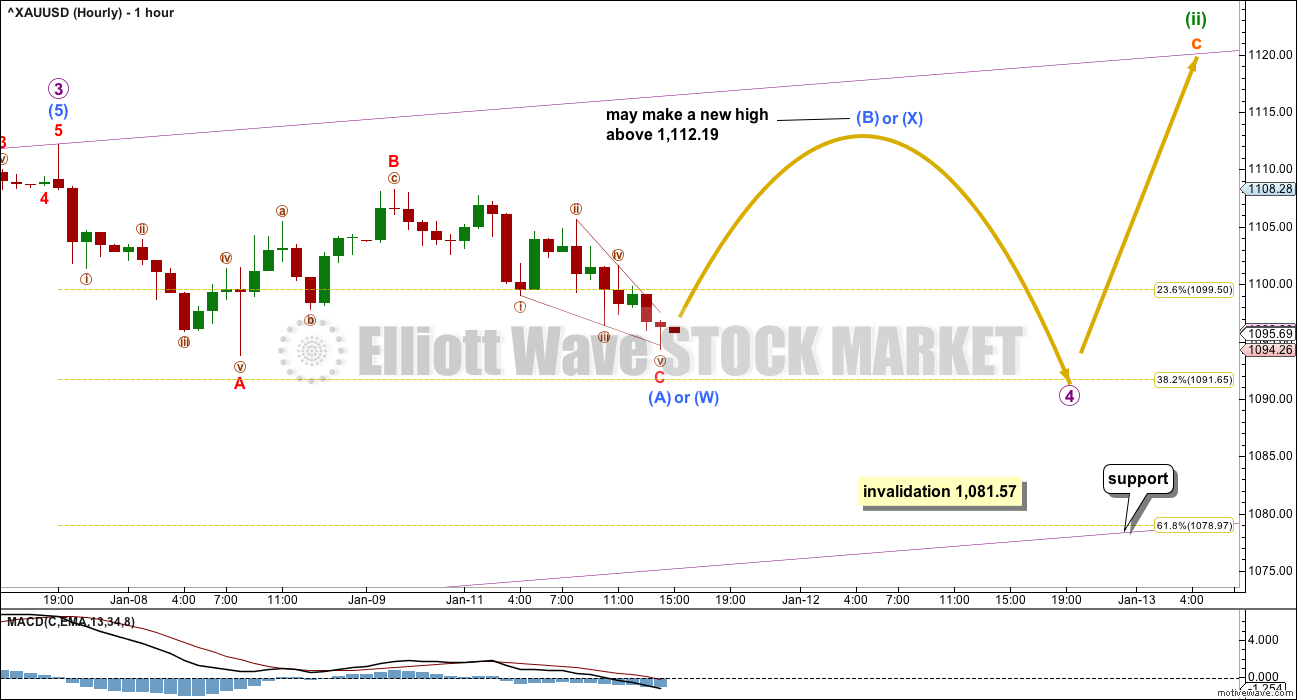
There are still multiple structural possibilities that micro wave 4 may unfold as. I am labelling it so far as either a flat or combination, but it may also be a triangle. What that means in practical terms is it is impossible to predict the pathway price may take while this correction unfolds. The labelling on the hourly chart may change over the next few days.
What is clear again today is micro wave 4 is not over. Expect choppy overlapping sideways movement for a range bound market to continue for a few days more.
Micro wave 4 may not move into micro wave 1 price territory below 1,081.57.
A zigzag may now be complete for submicro wave (A). Minuscule wave C has failed to move below the end of minuscule wave A by 0.5. Minuscule wave C is slightly truncated. But it looks like it may be over as the lower edge of the ending contracting diagonal trend line is slightly overshot. Minuscule wave C may yet continue lower though and turn out to be an impulse; this may be so far a series of overlapping first and second waves.
Submicro wave (A) or (W) so far looks like it is subdividing as a zigzag, a three wave structure. This means that if micro wave 4 is unfolding as an expanded flat or running triangle, then submicro wave (B) within it may make a new high above submicro wave (A) at 1,112.19.
Micro wave 2 was a deep zigzag. Micro wave 4 should be expected to exhibit alternation, so is most likely to be a flat, combination or triangle. So far none of those possibilities can be seen as complete.
Micro wave 2 lasted seven days. Micro wave 4 so far can be counted as only one daily candlestick, so a further four or seven to total a Fibonacci five or eight should be expected.
ALTERNATE DAILY WAVE COUNT
Click chart to enlarge.
I am aware that this is the wave count which EWI and Danerics have. The implications are important, so I will follow this wave count daily for members here too.
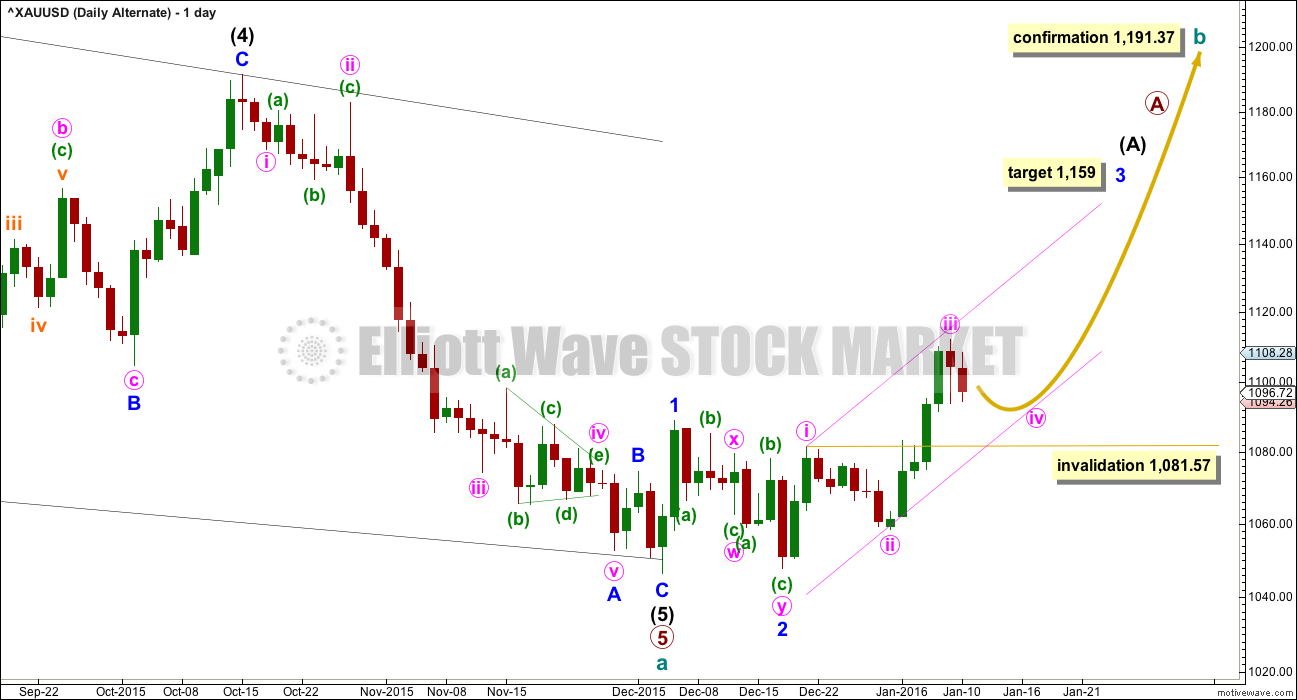
Everything is the same up to the end of the triangle for primary wave 4 (see weekly charts for this larger structure). Thereafter, primary wave 5 is seen as an ending contracting diagonal.
Within the ending contracting diagonal, it is not possible to see intermediate wave (2) as a zigzag and meet all Elliott wave rules. To see an explanation of why see this video at 10:25.
The same problem exists for the ending diagonal of primary wave 5 itself. Intermediate wave (3) is longer than intermediate wave (1) which would suggest an expanding diagonal, but intermediate wave (4) is shorter than intermediate wave (2) and the trend lines converge which suggests a contracting diagonal.
From “Elliott Wave Principle” by Frost and Prechter, 10th edition, page 88: “In the contracting variety, wave 3 is always shorter than wave 1, wave 4 is always shorter than wave 2, and wave 5 is always shorter than wave 3. In the expanding variety, wave 3 is always longer than wave 1, wave 4 is always longer than wave 2, and wave 5 is always longer than wave 3.”
This structure violates the rules for both a contracting and expanding variety. If the rules in Frost and Prechter are accepted, then this is an invalid wave count.
It may be that the rules need to be rewritten to add “sometimes a third wave may be the longest within a contracting or expanding diagonal”. But I have never seen Robert Prechter publish such a rule, I do not know that it exists.
I cannot reconcile this wave count from EWI with the rules in Frost and Prechter.
If this wave count is correct, then the diagonal is most likely over.
This wave count expects that the bear market from September 2011, has very recently ended and that Gold is in a new bull market to last one to several years. A trend change of that magnitude absolutely requires confirmation before it may be used with any confidence.
A new trend up at cycle degree must begin with a clear five wave structure at the daily chart level. So far only minor waves 1 and 2 are complete. Minor wave 3 would reach 2.618 the length of minor wave 1 at 1,159.
Minor wave 3 may only subdivide as an impulse. So far minute waves i, ii and now iii may be complete. Minute wave iv should unfold over 5 or 8 days as choppy overlapping sideways movement. It may not move into minute wave i price territory below 1,081.57.
The hourly chart for this bull wave count would be exactly the same as the bear, only everything would be moved up three degrees.
I want to remind members that last time Gold saw a reasonable upwards movement from 24th July, 2015, to 15th October, 2015, there were many people who expected that rise meant the bear market had ended and a new bull market had begun. It turned out that idea was premature: price turned around and made new lows. On 21st August I developed three bullish wave counts, partly in response to a demand from members, and one by one they have all been eliminated.
Now, again, price rises and there is a demand for bullish wave counts.
It is my strong view that this is premature. I will publish this wave count with that strong caveat.
Eventually the market will change from bear to bull, and when that change is confirmed that is the time to have confidence in a bull wave count. That time is not now.
Price remains below the 200 day moving average. Price has made a series of lower highs and lower lows down to the last recent low. There is not a clear five up on the daily chart. Price remains below the bear market trend line (cyan line on the main daily chart). While price remains below that line this wave count will be an alternate and comes with a strong warning that it is premature.
When the upwards impulse of minor wave 3 is complete, then how low the following correction goes will tell us which wave count, bull or bear, is correct. At that stage, minor wave 4 must remain above minor wave 1 price territory at 1,088.79 while the main wave count will expect new lows.
Short to mid term there is no divergence between the two wave counts. Both expect a fourth wave correction to move sideways and be followed by a fifth wave up. With both wave counts expecting the same thing next, we may have more confidence in that expectation.
TECHNICAL ANALYSIS
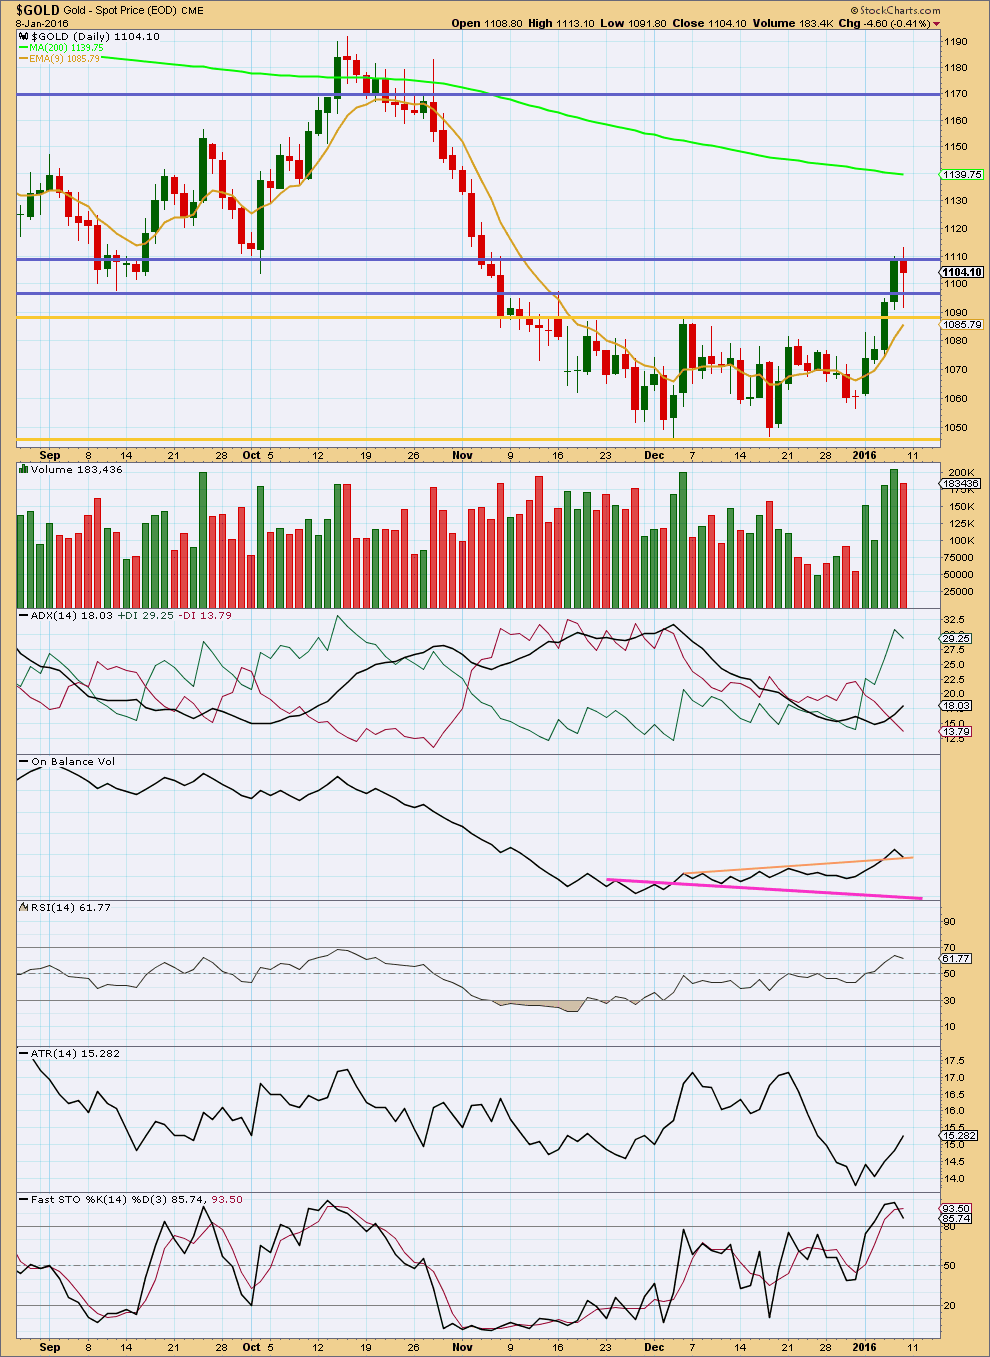
Click chart to enlarge. Chart courtesy of StockCharts.com.
At the time this analysis is published data is unavailable from StockCharts because the session is not over.
This regular TA will be updated later today after 6:30pm EST.
This analysis is published @ 04:48 p.m. EST.
Lara,
Thanks for the advice. So far KeriKeri, Matapouri Beach and Pahia/Russel area were recommended…All sound great.
D
Pretty much anything in the Bay of Islands is beautiful.
And it depends what you prefer. Bush? Beach? Waves? Boating? Fishing? Inland or coastal?
I’m really happy to advise you on which areas are good and would suit your lifestyle. Maybe email me? admin@elliottwavegold.com
This downwards movement is still a fourth wave correction for both wave counts.
Fourth waves can get close to first wave price territory. And this one is doing that.
It’s not invalidated and the wave count will remain the same while the invalidation point holds.
More sideways movement for a few days yet for it to have the right look. An upwards swing within the consolidation about here for a low degree B wave. That may be very choppy and overlapping.
There is an outside possibility with a very low probability that the bear trend could resume. If price breaks below 1,081.57 by any amount at any time frame then expect the bear market has resumed with a strong third wave down (or still possibly a C wave for an ending diagonal scenario).
Only a new low below 1,081.57 would change the expectation and short / mid term outlook.
While price remains above 1,081.57 the higher probability wave count expects a fourth wave is unfolding, to be followed by a fifth wave up.
THANK YOU:lara, for your 7;00 AM. new ZEALAND post, WE WERE AFRAID YOU MIGHT HAVE DECIDED TO TAKE THE DAY OFF TO GO SURFING AGAIN LAST NIGHT, SLEEPING ON THE BEACH. We have become dependent on your guidence. Silly “fraidy”cats that we are (at least me).
I’ve seen great questions/conversations with Papudi, Dreamer, Stephen, Matt (hope I didn’t miss anyone) here today. And Lara’s discussions/direction on the gold trend is awesome. Thanks Lara for being on-top of these developments and being so awesome.
I’ve determined conclusively, we are all watching the confounded invalidation point !!
🙂
This could be a 4th wave diagonal wave of 5 up, couldn’t it? That is, this C wave may be a diagonal with its 4th wave moving below 1081.57. Perhaps that is what you meant in the parentheses above.
I tend to distrust 4th waves that have already moved so close to 1st wave territory. Odds are they don’t pan out anymore as planned.
To rephrase my comment into a better question: can a C wave take on the form of a diagonal?
Thanks.
I don’t have my EWP book handy, but memory says that there are more requirements to a diagonal than the 4-th wave overlapping the 1st wave, namely that wave 1 and maybe 3 need to be a 3 not a 5. The tricky part is that some waves in reality are ambiguous as to how they should be counted.
Thanks Fencepost for inspiring me to buy EWP book.
When you find the page please let us know. I can not find these rules.
To the best of my knowledge, all of the waves of a diagonal are threes.
I just briefly forgot if an expanding diagonal is permitted in a C wave formation. So far, it looks like it to me. Gold may well drop to the 1060s and then shoot back up to finish this correction.
In the 10th edition of Frost and Prechter all the rules for all structures are in pages 86 to 91.
Rules for ending diagonals are slightly different for leading diagonals.
C waves can be diagonals, either contracting or expanding.
Ending diagonals require all sub-waves to subdivide as zigzags. The fourth wave must overlap first wave price territory, but may not move beyond the end of the second wave.
Expanding diagonals require 3 to be longer than 1, 5 longer than 3, and 4 longer than 2. Trend lines must diverge.
Contracting diagonals are opposite; 3 shorter than 1, 5 shorter than 3 and 4 shorter than 2. Trend lines converge.
That’s about it.
Lara, if the count invalidates what are the options?
Could Minuette ii be over as a WXY?
What else?
That’s about it. A double combination for a complete correction; flat – X – zigzag.
But I’ve not published the idea because that move has a clear slope.
Combinations should be sideways structures.
This does not look like a combination.
On that basis the idea is technically valid, just, but has a low probability.
I will only publish it if it proves itself to be true.
But I will add a comment of what it means if the wave count is invalidated.
Did gold just recently complete a Bearish Butterfly Pattern on the daily chart?
http://pasteboard.co/JWyPKBJ.png
Hourly wave count may be in play here.
Lara: “Micro wave 4 may not move into micro wave 1 price territory below 1,081.57.”
Submicro wave (A) or (W) may not be over yet.
I would say we are SHORT TERM BEARISH here, Not short term bullish.
L Looks short term bearish to me.Low so far of 1083.3 is awful close to 1081.8 INVALIDATION point.
You might be right, jdst looks to be breaking out!
Since Dec 4 gold COT data has been bullish using large commercial’s short position.
It appears it has proven well.
COT data are not updated to current level.
On EW terminology for the upcoming cycle wave b.
Page 57 in EWP book.
” A super cycle B wave in a Supercycle correction would be of sufficient amplitude and duration that it would be popularly identified as a “bull market.” However, its proper label under the Wave Principle is a proregressive wave, or using the conventional term as it should be used, a bear market rally.”
Gold’s Ending diagonal idea submitted by Dreamer from EWI is described in EWP Frost and Prechter book in Figure 1-48 on page 53.
” A flat follows by a zigzag is another example shown in figure 1-48. Naturally, since the figures in this sections depict corrections in bull markets, they need only be inverted to observe them as upward corrections in bear market.”
May be my interpretation of comparison is not correct.
Lara: “But when A subdivides as a three that means B can move beyond its start. So now this idea expects a new multi year bull market for Gold, and it may make new all time highs.”
Where can I find above rule in EWP book??
Thanks.
I don’t know the page, but she’s saying that the corrective pattern could be an expanded flat at cycle degree when cycle wave a is seen as a 3 wave structure.
Page 89 in Frost and Prechter (10th edition), rules for flats.
It’s not written so clearly there, it’s almost an absence of the zigzag rule that does it plus the guidelines for flats.
One of the zigzag rules (same page): “wave B never moves beyond the start of A”
This is not a flat rule. Which means B can move beyond the start of A for a flat.
Flat guidelines include: “wave B usually retraces between 100 and 138 percent of wave A”
Thanks Lara found it!!!!!
On a monthly chart, Captain Hook sees a 5th of a 5th wave down yet for $GDM, the index behind GDX. If this were to play out, it would be bearish for Gold.
http://www.safehaven.com/article/40120/the-counterintuitive-markets
Lara,
Maybe I am mixing this up, but is the EWI count now bullish? You have shown this for 2 days now, but I could have sworn that originally it was a bearish count. Is the EWI count the same as your bullish count?
For the record, I still see current movement as a correction within a bear market.
Previously the EWI count was bearish. But now the ending diagonal is probably complete and so it is bullish.
As soon as I moved the label for the end of intermediate (5) up to the last low and noticed the small overshoot then I noticed that it looked typical and complete.
It changed from bearish to bullish.
I think Lara means, “Short Term Bullish” as opposed to Long term bullish change. That means she still will look for a new low AFTER this expected 5th wave high. IMOBut it is just after midnight in New Zealand so we cant expect any answere from LARA just now.
No, the alternate bullish wave count is long term bullish. At cycle degree.
Long term bullish.
Just to add some complexity to the ED scenario, Daneric still shows one more move down. Not sure if EWI shares his view or not.
From my understanding, the only current bullish count long term is not confirmed until we hit 1191.37
The other counts are bullish shorter term but are expected to turn back down and to hit new lows in the not too distant future (unless we go above 1191.37).
Exactly.
Hi Lara,
You mentioned that NZD/USD may be in a large triangle so you are not trading it. Would be great if you could post your current chart(s) here (just charts will do – please don’t spend any time on it for me).
I’m looking to purchase property around Bay of Plenty in future so have a keen eye on getting as much NZD for my USD as possible.
EDIT: Just seen Dermot’s comment below – must be a popular country!!
Many thanks in advance!!
NZ is in a property market bubble. The chart of our property market is a classic enough bubble it could be used in a textbook of a bubble.
I do not currently own property in NZ. I have used Elliott wave analysis of the NZ market to exit in 2007 and I will only re enter when the bubble has burst.
I expect NZ is right on the cusp at this time. I think our stock market, the NZ50 has just turned, but that is unconfirmed.
We are lagging behind the rest of the world.
Real Estate data for the NZ market is updated mid month. When that’s done I will publish it along with my NZ50 analysis.
I’ve done an update to NZDUSD. It will be proofed and published shortly.
Lara – many thanks for the heads up and the analysis – very much appreciated!!
Hi Lara,
I have thought of moving to the Northland area of NZ. Do you have any suggestions on what areas are most appealing?
Thanks.
I live in Mangawhai Heads. If you like small towns this one is pretty friendly. And the beaches are just amazing.
Anywhere on the Tutukaka coast is just stunning.
I am considering moving further north up to Tutukaka to get further away from Auckland. I don’t like big cities and it’s spreading it’s malaise northwards.
I live in Mangawhai pretty much because the surf options are great.
The images on Google maps are accurate. It really is quite beautiful.