
Upwards movement was expected. Price moved sideways in a small range to complete a very small red candlestick.
Price remains above the invalidation point and is hugging the support line.
Summary: The target for the bear wave count remains 1,135. The target for the bull wave count is at 1,227 mid term. It is possible short term that a correction may be continuing sideways as a combination which may make a new low below 1,082.74 but not below 1,071.36.
New updates to this analysis are in bold.
Last published weekly charts with the bigger picture are here.
MAIN BEAR ELLIOTT WAVE COUNT
Click chart to enlarge.
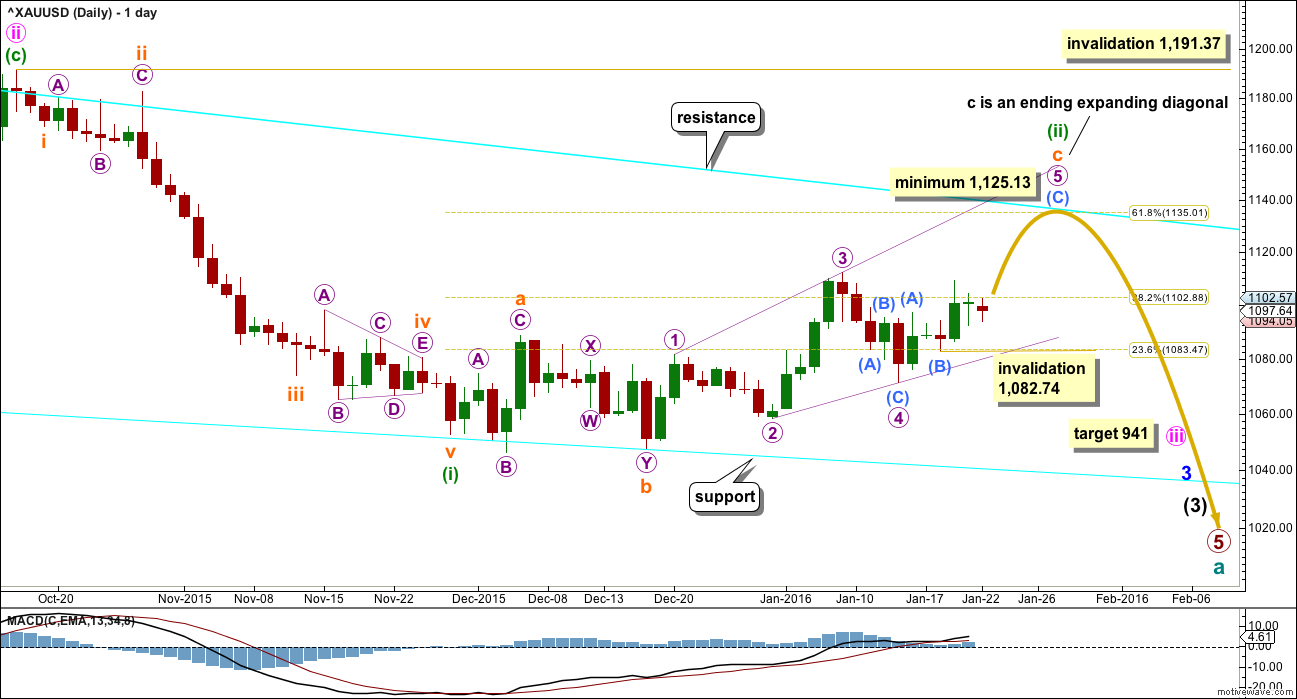
Gold has been in a bear market since September 2011. There has not yet been confirmation of a change from bear to bull, so at this stage any bull wave count would be trying to pick a low which is not advised. Price remains below the 200 day moving average and below the cyan trend line. The bear market should be expected to be intact until we have technical confirmation of a big trend change.
That technical confirmation would come with a breach of the upper cyan trend line by at least one full daily candlestick above and not touching the line. A new high above 1,191.37 would provide full and final price confirmation.
The final line of resistance (cyan line copied over from weekly charts) is only overshot and not so far properly breached. Simple is best, and the simplest method to confirm a trend change is a trend line.
Minute wave ii is a complete zigzag and deep at 0.73 the length of minute wave i.
At 941 minute wave iii would reach 1.618 the length of minute wave i.
Minuette wave (i) is complete.
Minuette wave (ii) looks like a fairly typical expanded flat correction which may end about the 0.618 Fibonacci ratio at 1,135.
Subminuette wave c may be unfolding as an ending expanding diagonal. Ending diagonals require all subwaves to subdivide as zigzags. No second wave correction may move beyond the start of its first wave at 1,082.74 within submicro wave (C).
The diagonal must be expanding because micro wave 3 is longer than micro wave 1, and micro wave 4 is longer than micro wave 2. The trend lines diverge. Micro wave 5 must be longer than micro wave 3, so it must end above 1,125.13.
There is still the possibility that minuette wave (ii) could be labelled as complete at the last high. If it was over, then the only structure I can see which would fit is a double combination. But double combinations are sideways structures; they should not have a slope against the trend one degree higher. This correction has a clear slope. For that reason I still do not want to publish this idea because the probability is too low. I will only publish it if price breaks below 1,071.36.
Click chart to enlarge.
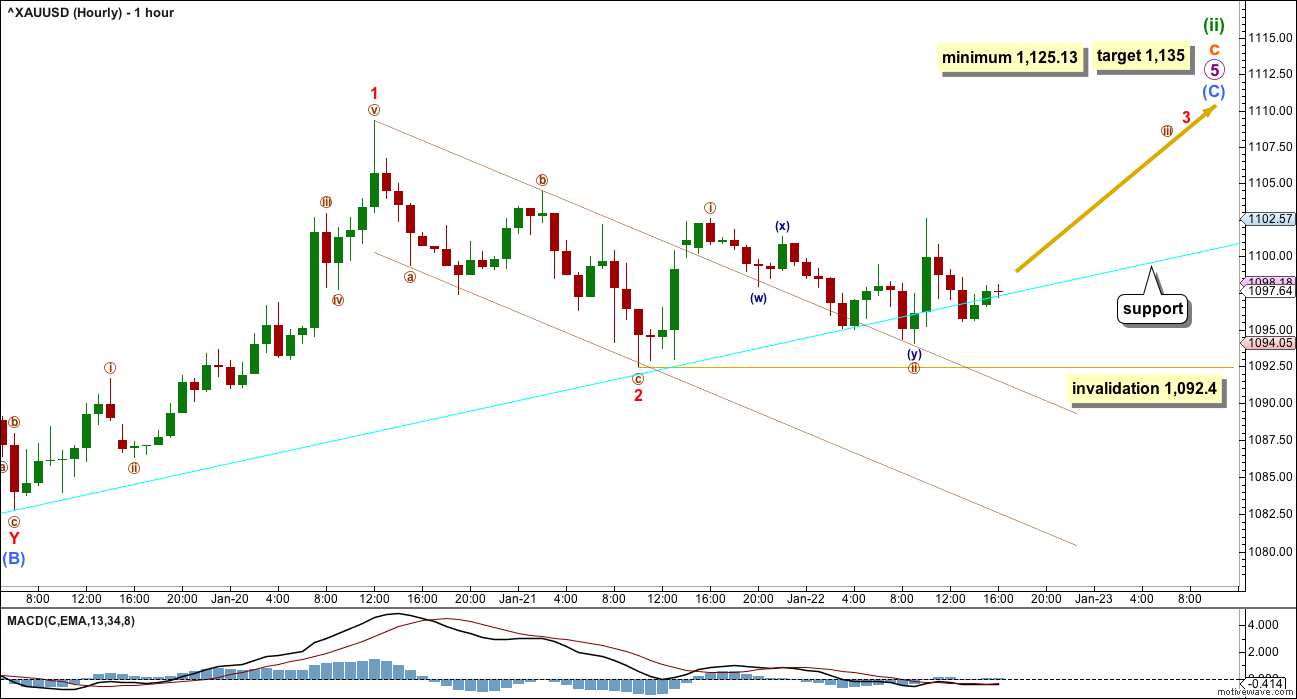
Micro wave 5 upwards is underway and must subdivide as a zigzag.
The diagonal is expanding, so micro wave 5 must be longer than micro wave 3. Micro wave 5 would reach equality with micro wave 3 at 1,125.13. It must end above this point.
The target will remain the 0.618 Fibonacci ratio at 1,135. The cyan line, the final bear market trend line on the daily chart, should provide strong resistance for this wave count.
Submicro waves (A) and (B) are complete within micro wave 5. Submicro wave (C) is underway and must subdivide as a five wave structure.
So far minuscule waves 1 and now 2 are most likely complete. Minuscule wave 3 must move above the end of minuscule wave 1 at 1,109.31, and it should show an increase in upwards momentum.
So far subminuette wave c in its entirety has lasted 23 days. If it exhibits a Fibonacci number, it may complete in a total 34 days which would see it continue now for a further 8 days. This is a rough expectation only; it may not exhibit a Fibonacci number.
There is another scenario presented on the hourly alternate chart below that works in the same way for this wave count. Here minuscule wave 2 could be continuing sideways as a double combination. That would expect a little more downwards movement which may move below 1,092.4 but not below the start of minuscule wave 1 at 1,082.74.
That alternate idea would see minuscule wave 2 more time consuming (it should end on Monday). Because it would require a breach of the cyan trend line, which is copied over from the daily chart, I expect it has a lower probability.
ALTERNATE BULL WAVE COUNT
Click chart to enlarge.
This was published here as a second alternate wave count. I will use it as the only regular alternate bull wave count because it is the only bull wave count to meet all Elliott wave rules.
I want to remind members that last time Gold saw a reasonable upwards movement from 24th July, 2015, to 15th October, 2015, there were many who expected that rise meant the bear market had ended and a new bull market had begun. It turned out that idea was premature: price turned around and made new lows. On 21st August I developed three bullish wave counts, partly in response to a demand from members, and one by one they have all been eliminated.
Now, again, price rises and there is a demand for bullish wave counts.
It is my strong view that this is premature. I will publish this wave count with that strong caveat.
Eventually the market will change from bear to bull, and when that change is confirmed that is the time to have confidence in a bull wave count. That time is not now.
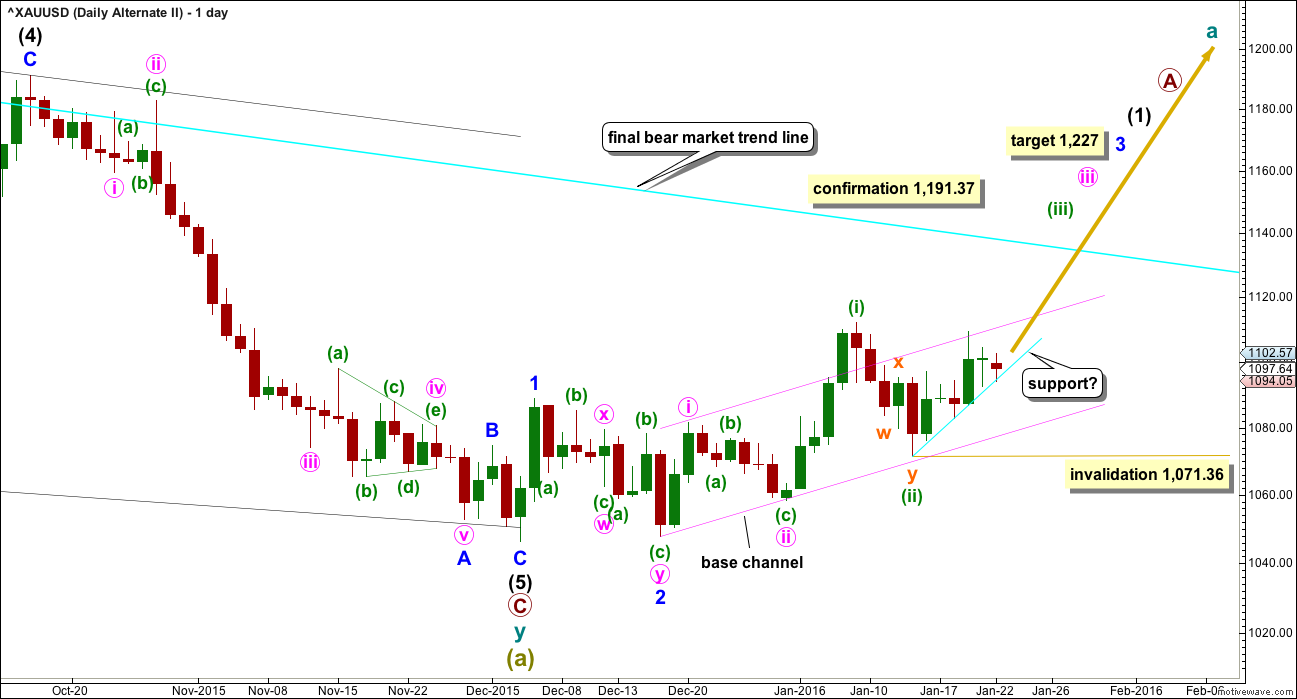
Price remains below the 200 day moving average. Price has made a series of lower highs and lower lows down to the last recent low. There is not a clear five up on the daily chart. Price remains below the bear market trend line. While price remains below that line this wave count will be an alternate and comes with a strong warning that it is premature.
Downwards movement from the all time high for this bull wave count is seen as a big double zigzag which would most likely be complete at super cycle degree for an A wave.
When an A wave subdivides as a three, then the larger structure may be either a flat or triangle. The B wave may make a new price extreme beyond the start of the A wave within flats and triangles. Here, super cycle wave (b) may move above 1,920.18 as in an expanded flat or running triangle.
When the first move of a larger correction subdivides as a multiple (w-x-y), then a combination may be eliminated. Combinations may not have multiples within multiples, because that would increase the number of corrective structures within a multiple beyond three and violate the rule.
A new wave up at super cycle degree must begin with a clear five up on the daily chart (and probably the weekly as well). So far only minor waves 1 and 2 are complete. At 1,227 minor wave 3 would reach 4.236 the length of minor wave 1.
Minute waves i and ii are complete within minor wave 3. The acceleration channel is not working, so a more conservative base channel is drawn about these two waves. Copy it over to the hourly chart. A lower degree second wave correction for minuette wave (ii) should not breach a base channel drawn about a first and second wave one or more degrees higher. The lower pink line should provide support, if this wave count is correct.
Minuette wave (ii) should now also be complete. A third wave at three degrees may be in the very early stages. Within minuette wave (iii), no second wave correction may move below the start of its first wave at 1,071.36. Minuette wave (iii) may only subdivide as an impulse. I will leave the invalidation point lower than for the bear at this time for this bull wave count. When the base channel is breached by upwards movement, then a third wave would be confirmed. At that stage, it would be appropriate to move the invalidation point higher. For now this market may need room to move.
For the short term, along the way up, for this wave count downwards corrections may find some support at the cyan trend line.
Click chart to enlarge.
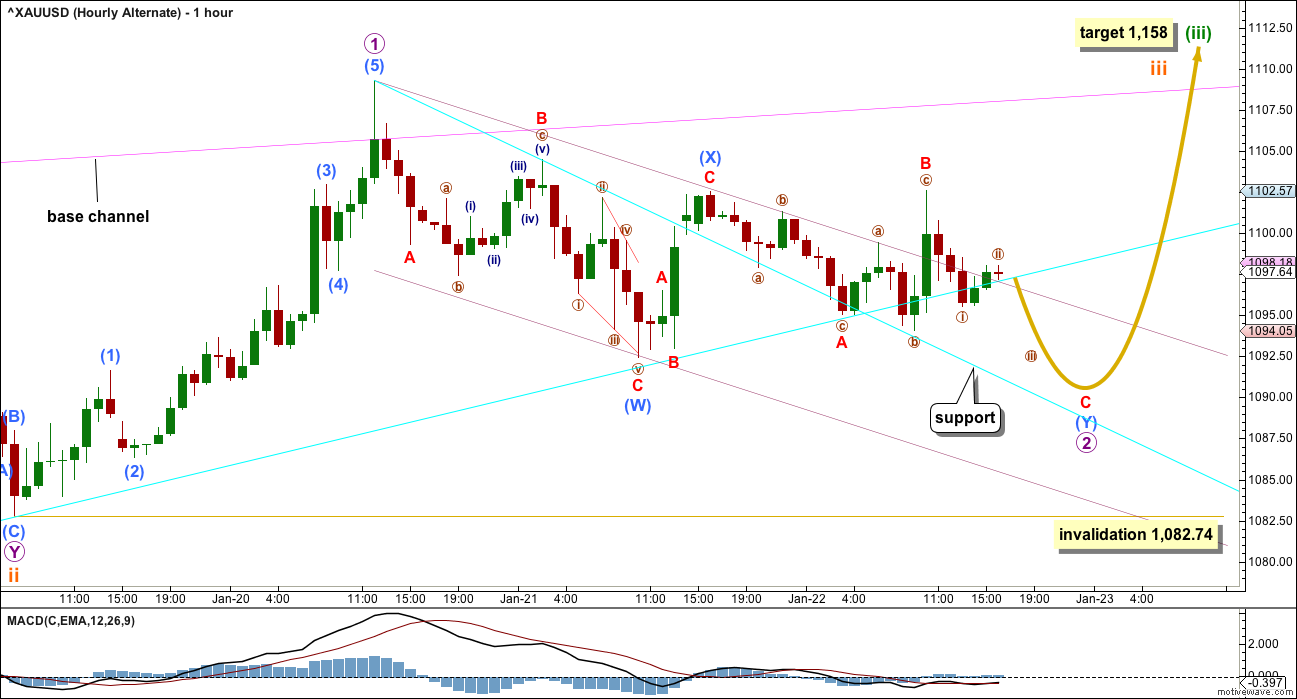
There are two different ways to see recent movement. Both ideas fit for both wave counts in the same way because both wave counts are expecting a five wave impulse is unfolding upwards; this alternate for a third wave and the main wave count for a C wave.
Sideways movement for Friday may be a continuation of micro wave 2 as a double combination.
The first structure in the double for submicro wave (W) was a zigzag. The double is joined by a three, a zigzag in the opposite direction labelled submicro wave (X). The second structure in the double is a flat correction labelled submicro wave (Y).
Within submicro wave (Y), minuscule wave C must move lower to complete. It would be unlikely to be over at the low labelled nano wave i as it would be truncated, so the structure would then be a very rare running flat. What is more likely is this would be regular flat with C to move below the end of A at 1,095.04.
Micro wave 2 may not move beyond the start of micro wave 1 below 1,082.74.
This wave count has a better fit for subdivisions of recent movement during Friday’s session. But it would require the cyan trend line to be properly breached. On the daily chart, this line looks like it is where price is finding support, and it looks unlikely at this stage that it would be breached.
On the hourly chart, the downwards sloping cyan line is providing support. The channel about micro wave 2 is a best fit.
A new high above 1,102.57 would provide price confirmation that the downwards wave labelled nano wave i is over. At that stage, upwards movement could not be a second wave correction within an unfolding impulse.
TECHNICAL ANALYSIS
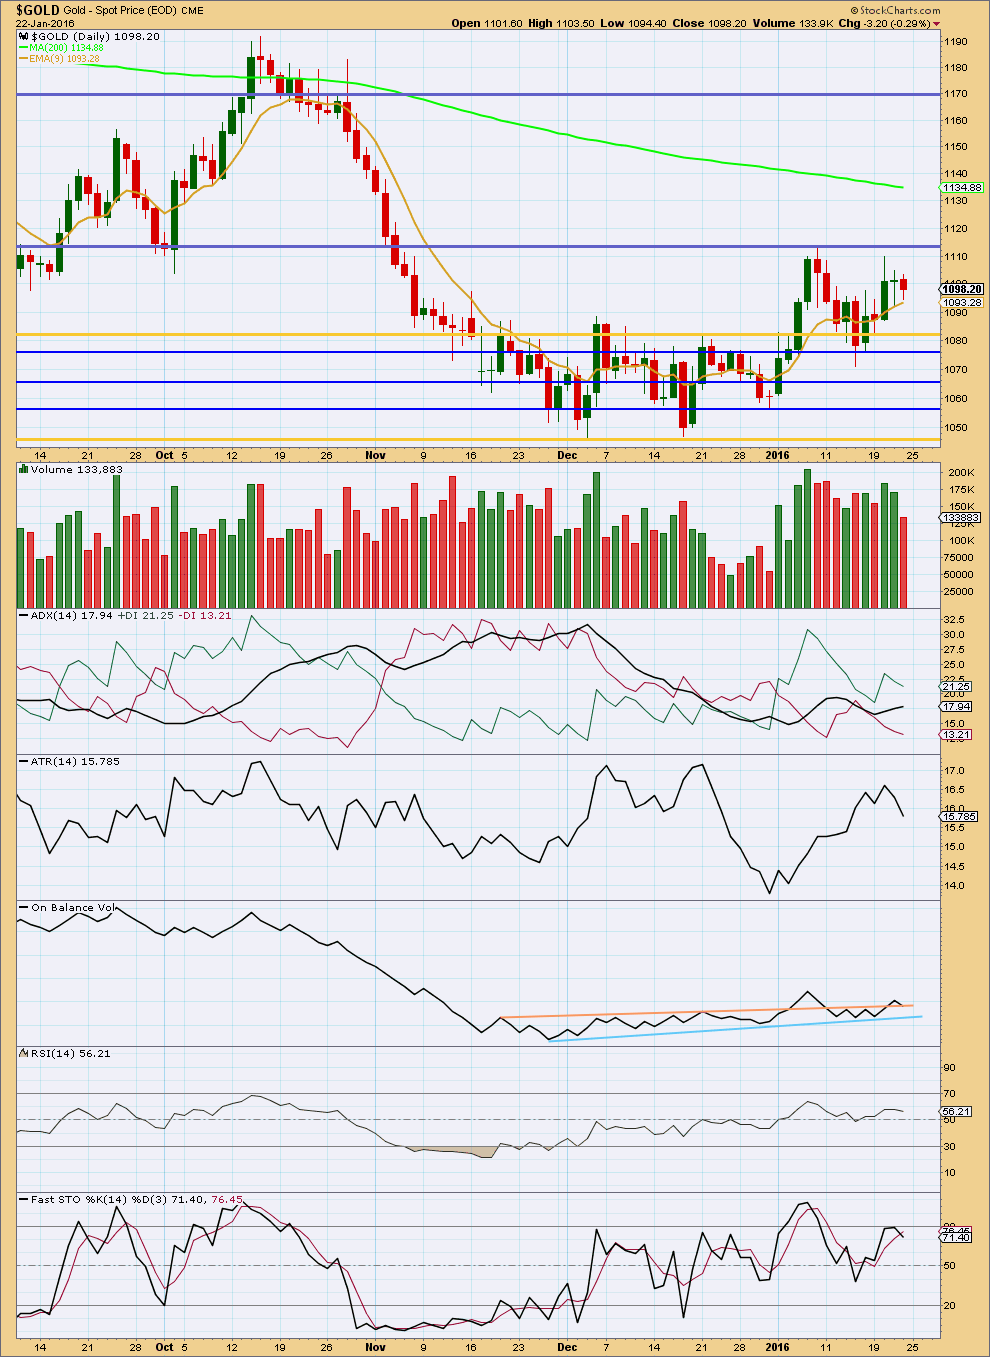
Click chart to enlarge. Chart courtesy of StockCharts.com.
A small red candlestick with a small real body looks corrective. This view is supported by lighter volume for a downwards day.
The volume profile remains bullish short / mid term. Price came with increasing volume as it rose to the last high on 8th January. As price fell from there, it fell on declining volume.
ADX is still increasing and above 15 indicating a new upward trend has begun. ATR disagrees as it has turned down. This may be overall due to the last two days of corrective movement.
On Balance Volume breached the upper peach line and has come down to touch that line. That may provide support and hold price up. If that line is breached, then the next support line for OBV is very close.
Neither RSI nor Stochastics are overbought. There is room for the market to rise.
This analysis is published @ 10:50 p.m. EST.
GDX MACD Daily became a BUY today for the first time since January 7th.
That is a strong signal. MACD bottomed Jan 19th when GDX at 5+ year low of 12.40
GDX is now in a SELL with MACD at 1,3,5,15,39, and 78 minutes. Lately mornings are a buy and afternoon a sell
Since 3:32 pm GDX changed into a BUY.
Price is moving in the right direction, but taking its time doing so. Lots of choppy overlapping but upwards movement.
I cannot see the middle of a complete impulse in there.
What that suggests is likely is an increase in momentum as the middle of a third wave gets going.
Sometimes they do start off slowly.
The trend line is holding and todays upwards movement is looking steeper. So far it all looks right.
Kitco Technical: Turbulent 2016 Start Has Silver Lining For Gold-Mon Jan 25 9:40am
http://www.kitco.com/news/2016-01-25/Five-Reasons-RBC-Capital-Markets-Is-Positive-On-Gold.html
It looks like gold is locked near 1112…No new high in a day or two vl force gold to come down..
Lots of ups and downs on the way up to bear target 1135 minimum 1125.13 in roughly 8 trading days.
Gold doing an intermediate wave; this takes a little time. OF COURSE IT WILL MAKE NEW HIGHS . if not today then tonight or tomorrow. PATIENCE IS A VIRTUE. BELIEVE!!
I will kindly ask please Stephen that you don’t use all caps. Its the digital equivalent of shouting at people.
Thank you.
acknowleged.
“A new high above 1,102.57 would provide price confirmation that the downwards nano wave i correction is over.” Lara Jan 22 analysis.
Gold now at 1105.75, can gold still go below 1100?
“A new high above 1,102.57 would provide price confirmation that the downwards wave labelled nano wave i is over. At that stage, upwards movement could not be a second wave correction within an unfolding impulse.” Lara Jan 22 analysis.
Perhaps gold is now in micro wave 3 as far as the bull hourly count is concerned?
It should be.
But it really is taking its time isn’t it.
Still, price is moving in the right direction and the trend line is holding. This upwards move, although choppy, now has a steeper slope as it moves away from the trend line.
So far so good….
Gary Savage predicting a surprise move down i n the US dollar to maybe 94.5 by mid feb to maybe early march (unlike Daneric) This could (would ) be the catalyst for a strong move UP in gold. Stocks may have seen high last friday. Currency surprise likely next week IMHO.
PUG SMA LLC twitter service on SPX EW analysis:
https://twitter.com/PUGStockMarket
LARA SAID: On 21st August I developed three bullish wave counts, partly in response to a demand from members, and one by one they have all been eliminated.
Just wondering please, in those three cases did the price action ever meet these requirements you mention later in the post: “Price remains below the 200 day moving average and below the cyan trend line”.
In other words, did gold meet the requirement of both crossing the 200 mov avg as well as rise above the cyan line… before turning lower?
thank you.
No. It did not.
We got an overshoot of the final bear market trend line, you can see it on the top left of the main daily chart. But not a proper breach.
Price overshot the 200 day SMA but again, no proper breach.
I define a breach as a full daily candlestick above and not touching.
Daneric’s latest on Gold:
“Gold is either going to have 1 more quick bust to a new low to complete the ending diagonal triangle pattern or it has completed already. The next few days should reveal hopefully.”
Daneric on the $USD:
“Looking for $103 on the dollar based on the wave count and pattern target before a significant pullback. Might be pushing things. If it gets that high look for headline bullish stories on why the dollar is the greatest thing on earth. Then expect a pullback – sentiment is very high and needs to shake out.”