
Yesterday’s analysis expected a new high above 1,112.19 and an upwards breakout, which is exactly what has happened.
Summary: The target for both bull and bear wave counts short term is now 1,135. Price will be touching the cyan trend line when it gets there. How price behaves at that line will indicate which wave count, bull or bear, is correct. If that line is breached, then expect price to continue higher to the next target at 1,158. If price turns down strongly from there, then Gold may be seeing a trend change to make new lows. For now the trend is up.
New updates to this analysis are in bold.
Last published weekly charts with the bigger picture are here.
MAIN BEAR ELLIOTT WAVE COUNT
Click chart to enlarge.
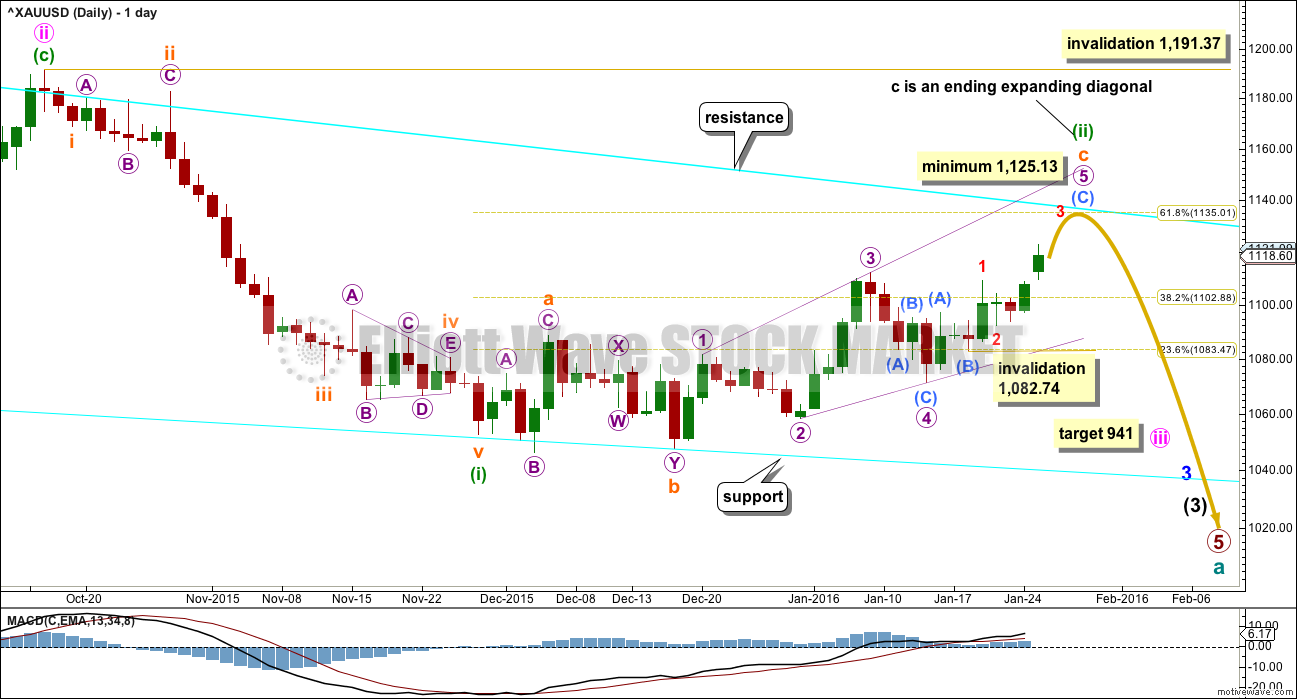
Gold has been in a bear market since September 2011. There has not yet been confirmation of a change from bear to bull, so at this stage any bull wave count would be trying to pick a low which is not advised. Price remains below the 200 day moving average and below the cyan trend line. The bear market should be expected to be intact until we have technical confirmation of a big trend change.
That technical confirmation would come with a breach of the upper cyan trend line by at least one full daily candlestick above and not touching the line. A new high above 1,191.37 would provide full and final price confirmation.
The final line of resistance (cyan line copied over from weekly charts) is only overshot and not so far properly breached. Simple is best, and the simplest method to confirm a trend change is a trend line.
Minute wave ii is a complete zigzag and deep at 0.73 the length of minute wave i.
At 941 minute wave iii would reach 1.618 the length of minute wave i.
Minuette wave (i) is complete.
Minuette wave (ii) looks like a fairly typical expanded flat correction which may end about the 0.618 Fibonacci ratio at 1,135.
Subminuette wave c may be unfolding as an ending expanding diagonal. Ending diagonals require all subwaves to subdivide as zigzags. No second wave correction may move beyond the start of its first wave at 1,082.74 within submicro wave (C).
The diagonal must be expanding because micro wave 3 is longer than micro wave 1, and micro wave 4 is longer than micro wave 2. The trend lines diverge. Micro wave 5 must be longer than micro wave 3, so it must end above 1,125.13.
There is still the possibility that minuette wave (ii) could be labelled as complete at the last high. If it was over, then the only structure I can see which would fit is a double combination. But double combinations are sideways structures; they should not have a slope against the trend one degree higher. This correction has a clear slope. For that reason I still do not want to publish this idea because the probability is too low. I will only publish it if price breaks below 1,071.36.
How price behaves when it comes up to touch the cyan trend line will indicate which wave count is correct. For both some resistance should be expected at that line. If the line is properly breached, then this main bearish wave count would reduce in probability.
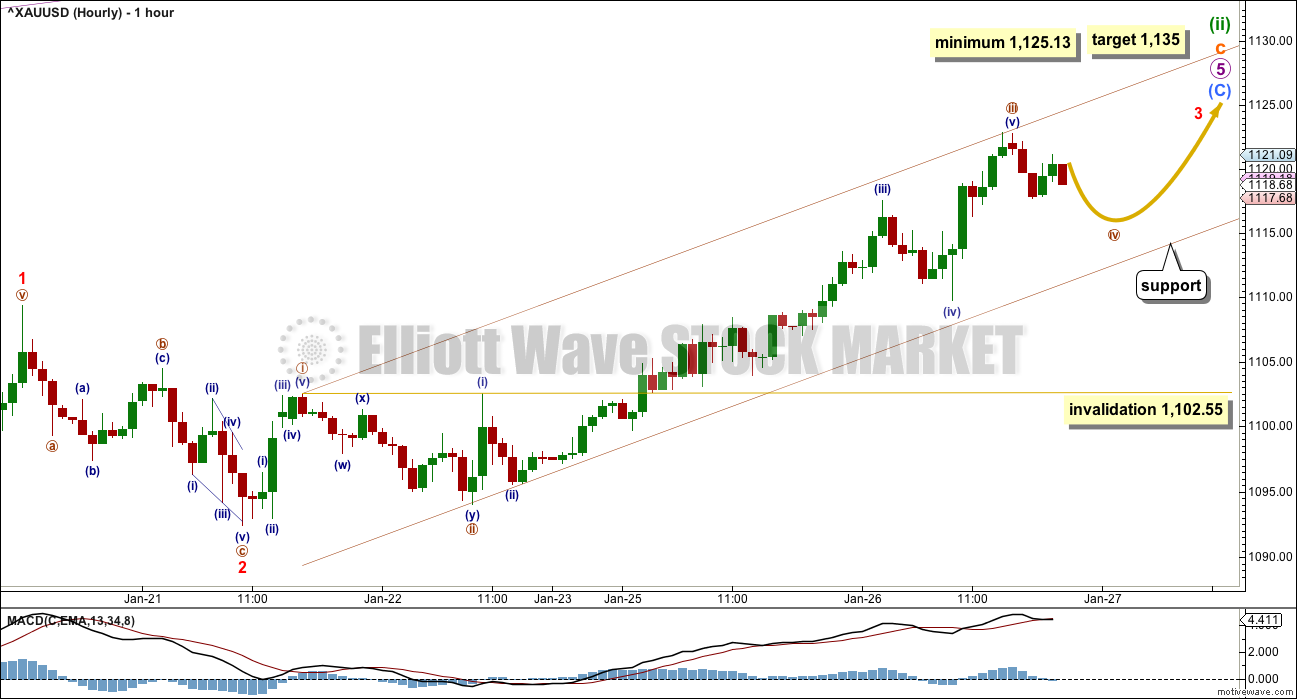
Click chart to enlarge.
Micro wave 5 upwards is underway and must subdivide as a zigzag.
The diagonal is expanding, so micro wave 5 must be longer than micro wave 3. Micro wave 5 would reach equality with micro wave 3 at 1,125.13. It must end above this point.
The target will remain the 0.618 Fibonacci ratio at 1,135. The cyan line, the final bear market trend line on the daily chart, should provide strong resistance for this wave count.
Submicro waves (A) and (B) are complete within micro wave 5. Submicro wave (C) is underway and must subdivide as a five wave structure.
Minuscule waves 1 and 2 are complete within submicro wave (C). Minuscule wave 3 is most likely incomplete. At 1,135 minuscule wave 3 would reach 1.618 the length of minuscule wave 1. This target expects that minuscule wave 5 would be short and move only sightly above the end of minuscule wave 3.
Nano wave iv is underway within minuscule wave 3. It may find support at the lower edge of the brown channel. It may not move into nano wave i price territory below 1,102.55.
ALTERNATE BULL WAVE COUNT
Click chart to enlarge.
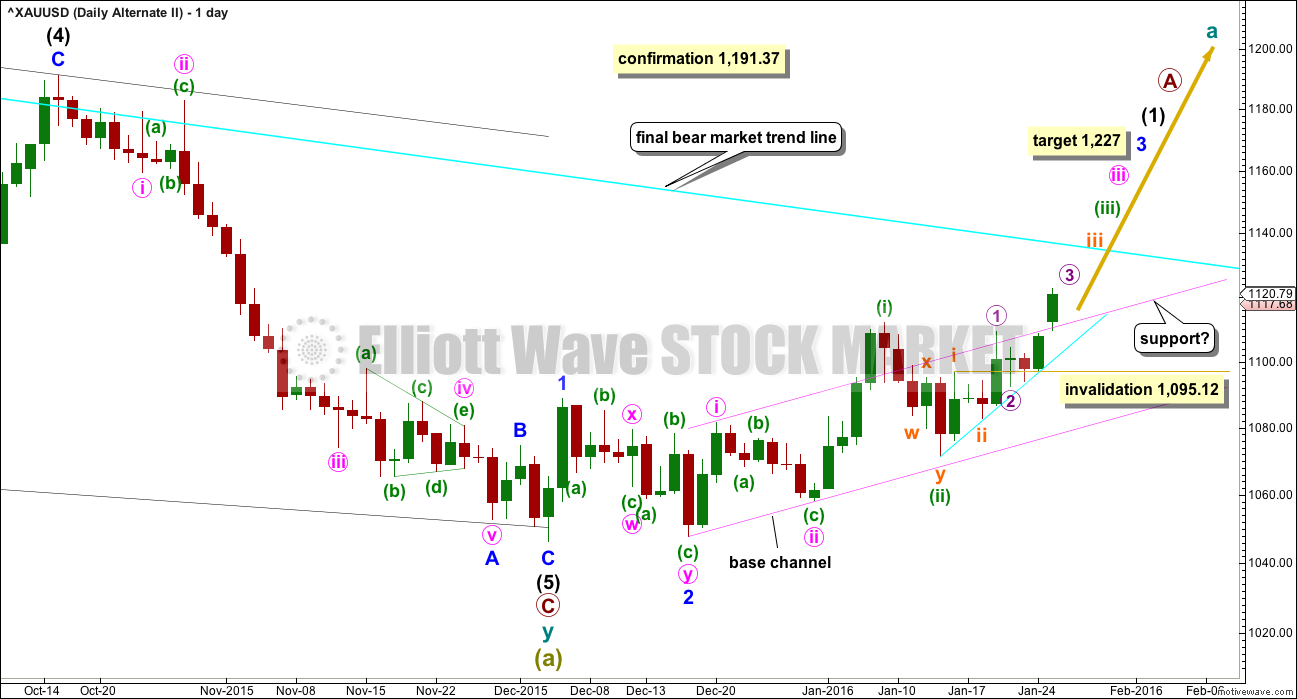
This was published here as a second alternate wave count. I will use it as the only regular alternate bull wave count because it is the only bull wave count to meet all Elliott wave rules.
I want to remind members that last time Gold saw a reasonable upwards movement from 24th July, 2015, to 15th October, 2015, there were many who expected that rise meant the bear market had ended and a new bull market had begun. It turned out that idea was premature: price turned around and made new lows. On 21st August I developed three bullish wave counts, partly in response to a demand from members, and one by one they have all been eliminated.
Now, again, price rises and there is a demand for bullish wave counts.
It is my strong view that this is premature. I will publish this wave count with that strong caveat.
Eventually the market will change from bear to bull, and when that change is confirmed that is the time to have confidence in a bull wave count. That time is not now.
Price remains below the 200 day moving average. Price has made a series of lower highs and lower lows down to the last recent low. There is not a clear five up on the daily chart. Price remains below the bear market trend line. While price remains below that line this wave count will be an alternate and comes with a strong warning that it is premature.
Downwards movement from the all time high for this bull wave count is seen as a big double zigzag which would most likely be complete at super cycle degree for an A wave.
When an A wave subdivides as a three, then the larger structure may be either a flat or triangle. The B wave may make a new price extreme beyond the start of the A wave within flats and triangles. Here, super cycle wave (b) may move above 1,920.18 as in an expanded flat or running triangle.
When the first move of a larger correction subdivides as a multiple (w-x-y), then a combination may be eliminated. Combinations may not have multiples within multiples, because that would increase the number of corrective structures within a multiple beyond three and violate the rule.
A new wave up at super cycle degree must begin with a clear five up on the daily chart (and probably the weekly as well). So far only minor waves 1 and 2 are complete. At 1,227 minor wave 3 would reach 4.236 the length of minor wave 1.
Minute waves i and ii are complete within minor wave 3. The acceleration channel is not working, so a more conservative base channel is drawn about these two waves. Copy it over to the hourly chart. A lower degree second wave correction for minuette wave (ii) should not breach a base channel drawn about a first and second wave one or more degrees higher.
The daily chart is on a semi-log scale and the hourly chart is on an arithmetic scale. This means channels sit slightly differently between these charts. The base channel has been breached now by upwards movement on both charts. The upper edge should now provide support.
This wave count still needs further upwards movement, micro wave 3 is an incomplete impulse. When subminuette wave iii is compete, then the following correction for subminuette wave iv may not move into subminuette wave i price territory below 1,095.12.
Click chart to enlarge.
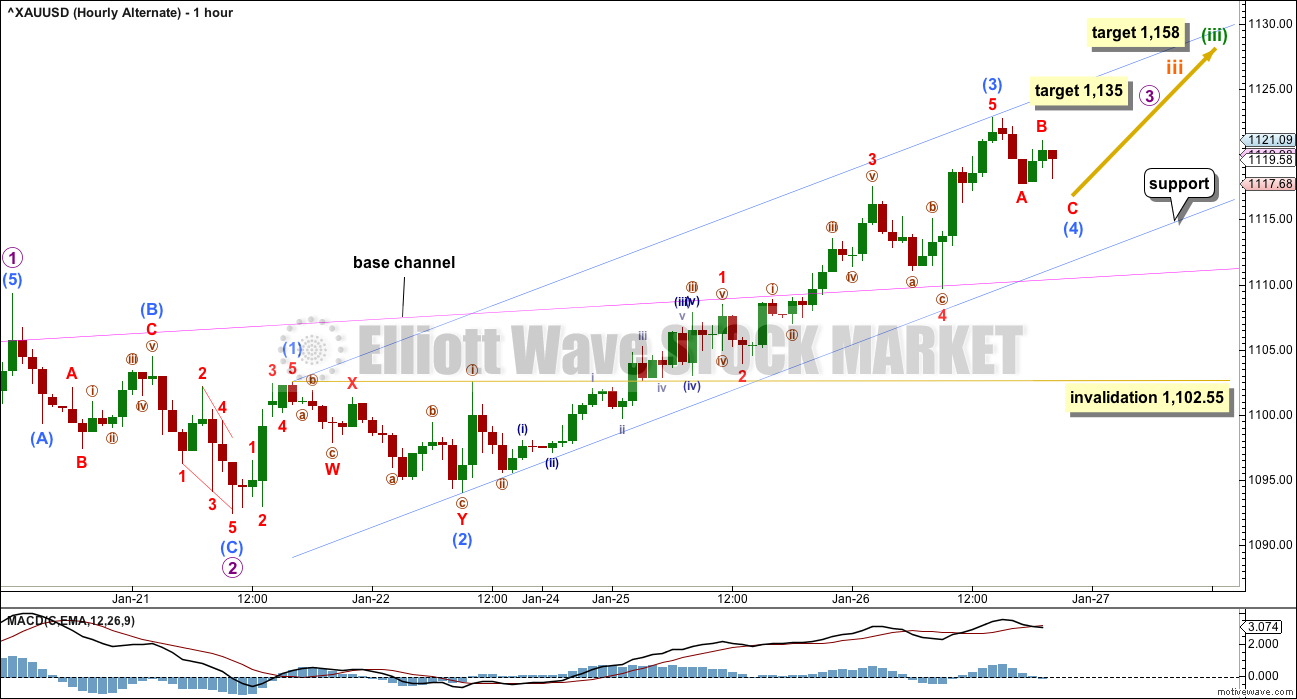
Both hourly charts are labelled in the same way, but this alternate has all labelling moved up two degrees.
Micro wave 3 may be incomplete.
Submicro wave (3) may have just ended within micro wave 3. It would be 2.19 longer than 2.618 the length of submicro wave (1).
Ratios within submicro wave (3) are: minuscule wave 3 is 0.83 short of equality in length with minuscule wave 1, and minuscule wave 5 is 0.47 short of equality in length with minuscule wave 3.
The light blue channel is drawn about the middle of the third wave using Elliott’s first technique, and it is a perfect fit. Submicro wave (4) should find support at the lower edge of this channel.
Because this labelling of the middle of this third wave has good Fibonacci ratios and it fits neatly within an Elliott channel, it is very likely that this labelling is correct.
When micro waves 3 and 4 are complete, then a target may be calculated for micro wave 5 upwards to complete the impulse of subminuette wave iii.
Micro wave 2 shows up on the daily chart as one green doji candlestick. Micro wave 4 when it arrives may also show up on the daily chart. It should be expected to be shallow against micro wave 3 (the 0.236 or 0.382 Fibonacci ratios would be favoured) and it may last one to two days.
TECHNICAL ANALYSIS
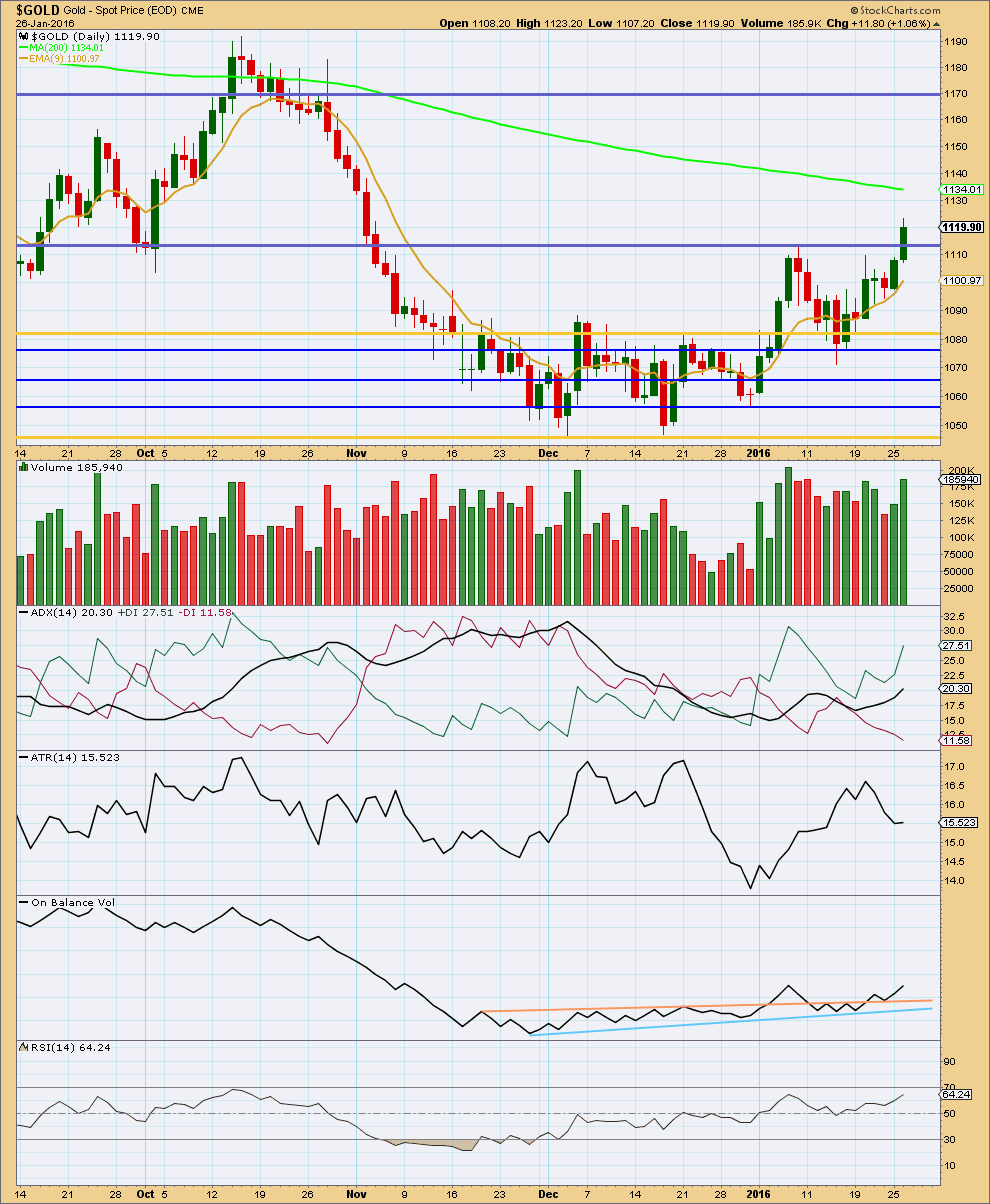
Click chart to enlarge. Chart courtesy of StockCharts.com.
Price has broken out of the sideways consolidation zone upwards on a day with an increase in volume. This adds confidence to the Elliott wave counts.
As price rises volume increases supporting the rise in price.
ADX continues to indicate there is an upwards trend. ATR disagrees as it has been declining; it is flat today. On balance the trend indication from ADX should be given more weight today. If there is an upwards trend, then ATR should be expected to soon show an increase.
On Balance Volume is moving away upwards from the peach line which provided support.
RSI is not yet overbought. There is still room for price to rise.
I am removing Stochastics today. It should not be used in a trending market.
The 9 day EMA should be used instead. It is providing support along the way up.
This analysis is published @ 08:54 p.m. EST.
Excellent day today. GDX calls, GLD calls, and NUGT all comfortably in the money now.
Looking for a strong 5th wave here and I will probably take more profits.
QQQ Puts did amazing today too. Get that bear train rolling Lara!
It looks so far like Gold may be about to give us a swift strong fifth wave, typical commodity behaviour. With a new high now I may move the invalidation point up to the high of minuscule wave 1 (main chart) at 1,109.31. I will make that decision after the close of todays session.
This is a third wave impulse. Gold often exhibits swift strong fifth waves to end its third wave impulses. And so that is something we should be aware of as a good possibility, and look out for it.
Again, the channel should show where corrections find support.
The trend is up.
Lara, for the Bear/main count have we not completed miniscule 3 already?
Bear Miniscule 3 target is 1,135. From Jan 26th analysis.
“Minuscule wave 3 is most likely incomplete. At 1,135 minuscule wave 3 would reach 1.618 the length of minuscule wave 1. This target expects that minuscule wave 5 would be short and move only sightly above the end of minuscule wave 3.”
Ah, based on the two different charts/counts I viewed I was looking at 1125 as miniscule 3 and 1135 as miniscule 5, making miniscule 5 coincide with micro 3 on the bull count. The verbage makes something else clear.
Thanks for the response. Therefore there is no target for micro 5 of bear count? That doesn’t make sense. I’m wondering if Lara has moved to the bull camp, lol.
Right there is no target for micro 5 of Bear count, except “only sightly above the end of minuscule wave 3.” No move to bull camp just what is clear now. Once micro wave 3 is complete or closer to complete Lara might provide extra clarification.
Actually, yes, I think we have.
Now minuscule waves 4 and 5 to go.
The target for the bear will be the same, still 1,135.
Sorry, just a question to understand what your expert are talking about.
The strong 5th wave down or up as far as I understand we are still in the Bear market for commodities.
Can you please clarify?
The wave counts will remain the same today. A small fourth wave correction has just very recently ended I expect and price is bouncing strongly off the lower edge of that channel.
As I explained yesterday I was planning on adding to my buy position for Gold (I’m trading the cash market using CFD’s, my broker is CMC, a NZ broker) when Gold touched that trend line. I didn’t get in right at the touch, that happened overnight for me. So I got in on the way down and went to sleep 🙂 Sometimes the entry isn’t perfect, but I expect we are in a clear upwards trend and so I’m joining it. I can handle the pain of holding a negative position for a while, and I’m managing risk by keeping my possible loss about 3-5% of my equity for each trade.
When this entry is comfortably positive I’ll move the stop to just above break even, so no risk. And then add again to the position at the next opportunity. That’s my technique anyway. It’s not common and it doesn’t always work but it does reduce risk. And risk reduction is the most important aspect of trading.
From 1:54 pm EST to high 2:07 pm gold went up $9 to 1124.
GDX up .20 and NUGT up 1.15.
Gold then started coming down choppy over next 15 minutes to 1120.
FED FOMC 2:00 pm EST news just released
Gold jumped $8 in 7 minutes
2:02p Dollar breaks to 3-week high above 119 yen after Fed minutes
2:02p U.S. stocks add to gains after Fed statement
2:01p S&P 500 up 0.5% at 1,911
2:00p Federal Reserve takes more dovish tone, says economy has slowed
Is nano wave iv complete?
AND gold on its way to 1125.
Nano wave iv ended at 10:15 am at 1114.97.
Gold just popped up after FOMC up to $1124.12
After Gold Nears 3-Month High, Sets Sights on $1,150: Technical Expert
Wednesday January 27, 2016 10:38
http://www.kitco.com/news/2016-01-27/After-Gold-Nears-3-Month-High-Sets-Sights-on-1-150-Technical-Expert.html
Lara, the alternate wave count target for micro wave 3 is at 1,135. Then micro wave 4, when it arrives may also show up on the daily chart and it may last one to two days down.
It sounds like at the 1,135 area both wave counts are forecast to go down. So I guess at that point you’ll likely let us know whether the bear or bull count is preferred?
About that price point the wave counts will diverge.
When subminuette c is a complete structure for the bear / main wave count then it will expect a new bear movement to new lows.
When micro 3 is complete for the bull / alternate then it will expect micro 4 to move sideways. It can’t move into micro 1 territory below 1,109.31.
So at that stage that is the price point which will differentiate the two wave counts. A new low below 1,109.31 would be very bearish. Some shallow sideways movement followed by a new high would be very bullish.
When we get to that point I’ll be ensuring there is a clear video outlining how each wave count should work.
Excellent web support and design for Elliott Wave Gold web page. It works like a charm!!!!!
Great job the whole team!!!
Thanks!
That’s almost all Cesar.
How well the gold COT data signal the trend change???? At extreme level will be watching COT data for a turn.
Of course excellent EW count provides the magnify confidence in trend change.
Stayed with gold long position with confidence.
Gold’s seasonal is also at play here. With Dec-Jan low gold goes up in Feb and then low in March low.
Watch for top in Feb????
Lara, although I feel like putting the following in capital letters , I wont (out of deference and respect for you). Your analytical work over this past month in dealing with this wave sequence has been nothing but superb! I am sure I speak for the rest of your many followers. Lara, you Rock The House! You Are The Bomb!
That is very kind, thank you Stephen.
Yes, it’s been a good month.
I have had bad months before too. When nothing I did seemed to be right. That’ll probably happen again.
For now, Gold is behaving itself as expected. US Oil is too. I’m not so sure on Silver, the wave count is more confusing there.
And over at EWSM the S&P and FTSE particularly are very exciting.