
Gold remains range bound.
I have two Elliott wave counts for the hourly chart today which look at this correction in two different ways.
Summary: The correction is most likely to end sooner rather than later. It may end in just one more day with a final push up to a short term target at 1,091. In the short term, a new low below 1,062.6 would be earliest indication that the correction of the last 25 days is over. The breakout is still expected to be downwards.
New updates to this analysis are in bold.
To see the last long term analysis with weekly charts click here.
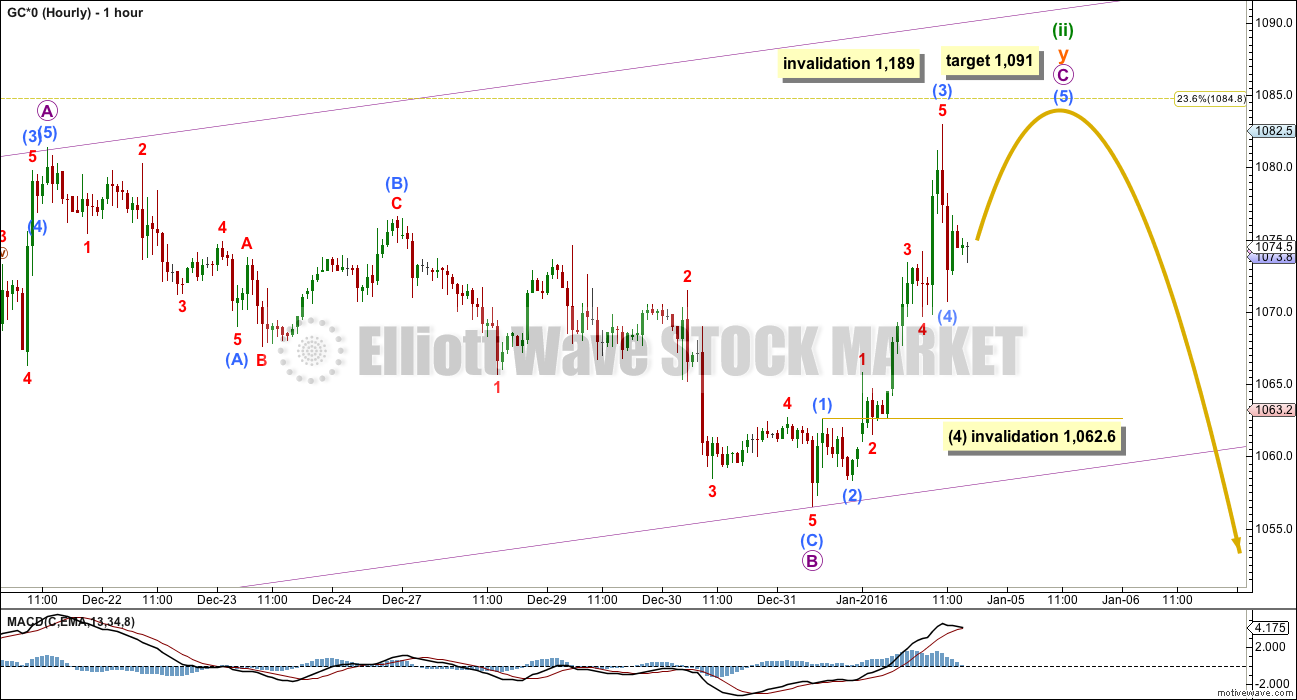
MAIN ELLIOTT WAVE COUNT

Click chart to enlarge.
Gold has been in a bear market since September 2011. There has not yet been confirmation of a change from bear to bull, and so at this stage any bull wave count would be trying to pick a low which is not advised. Price remains below the 200 day moving average and below the cyan trend line. The bear market should be expected to be intact until we have technical confirmation of a big trend change.
The final line of resistance (cyan line copied over from weekly charts) is only overshot and not so far properly breached. Simple is best, and the simplest method to confirm a trend change is a trend line.
Minute wave ii is a complete zigzag and deep at 0.73 the length of minute wave i.
At 930 minute wave iii would reach 1.618 the length of minute wave i.
Minuette wave (i) is complete.
This main wave count today looks at the possibility that minuette wave (ii) is an almost complete double combination: an expanded flat for subminuette wave w, a three in the opposite direction labelled X, and the second structure for subminuette wave y an almost complete zigzag.
MAIN HOURLY WAVE COUNT
Click chart to enlarge.
There are several structural possibilities for a second wave correction. The only structures the second wave correction may not be are triangles. At this stage, minuette wave (ii) may be an almost complete combination or it may be a flat correction (alternate wave count).
This main wave count expects it is an almost complete combination with the second structure in the double a simple zigzag labelled subminuette wave y.
At 1,091 micro wave C would reach equality in length with micro wave A. The violet channel is copied over from the daily chart. Look for price to find resistance at the upper edge of this channel, if it gets that high.
This main wave count could see the correction of minuette wave (ii) come to a swift end, possibly within the next 24 hours.
Micro wave C must subdivide as a five wave structure, either an impulse or an ending diagonal. At this stage, it looks like an impulse which may be very close to completion.
On the five minute chart, submicro wave (3) subdivides perfectly as a complete impulse. It is 1.14 short of 4.236 the length of submicro wave (1). Submicro wave (4) may not move into submicro wave (1) price territory below 1,062.6.
If this wave count is wrong, then it may be that micro wave C is actually over at the high labelled submicro wave (3). There are so many small subdivisions within this impulse, it is possible that it is complete. A new low short term below 1,062.6 may not be a fourth wave correction within this unfolding impulse, so at that stage the structure would be likely to be complete. If this wave count is invalidated short term with a new low below 1,062.6, then I would label minuette wave (ii) as complete at today’s high.
What is more likely is that a final fifth wave is required to a new high to complete the structure of micro wave C.
At the time of publication, submicro wave (4) is most likely continuing sideways. There are multiple structural possibilities for a fourth wave correction. When it is done then the final fifth wave up should unfold to a new high.
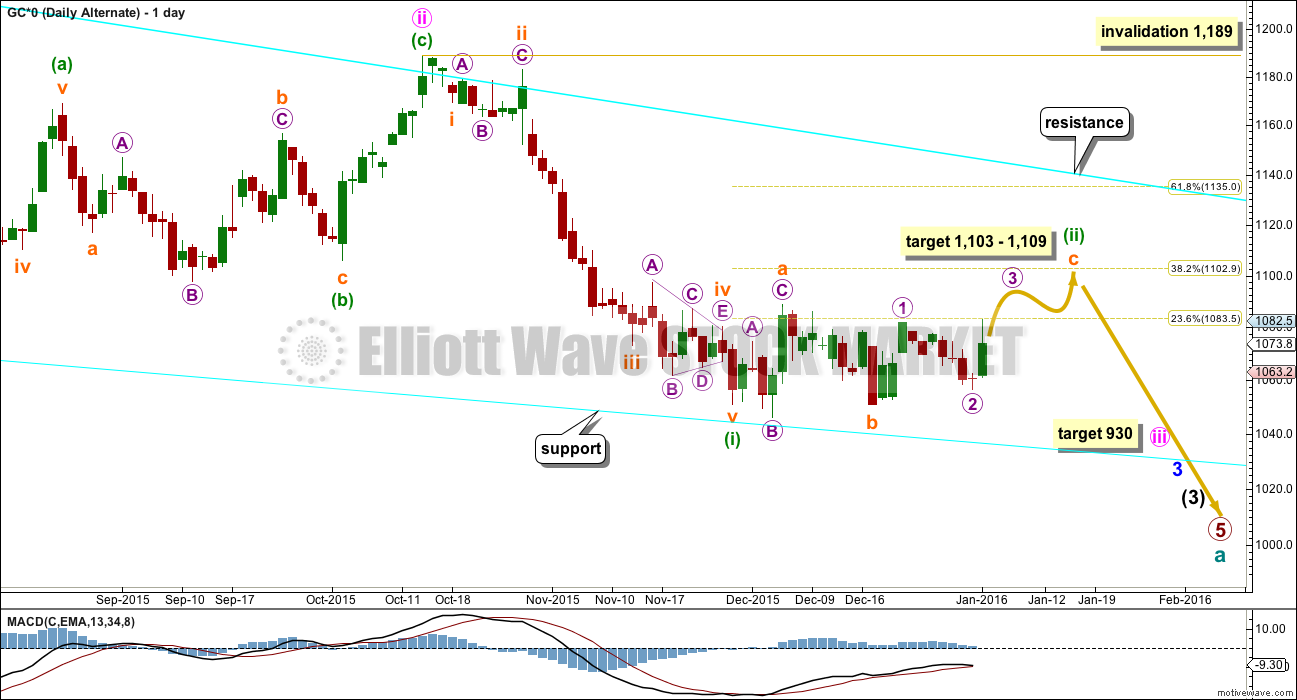
ALTERNATE DAILY WAVE COUNT
Click chart to enlarge.
This wave count is identical to the main daily wave count up to the low labelled minuette wave (i).
Thereafter, it looks at the possibility that minuette wave (ii) is unfolding as a flat correction. Within the flat, subminuette wave a is a three and subminuette wave b is a three and 1.06 the length of subminuette wave a. This would be an expanded flat correction.
At 1,109 subminuette wave c would reach 1.618 the length of subminuette wave a. This is somewhat close to the 0.382 Fibonacci ratio at 1,103 giving a $6 target zone.
Subminuette wave c must subdivide as a five wave structure.
This alternate expects a slower end to the correction of minuette wave (ii). So far it has lasted 25 days. If it exhibits a Fibonacci duration, it may continue for a further 9 days to total a Fibonacci 34.
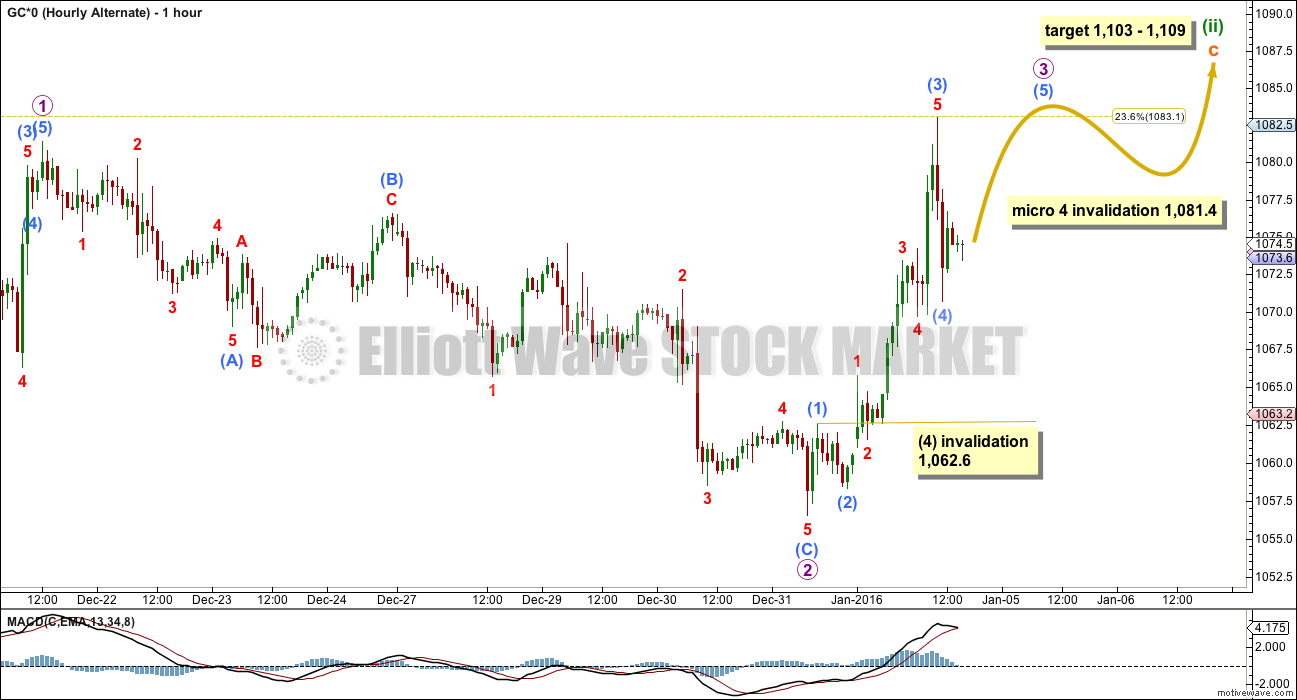
ALTERNATE HOURLY WAVE COUNT
Click chart to enlarge.
This alternate wave count follows on directly from the alternate in last analysis.
The structure of subminuette wave c is an incomplete impulse.
I would not consider labelling subminuette wave c over at the high labelled micro wave 1 because it would be truncated by 6.9. The truncation would be very large for this small correction and minuette wave (ii) would be a very rare running flat correction. The size of the truncation and the rarity of the structure make the probability of that idea very low indeed. What is much more likely is subminuette wave c would be incomplete.
Micro waves 1 and 2 are complete within subminuette wave c.
Micro wave 3 must move higher, high enough to allow room for downwards / sideways movement for micro wave 4 to unfold and remain above micro wave 1 price territory at 1,081.4.
If price makes a new high above today’s high, then both wave counts will remain valid. At that stage, the price point to differentiate the two would be 1,081.4. A new low below 1,081.4 would invalidate this alternate and confirm the main wave count.
In the short term, the idea is the same: both wave counts see an impulse unfolding upwards which requires a final fifth wave. The main wave count sees it as micro wave C and this alternate sees it as micro wave 3. Within the impulse, submicro wave (4) may not move into submicro wave (1) price territory below 1,062.6.
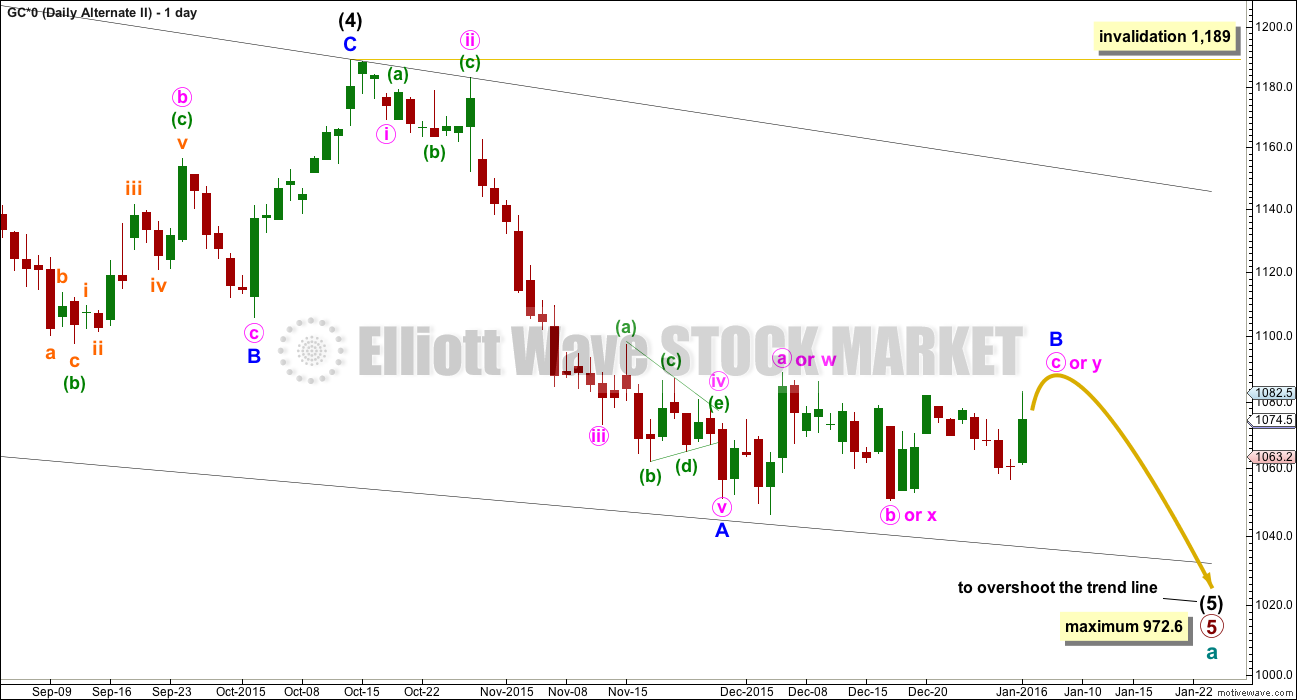
SECOND ALTERNATE ELLIOTT WAVE COUNT
Click chart to enlarge.
I am aware that this is the wave count which EWI and Danerics have. The implications are important, so I will follow this wave count daily for members here too.
Everything is the same up to the end of the triangle for primary wave 4 (see weekly charts for this larger structure). Thereafter, primary wave 5 is seen as an ending contracting diagonal.
Within the ending contracting diagonal, it is not possible to see intermediate wave (2) as a zigzag and meet all Elliott wave rules. To see an explanation of why see this video at 10:25.
The same problem exists for the ending diagonal of primary wave 5 itself. Intermediate wave (3) is longer than intermediate wave (1) which would suggest an expanding diagonal, but intermediate wave (4) is shorter than intermediate wave (2) and the trend lines converge which suggests a contracting diagonal.
From “Elliott Wave Principle” by Frost and Prechter, 10th edition, page 88: “In the contracting variety, wave 3 is always shorter than wave 1, wave 4 is always shorter than wave 2, and wave 5 is always shorter than wave 3. In the expanding variety, wave 3 is always longer than wave 1, wave 4 is always longer than wave 2, and wave 5 is always longer than wave 3.”
This structure violates the rules for both a contracting and expanding variety. If the rules in Frost and Prechter are accepted, then this is an invalid wave count.
It may be that the rules need to be rewritten to add “sometimes a third wave may be the longest within a contracting or expanding diagonal”. But I have never seen Robert Prechter publish such a rule, I do not know that it exists.
I cannot reconcile this wave count from EWI with the rules in Frost and Prechter.
If an ending contracting diagonal is unfolding, then the (1) – (3) trend line may be overshot signalling the end of intermediate wave (5). If price behaves thus and turns around and moves strongly higher, then this wave count must be accepted and the rules for diagonals will need to be rewritten.
I will continue to follow this possibility as price moves lower.
Intermediate wave (5) should be shorter than intermediate wave (1). At 972.6 intermediate wave (5) would reach equality in length with intermediate wave (1). A new low below this point would take this possible diagonal structure too far from the rules. At that stage, it really should be finally discarded.
All sub waves within ending diagonals must subdivide as zigzags. Within the zigzag of intermediate wave (5), minor wave B may either be an incomplete combination or flat correction as per the main and alternate hourly wave counts above. They work in exactly the same way for this alternate at the hourly chart level.
Minor wave B may not move beyond the start of minor wave A above 1,189.
For this ending diagonal idea, the final fifth wave of intermediate wave (5) should be expected to overshoot the (1)-(3) trend line, which is a very typical look for contracting diagonals. What that means is if price moves lower and it overshoots the lower black line (which is the same as the lower cyan line on the main wave count), then look out for a possible end to this bear market.
At that stage, any shorts should be carefully handled. Manage risk so that your account is not left exposed at that stage to a potential major trend change.
Minor wave B is incomplete at this stage. A final target for minor wave C may be calculated when minor wave B may again possibly be complete. That cannot be done today.
The same idea for Silver now works on COMEX data. An ending expanding diagonal, which meets all Elliott wave rules, may be close to completion for Silver. This adds slight support to this alternate idea for Gold.
TECHNICAL ANALYSIS
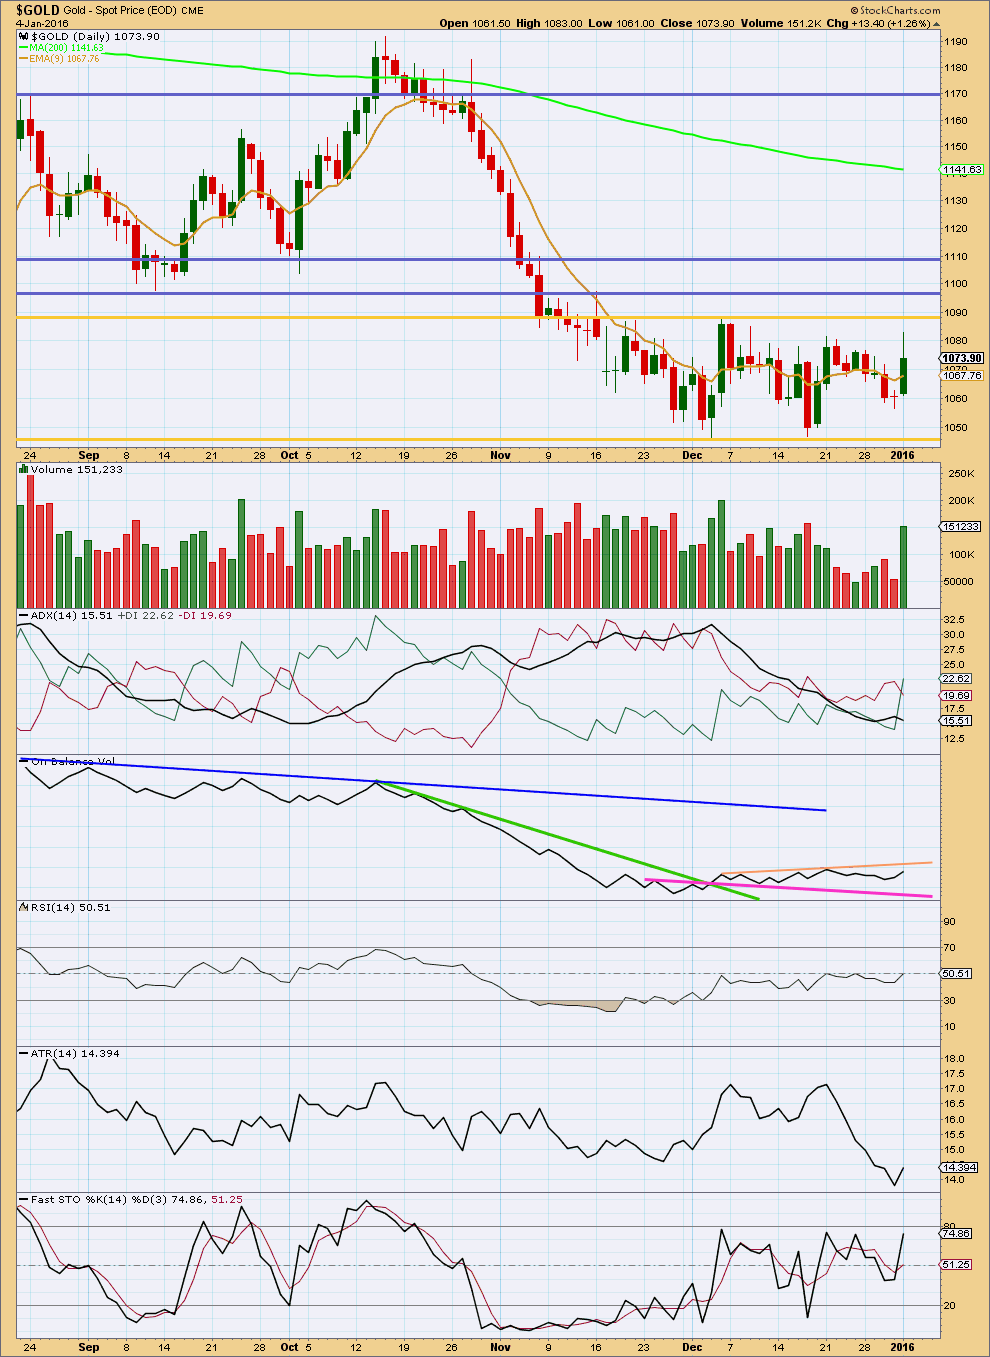
Click chart to enlarge. Chart courtesy of StockCharts.com.
Monday’s upwards day came on an increase in volume, but volume overall during the consolidation is still low. The rise in price for Monday was supported by volume. However, while price reached a new high above the prior high on 21st December On Balance Volume did not. OBV has slight divergence with price today.
If the first day of the consolidation is considered (4th December), then the strongest volume during the consolidation is for an upwards day. This would suggest that an upwards breakout is more likely than downwards.
Of more recent days, the downwards day of 17th December was the strongest.
Today ADX is declining indicating no clear trend. The -DX and +DX lines crossed today which may indicate a possible trend change from down to up, but this is unconfirmed.
ATR shows an increase today which may possibly be the start of a new trend.
On Balance Volume works best with trend lines. The bottom line to this classic technical analysis is price (and OBV) remains range bound. We need to be patient and wait for a breakout. The Elliott wave analysis expects the breakout should be downwards, Gold remains in a bear market, but short term volume suggests the breakout may be upwards.
We need to see price break either above or below the Gold trend lines which delineate this consolidation.
On Balance Volume may be a leading indicator of the breakout direction. If OBV breaks above its peach line, then expect an upwards breakout from price. If OBV breaks below the pink line, then expect a downwards breakout from price.
This analysis is published @ 04:47 p.m. EST.
Analysis updated 5 January, 2016 @ 01:08 a.m. EST.
Glad you are “back”Lara. Just wondering whether you might have any clue from todays action in gold so far as to whether we are in an extended move to 1102 or a short move to 1088 to 1090? Also , where are you in Australia?. I have 4 cousins in Sydney. They are grandsons of my great uncle EMIL PAYER who was a lion,tiger and leopard tamer with the Wirth Brothers Circus in the 1920′ and 1930 era, in Australia.
I’m New Zealand, not Australia. In Northland to be precise.
So far it looks like a fourth wave triangle is unfolding, and it may be complete. The breakout (if I’m right) should be a short sharp upwards thrust.
And then it should be all over for this correction. Finally. Most likely.
That is my expectation.
Thank you Lara. N.Z is a beautiful country. I want to congratulate you on your work on Crude Oil it has been outstanding. In late June of 2014 I bought 260 shares of SCO (Short Bloomberg Crude oil) at $54 and sold them at $137 in late August. Bought more SCO at $78 ,now at $137 again and going to $215 or more, as crude drops to $26 per barrel. You are amazing!!
You’re most welcome!
Regular technical analysis now updated.
Long 1/3 NUGT pre market and 1/3 GDX march options this morning. These are small positions and I am willing to lose it all. We are 11 weeks into the current trend on my COT analysis, the internals of my data show the blue line will turn up on the 1/8 report. Will post image later. I am in the second alternate camp.
You mean 1/9 report Friday?????
Where I live, Friday is the 8th.
My mistake !!!LOL!!!
lol…been there myself!
Updated chart attached.
where was the other third of your invested this AM?
Ok, I wasn’t clear. I have 1/3 of a NUGT position purchased, with potential to pick up 2/3 more. I have 1/3 of a GDX call position purchased, with potential to pick up 2/3 more (which I may funnel into GLD calls, but maybe not).
I picked up 135 shares of NUGT at 25.30 in premarket. I saw Gold breaking the channel and GDX had not responded yet. Unfortunately, I couldn’t get the GDX options at that time, and so when GDX pulled back to 13.93 area mid morning, I picked up five GDX March 18 $12 strike calls for $2.37.
If the second alternate does not play out, I will sell out of these positions and buy back in lower, but I am trading the second alternate.
Welcome back Lara.
Thanks!
Welcome back Lara. We missed your guidance!
Thank you!
I did need the break though.
Gold COT:
Both Gold and Silver Commercials became 1% more bullish last week. I think the relatively bullish position of the Commercials over the last 5 weeks set the stage for this final up move of the correction.
Silver COT: