
The short term target for some more upwards movement at 1,091 was reached and passed so far by 3.9.
Summary: The main Elliott wave count now expects downwards movement, but classic technical analysis remains bullish. It would be wise to wait for price to confirm a resumption of the downwards trend while these two views diverge. A new low below 1,056.5 is required for confidence that Gold will break out of this consolidation downwards and not upwards. The alternate wave count allows for more upwards movement while price remains above 1,056.5.
New updates to this analysis are in bold.
To see the last long term analysis with weekly charts click here.
MAIN ELLIOTT WAVE COUNT
Click chart to enlarge.
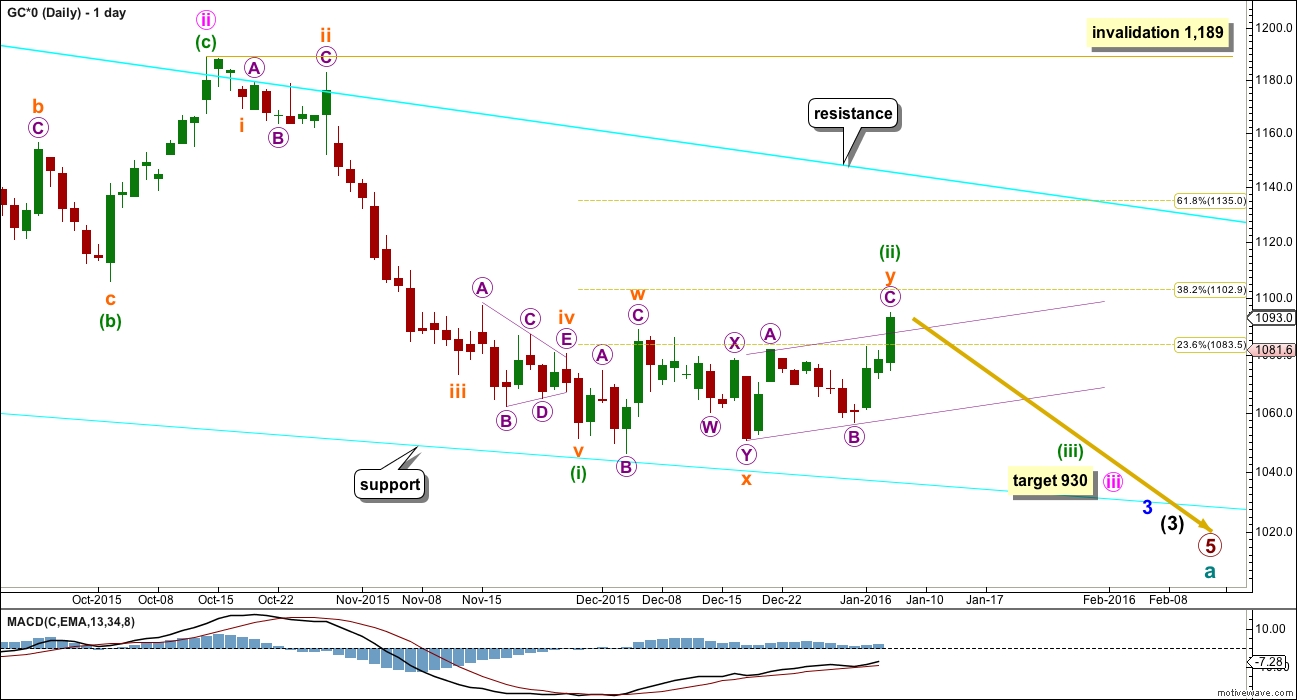
Gold has been in a bear market since September 2011. There has not yet been confirmation of a change from bear to bull, and so at this stage any bull wave count would be trying to pick a low which is not advised. Price remains below the 200 day moving average and below the cyan trend line. The bear market should be expected to be intact until we have technical confirmation of a big trend change.
The final line of resistance (cyan line copied over from weekly charts) is only overshot and not so far properly breached. Simple is best, and the simplest method to confirm a trend change is a trend line.
Minute wave ii is a complete zigzag and deep at 0.73 the length of minute wave i.
At 930 minute wave iii would reach 1.618 the length of minute wave i.
Minuette wave (i) is complete.
The main wave count today looks at the possibility that minuette wave (ii) is now a complete double combination: flat – X – zigzag. The structure of micro wave C within the zigzag is now complete at the hourly chart level. However, there is zero confirmation of a trend change at this stage. A new low below 1,056.5 would invalidate the alternate below and provide price confirmation that the upwards wave labelled subminuette wave y must be over.
MAIN HOURLY WAVE COUNT
Click chart to enlarge.
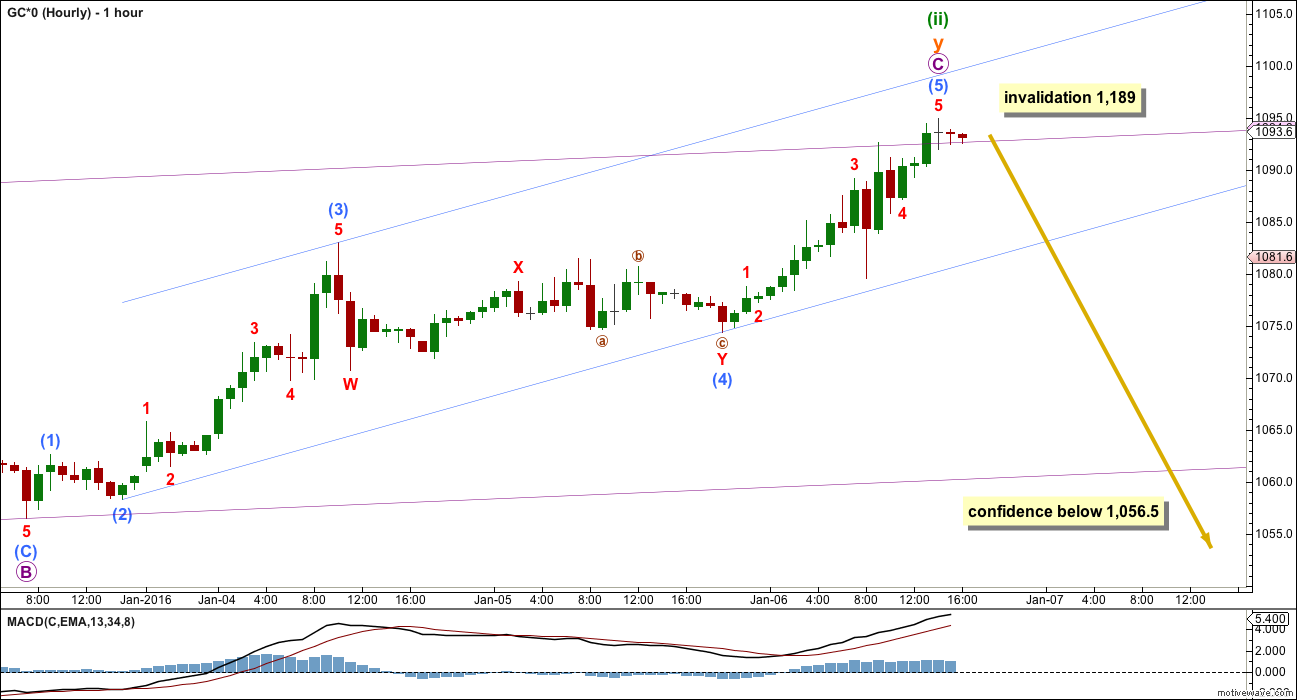
The triangle for submicro wave (4) did not complete and meet all Elliott wave rules for a contracting or barrier triangle because minuscule wave E moved slightly below the end of minuscule wave C. Submicro wave (4) morphed into a double combination: zigzag – X – flat. Thereafter, submicro wave (5) completed upwards.
Micro wave C is 3.8 longer than micro wave A. The difference is just less than 10% the length of micro wave C so far. If price does not move any higher, this would be an acceptable Fibonacci ratio.
Ratios within micro wave C are: submicro wave (3) is 1.14 short of 4.236 the length of submicro wave (1), and submicro wave (5) has no Fibonacci ratio to either of submicro waves (3) or (1).
Draw a channel about micro wave C using Elliott’s second technique: draw the first trend line from the ends of submicro waves (2) to (4) then place a parallel copy on the end of submicro wave (3). When this light blue channel is breached by downwards movement that shall be the earliest indication of a possible trend change.
Some further confidence in a trend change would come with a breach of the wider violet channel which is copied over from the daily chart.
Final confirmation and reasonable confidence may be had with a new low below 1,056.5.
ALTERNATE DAILY WAVE COUNT
Click chart to enlarge.
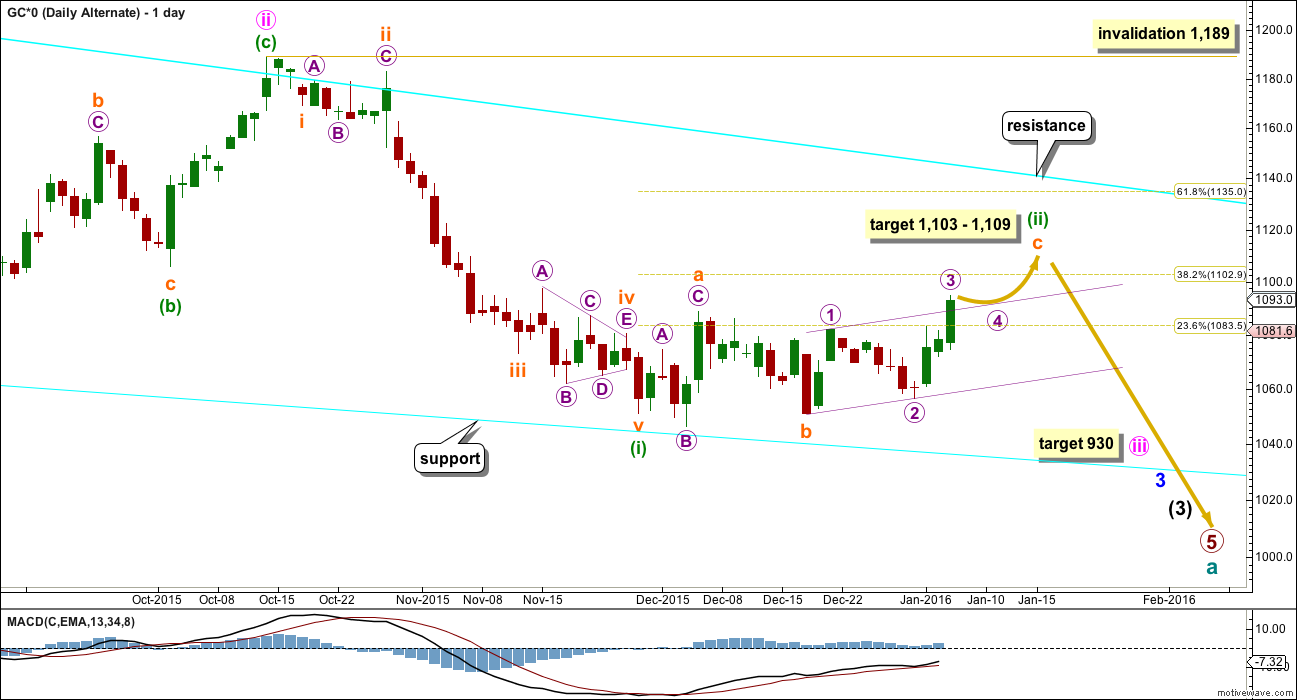
This wave count is identical to the main daily wave count up to the low labelled minuette wave (i).
Thereafter, it looks at the possibility that minuette wave (ii) is unfolding as a flat correction. Within the flat, subminuette wave a is a three and subminuette wave b is a three and 1.06 the length of subminuette wave a. This would be an expanded flat correction.
At 1,109 subminuette wave c would reach 1.618 the length of subminuette wave a. This is somewhat close to the 0.382 Fibonacci ratio at 1,103 giving a $6 target zone.
Subminuette wave c must subdivide as a five wave structure.
This alternate expects a slower end to the correction of minuette wave (ii). So far it has lasted 27 days. If it exhibits a Fibonacci duration, it may continue for a further 7 days to total a Fibonacci 34.
Subminuette wave c must subdivide as a five wave structure. It may be either an impulse or an ending diagonal. Both possibilities are considered below, the impulse first and the ending diagonal second.
ALTERNATE HOURLY WAVE COUNT I
Click chart to enlarge.
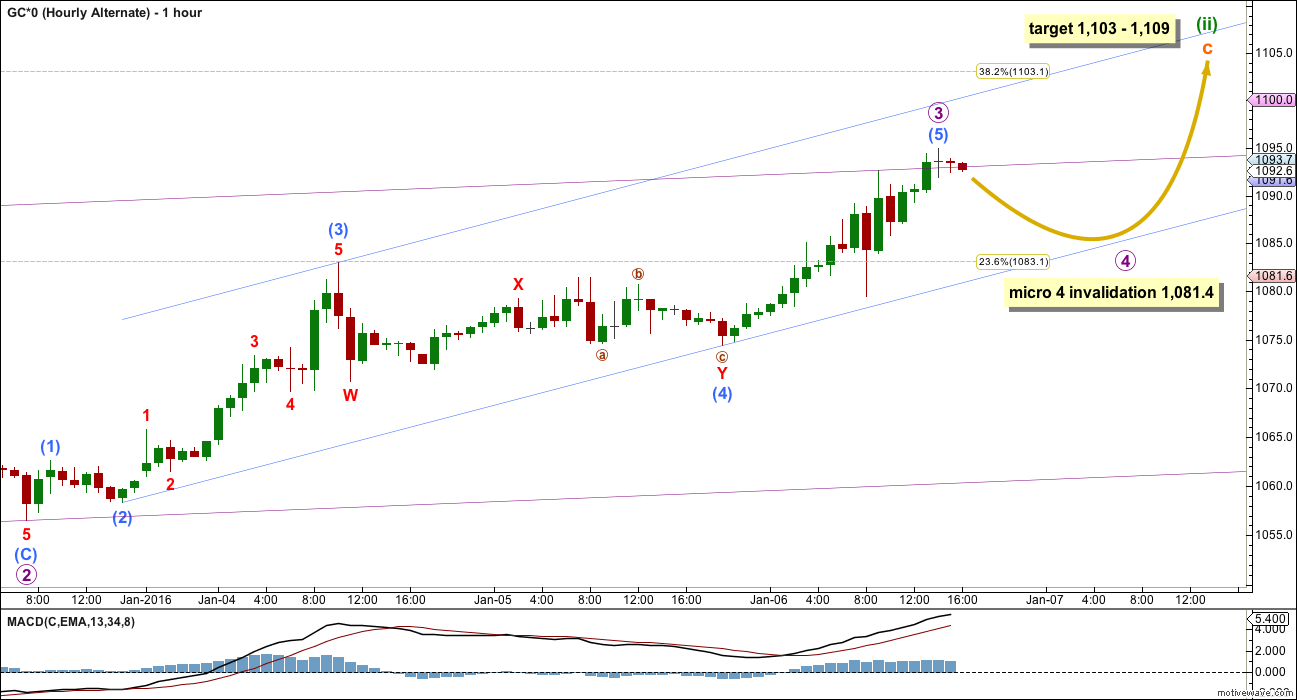
If subminuette wave c is an impulse, then within it micro wave 3 may be over here or it may continue yet further. If it does continue, then at 1,112 it would reach 1.618 the length of micro wave 1. At this stage, it is longer than equality with micro wave 1 and the structure on the five minute chart can be seen as complete, but there is zero evidence that it has finished.
It must be accepted that price could continue higher while price remains within the light blue channel.
Micro wave 3 would be confirmed as over when the light blue channel is breached. At that stage, micro wave 4 should unfold over a few days as a shallow sideways correction. Micro wave 4 may not move into micro wave 1 price territory below 1,081.4.
ALTERNATE HOURLY WAVE COUNT II
Click chart to enlarge.
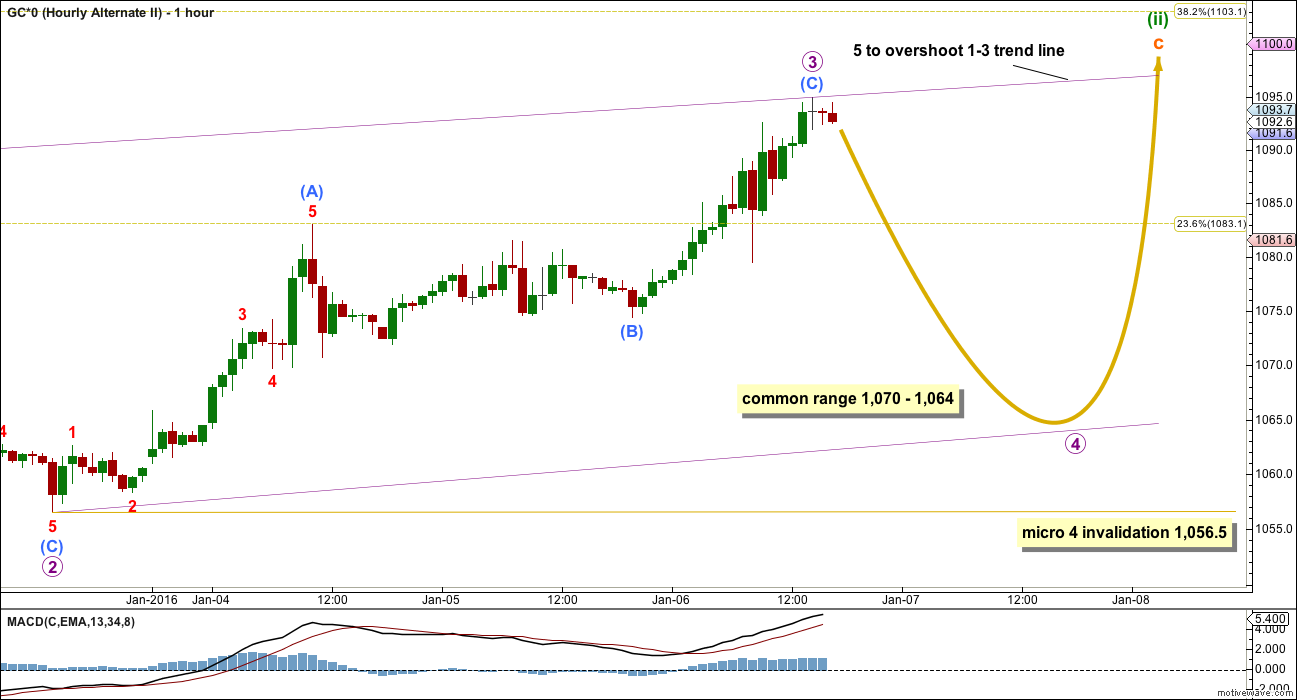
The other structural possibility of an ending diagonal for subminuette wave c must be considered.
An ending diagonal requires all sub waves to subdivide as zigzags. Micro wave 3 does fit as a zigzag (as does micro wave 1) and it does have a suspiciously three wave look to it on the hourly chart.
Diagonals require the fourth wave to overlap back into first wave price territory. Micro wave 4 must move below 1,081.4.
Micro wave 3 is longer than micro wave 1, so the diagonal should be expanding. Micro wave 4 would have to move low enough, so that the trend lines of the diagonal diverge meeting the rule.
The common depth for second and fourth waves within diagonals is between 0.66 to 0.81 the first and third wave. This gives a range for micro wave 4 between 1,070 – 1,064.
The rule for the end of a fourth wave of a diagonal is it may not move beyond the end of the second wave. Micro wave 4 may not move below 1,056.5.
This structure must be considered because it is a viable possibility, and it provides the final confidence point for the main wave count. If price moves below 1,056.5, then subminuette wave c cannot be continuing and would have to be over.
SECOND ALTERNATE ELLIOTT WAVE COUNT
Click chart to enlarge.
I am aware that this is the wave count which EWI and Danerics have. The implications are important, so I will follow this wave count daily for members here too.
Everything is the same up to the end of the triangle for primary wave 4 (see weekly charts for this larger structure). Thereafter, primary wave 5 is seen as an ending contracting diagonal.
Within the ending contracting diagonal, it is not possible to see intermediate wave (2) as a zigzag and meet all Elliott wave rules. To see an explanation of why see this video at 10:25.
The same problem exists for the ending diagonal of primary wave 5 itself. Intermediate wave (3) is longer than intermediate wave (1) which would suggest an expanding diagonal, but intermediate wave (4) is shorter than intermediate wave (2) and the trend lines converge which suggests a contracting diagonal.
From “Elliott Wave Principle” by Frost and Prechter, 10th edition, page 88: “In the contracting variety, wave 3 is always shorter than wave 1, wave 4 is always shorter than wave 2, and wave 5 is always shorter than wave 3. In the expanding variety, wave 3 is always longer than wave 1, wave 4 is always longer than wave 2, and wave 5 is always longer than wave 3.”
This structure violates the rules for both a contracting and expanding variety. If the rules in Frost and Prechter are accepted, then this is an invalid wave count.
It may be that the rules need to be rewritten to add “sometimes a third wave may be the longest within a contracting or expanding diagonal”. But I have never seen Robert Prechter publish such a rule, I do not know that it exists.
I cannot reconcile this wave count from EWI with the rules in Frost and Prechter.
If an ending contracting diagonal is unfolding, then the (1) – (3) trend line may be overshot signalling the end of intermediate wave (5). If price behaves thus and turns around and moves strongly higher, then this wave count must be accepted and the rules for diagonals will need to be rewritten.
I will continue to follow this possibility as price moves lower.
Intermediate wave (5) should be shorter than intermediate wave (1). At 972.6 intermediate wave (5) would reach equality in length with intermediate wave (1). A new low below this point would take this possible diagonal structure too far from the rules. At that stage, it really should be finally discarded.
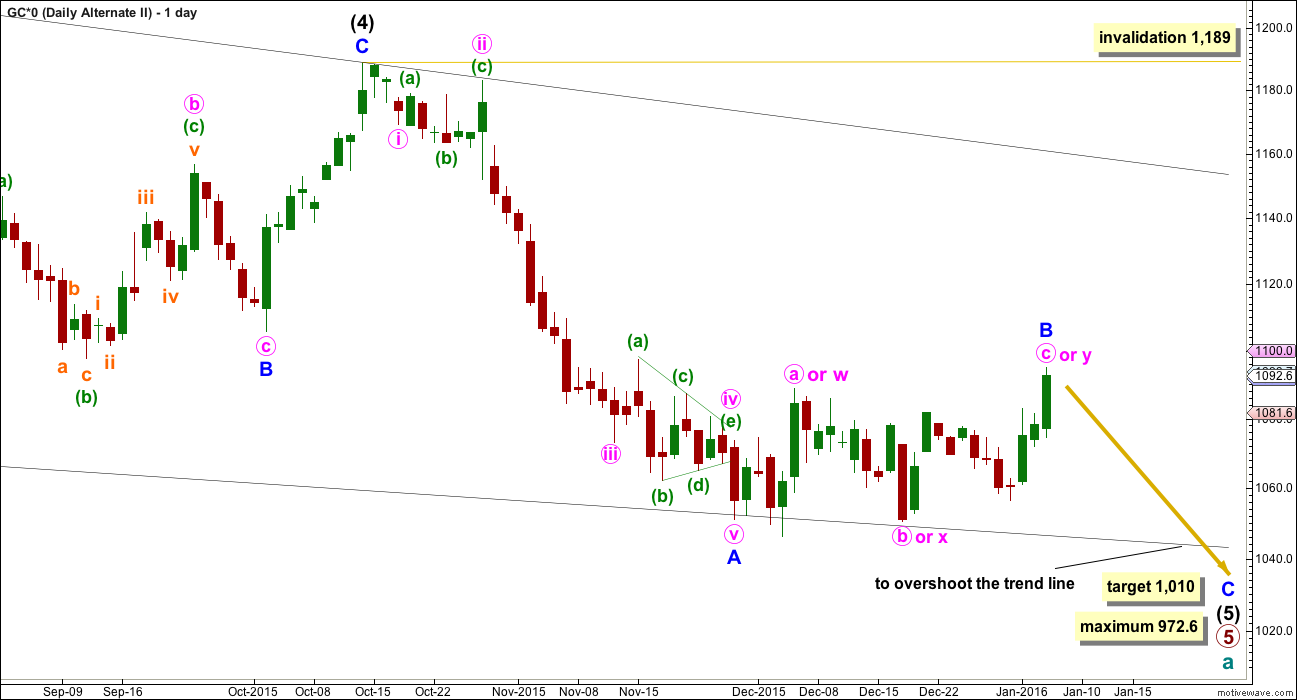
All sub waves within ending diagonals must subdivide as zigzags. Within the zigzag of intermediate wave (5), minor wave B may now be a complete double combination. It may also be an incomplete flat correction requiring more upwards movement. The alternate ideas for the main wave count work in exactly the same way for this daily chart.
If minor wave B is now over, then at 1,010 minor wave C would reach 0.618 the length of minor wave A. If minor wave B moves any higher, then this target must also move correspondingly higher. Confirmation of the end of minor wave B is still required for this alternate idea also, a new low below 1,056.5.
Minor wave B may not move beyond the start of minor wave A above 1,189.
For this ending diagonal idea, the final fifth wave of intermediate wave (5) should be expected to overshoot the (1)-(3) trend line, which is a very typical look for contracting diagonals. What that means is if price moves lower and it overshoots the lower black line (which is the same as the lower cyan line on the main wave count), then look out for a possible end to this bear market.
At that stage, any shorts should be carefully handled. Manage risk so that your account is not left exposed at that stage to a potential major trend change.
TECHNICAL ANALYSIS
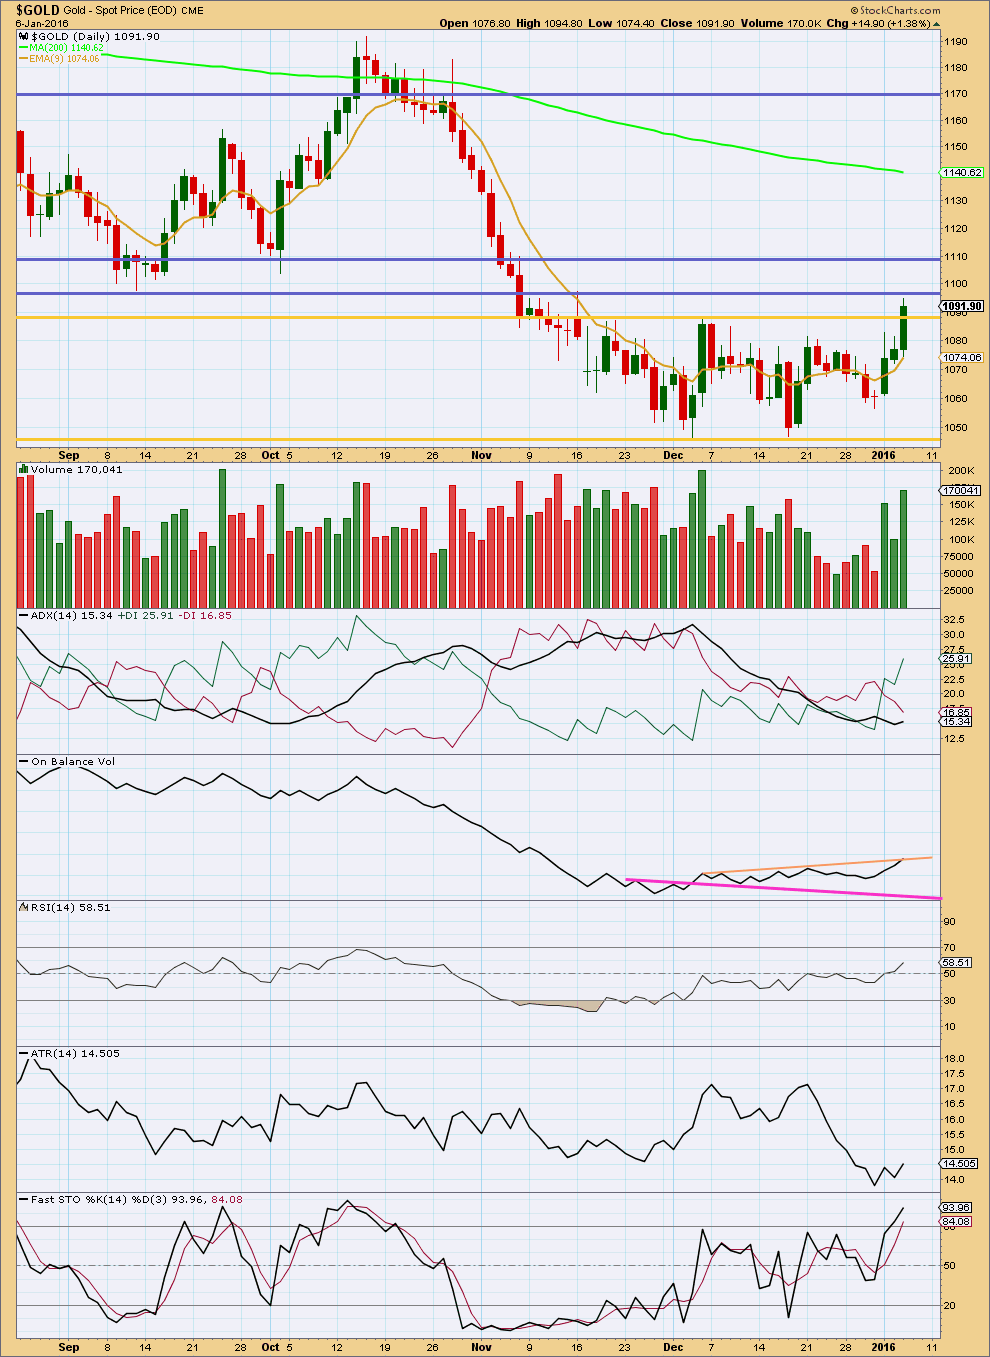
Click chart to enlarge. Chart courtesy of StockCharts.com.
Upwards movement for Wednesday comes with an increase in volume. The rise in price is well supported. Volume for Wednesday is stronger than all but one day during the consolidation. Volume for 4th of December, another upwards day, was stronger. Overall, it looks like an upwards breakout is underway. Price has closed above the upper line of resistance which delineates the consolidation and has done so with a volume spike.
The volume profile is bullish and does not support the Elliott wave count. For this reason today the Elliott wave count absolutely requires price confirmation before any confidence may be had in it.
Price is finding resistance about 1,094 – 1,098, a prior area of support (blue horizontal line). If price breaks above this line, then the next line of resistance is 1,109 – 1,110.
ADX is now turning upwards and is above 15. The +DX line is above the -DX line. ADX indicates there is an upwards trend.
ATR is beginning to agree and is overall moving higher.
Stochastics is reaching into overbought. If there is an upwards trend, then this oscillator can remain extreme for long periods of time. Only if it shows short term divergence with price would it be useful in a trending market to indicate a possible correction against the trend.
RSI is not overbought. There is room yet for price to rise further.
Overall, the classic technical analysis picture is much more bullish than bearish. This does not support the Elliott wave count. If the alternate Elliott wave count (the first hourly alternate particularly) is correct, then price may be expected to continue overall higher for a few days (with a fourth wave correction to move sideways along the way up). This may explain the bullish volume profile and may resolve the bullishness before price is ready for the resumption of a downwards trend.
If we see another upwards day with an increase in volume, then I would consider the possibility that the second daily alternate is correct and the bear market could possibly be over; intermediate wave (5) may have ended at the last low on 3rd December. There is not enough bullish confirmation for such a bullish wave count at this stage though for me to have enough confidence to publish the idea. It calls for a trend change at cycle degree.
This analysis is published @ 06:11 p.m. EST.
As per my comment in the next days analysis, the data I have been using for Gold and Silver since switching over to BarChart has been futures data, not the cash price.
I must apologise most sincerely to members for this. I did spend some considerable time with both MotiveWave and BarChart trying to find the right symbol. It does not come through in COMEX data with the same symbol as it shows on BarChart website.
The information I was given was wrong, and it was an intensely frustrating experience with a lack of co-ordination between BarChart and Motive Wave.
However, now I am much more confident I have it right. And I’ll be double checking with BarChart.
It makes a difference to the wave counts and it makes a big difference to Silver analysis, coming soon.
…. appears Gold price is headed for 1121+ with unlikely to drop below pivot for 1098….
SYED, not you too, it’s starting to get lonely over here at Bear camp!!
Well I think this is more like a Bull trap.. expecting Gold price to top and would like to first see Gold price break past 1117-18….Downside break below 1098 for 1075 required… I am bear come on bears~!!
Gold only dropped $5 at 8:15 am Wed when best ADT job increase in a year was released then gold continued up from there.
With so much happening about China market crashing and triggering a shutdown perhaps even if jobs are strong Friday that may either have little effect or else might cap the gold correction perhaps at Lara’s 1113 target and start gold down again as long as China isn’t collapsing Friday am and the mid east/Korea isn’t having any new disasters which trigger the safe haven effect and people sell their stocks and gold goes up.
Yes I know it is all based as per EW on changes in bullish sentiment which moves gold too.
These may not be the safest nights to hold 3X ETFs overnight and may be better to intraday trade with the very best indicators and EW counts.
WEDNESDAY, JAN. 6
8:15 am ADP employment Dec. 257,000 actual– 211,000 previous
FRIDAY, JAN. 8
8:30 am Nonfarm payrolls Dec. 215,000 forecast 211,000 previous
Thanks for your input.
CNN money article by Matt Eagan “… The good news is that China held an emergency meeting on Thursday and decided to suspend the circuit breakers effective Friday….
Peter Boockvar, chief market analyst at The Lindsey Group… “People now don’t have that same deadline to sell…but China’s stock market is going to go where it’s going to go,”
And for certain- the number of variables in the entire market equation is swooning my fog brain right now- which I’m sure is what all the sharp computer wheeling financiers are counting on. Good luck tomorrow!
Wonder if stock market margin calls will require them to sell something else?
Update – up 18% on NUGT 2/3 position and up 25% on GDX March calls 2/3 position.
So far so good.
A target for this upwards move to end is at 1,113
Non Farm Payroll release tomorrow am.
Richard, with Lara’s comment on a bullish breakout, curious what are your thoughts on how USD/gold will react tomorrow?
The volume profile was correct. This is a bullish breakout.
I will have two ideas at the daily chart level today. Both require more upwards movement overall, with a fourth wave correction along the way.
This is either the end of micro wave 3 within an impulse for subminuette c upwards. Which means micro 4 must unfold sideways and remain above 1,081.57 to stay above wave 1 price territory, then more upwards movement for micro 2.
OR
I will have a bullish wave count which sees the ending diagonal complete BUT it comes with the very VERY strong caveat that it calls for a multi year cycle degree trend change, which remains unconfirmed.
The main wave count will see this upwards move as the end of a C wave to complete an expanded flat correction. And then a resumption of the downwards trend.
Awesome. Thanks Lara.
Lara, just as an option to watch, can you give us a bull count? Is it possible the ending diagonal is complete?
That will be my bullish wave count.
But it would be calling for a trend change at cycle degree. To have any confidence in that idea it absolutely requires price confirmation. That’s a multi year trend change, a call for the bear market of the last 4.5 years to be over.
I’ve been there before; Gold goes up for a few days and members demand a bullish wave count. I developed three. One by one they were all invalidated.
And what that meant for the last drop down was there was a level of doubt on the bear wave count. Even though I pointed out the bear market should be assumed to remain intact until proven otherwise, having bull wave counts meant many members missed the last drop down to new lows as the bull wave counts were valid when that move began.
I do not think that is a good way to manage this analysis.
I will look at a bullish alternate. But I will try to present it differently next time.
I HAD SOME NICE PROFIT THIS am being on the long side of Gold, BUT they have all been disappated as I have gone short ,then long again then short as gold moves between 1101 and 1107 , NOW out ! As I have no clue whether we may have bottomed a the 1040 area a few weeks ago or not, but this sure is behaving like a bull since the double bottom in December in the 1040,s. LARA HELP!!!
Hi stephen: Just a View: I would not Buy with price above the upper band, however, Gold price coasting above 1105 opens up 1113 subject to if can break through 100dma at 1111… Its a risk Buy with SL at 1100-1099….Expecting Gold price to top, lets see…. Good luck~!
Possible pullback in NUGT coming. Chart by EagleSegal.
Thanks Lara for excellent analysis.
SPX EW analysis:
Lara’s Elliott wave target from Dec 15 2015 report on SPX has hit the short term target 1934. long term target is 1850:
——————————————————————————–
Dec 15 2015:
“Summary: A third wave down is underway and the structure remains incomplete. I expect a further increase in downwards momentum. The target remains at 1,850, with the short term target now at 1,934.”
How long term is $1,850?
Always bear market price goes down pretty fast. That is the norm.
2015 Was The Year Of Insanity In The Metals Market
Wednesday January 06, 2016 15:46
First published Sat Jan 2
Elliott Wave – Avi Gilburt
http://www.kitco.com/commentaries/2016-01-06/2015-Was-The-Year-Of-Insanity-In-The-Metals-Market.html
GDX to Gold ratio
GDXJ to GDX ratio
Thanks Dreamer….excellent canaries in the coal mine….
Both pointing down while GOLD is trying to base and break out.
Serious divergence here.
Of course if they break the down trend lines the BULL case has merit.
However…..
Silver stocks have also been leaders among the miners.
They have just made a new low VS the juniors….
try SIL:GDXJ
Yes, I see what you mean. $Silver:$Gold is very weak also. Until proven otherwise, this move up in Gold seems to be more short covering and safe haven buying due to world events than the start of a bigger bull move.
Wednesday 9:20 pm EST gold hit a high of 1,102.89.
Yes…. the 38.2 retracement of this down move comes in at 1101.67
on the investing.com gold chart….(vs 1102.50 top)
Do we
1 – blow through to 68.2% at 1135?
2 – bounce off 1102.89 to try another charge up and through with more momentum? or
3 – start W3 down in a real big hurry?…..hmmm
Here’s an entertaining video about the current state of the gold market (28min)
http://marketsanity.com/grant-williams-on-gold-nobody-cares/
Broke 1100 tonight….looking good so far.
Gold daily chart. If gold clears 1110 may be the target is 1140++.
OR it will follow Lara’s EW count??? Once below 1160.
I think you mean, or it will follow Lara’s count once below 1056.50 instead of 1160 (typo).
Lara, pretty good call on gold this year. Thanks.
So far so good. But with the volume profile looking mighty bullish today I’m not convinced the EW analysis is going to be on track at this time.
I really want to see a breakout from this consolidation zone. And I need to get working to find a possible bullish alternate.
But then we’ve been there before haven’t we. And I developed three bullish alternates. And one by one they were all invalidated.
The bottom line is Gold has been in a bear market since September 2011 and we have zero technical confirmation of a cycle degree trend change, an end to that bear market. Zero.
Any bull wave count at this point is calling a bottom, and as a trader that’s something I don’t do, and as an analyst if I start doing that I’ll be wrong more often than right. And that won’t help anyone.
Hi Lara…
Welcome back and best of the New Year to you and your crew…
Have you already considered and dismissed the Ending Diagonal shown below?
The difference is moving W4 back to just an ABC.
I believe that W1=258.5….and is greater than W3=224.90…
Waves 1, 3, and 5 would all be 3’s…
and there is a tiny overshoot at W5.
Hi Ted
Check out my post and Lara’s reply here.
http://elliottwavegold.com/2015/11/gold-elliott-wave-technical-analysis-25th-november-2015/
Thanks Johno.
The comment is right at the end of that post.
And it’s exactly what I’d say here.
Thanks Johno and Lara…..
TED
If you are proposing that gold has bottomed already!!! you may be correct.