
Price has broken out of a consolidation upwards.
Summary: Short term a third wave may end about 1,113 (if this target is wrong, it may not be high enough). Thereafter, a fourth wave correction should move sideways for a few days and be followed by more upwards movement for a fifth wave which may end about 1,135. At this stage, at least short term, the trend is up.
New updates to this analysis are in bold.
To see the last long term analysis with weekly charts click here.
Note: The data I was using from BarCharts was futures data and not cash data. Neither BarChart nor MotiveWave would / could provide me with the correct symbol for the COMEX cash data (the symbol used in MotiveWave is different to the symbol on the BarChart website). I have now found the correct symbol. The data points are slightly different which changes the invalidation points and targets slightly.
MAIN ELLIOTT WAVE COUNT

Click chart to enlarge.
Gold has been in a bear market since September 2011. There has not yet been confirmation of a change from bear to bull, and so at this stage any bull wave count would be trying to pick a low which is not advised. Price remains below the 200 day moving average and below the cyan trend line. The bear market should be expected to be intact until we have technical confirmation of a big trend change.
That technical confirmation would come with a breach of the upper cyan trend line by at least one full daily candlestick above and not touching the line. A new high above 1,191.37 would provide full and final price confirmation.
The final line of resistance (cyan line copied over from weekly charts) is only overshot and not so far properly breached. Simple is best, and the simplest method to confirm a trend change is a trend line.
Minute wave ii is a complete zigzag and deep at 0.73 the length of minute wave i.
At 941 minute wave iii would reach 1.618 the length of minute wave i.
Minuette wave (i) is complete.
Minuette wave (ii) is unlikely to be a double combination with this upwards movement of the last two days. It now looks more like a fairly typical expanded flat correction which may end about the 0.618 Fibonacci ratio at 1,135. I will discard the combination idea.
MAIN HOURLY WAVE COUNT
Click chart to enlarge.
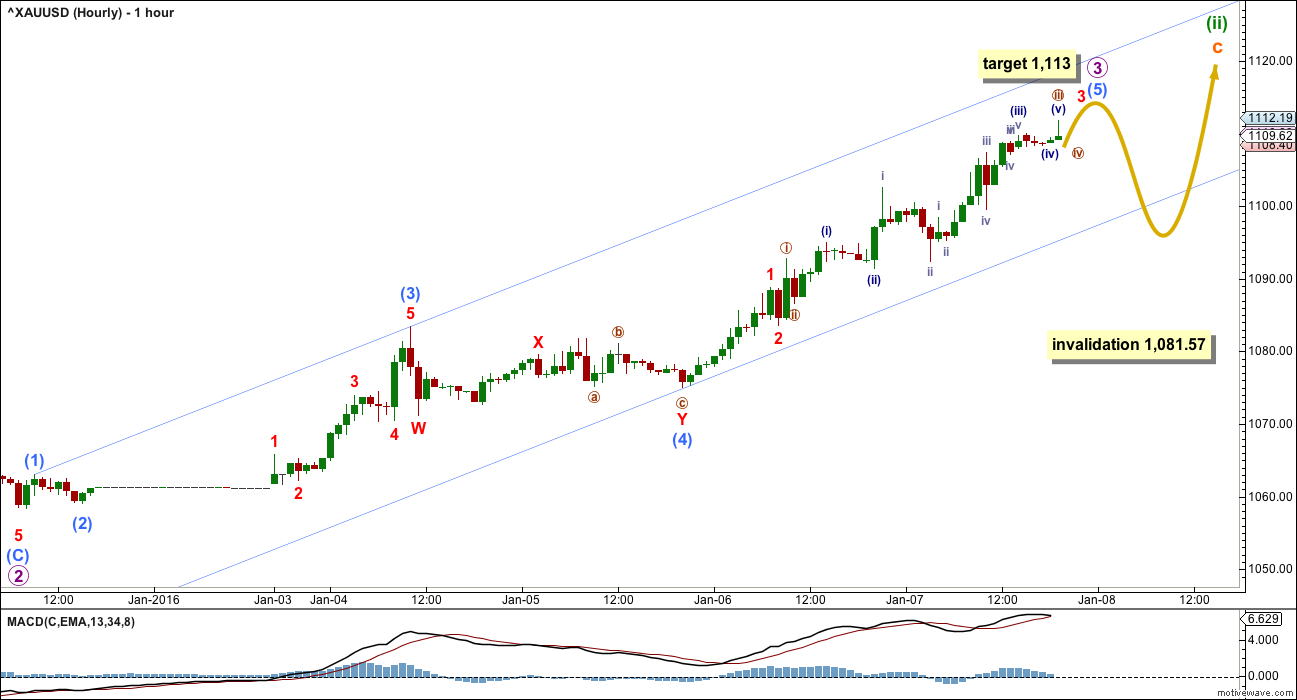
This third wave up for micro wave 3 may be ending with a typical extended fifth wave.
At 1,113 micro wave 3 would reach 1.618 the length of micro wave 1. If this target is wrong, it may be a little too low.
There is so much overlapping within micro wave 3 so far. Towards the end of this session, the middle of the third wave looks like it has just passed. A series of small fourth wave corrections should unfold along the way up to the short term target at 1,113.
Only when micro wave 3 is a complete five wave impulse should micro wave 4 unfold. Micro wave 2 was a deep 0.66 double zigzag correction. Given the guideline of alternation micro wave 4 should be expected to be shallow (against micro wave 3) and a sideways combination, flat or triangle. Micro wave 2 shows up on the daily chart lasting 6 days. Micro wave 4 should be expected to also show up on the daily chart and last about the same or similar duration, so that the impulse of subminuette wave c has the right look.
The light blue channel drawn about micro wave 3 is a best fit. When it is breached by downwards movement that shall provide a strong indication that micro wave 3 is over and micro wave 4 has begun sideways.
We may expect that price should overall continue higher while price remains within the channel and the structure of micro wave 3 is incomplete.
Micro wave 4 may not move into micro wave 1 price territory below 1,081.57.
ALTERNATE DAILY WAVE COUNT

Click chart to enlarge.
This was the second alternate yesterday. It is the first alternate today.
I am aware that this is the wave count which EWI and Danerics have. The implications are important, so I will follow this wave count daily for members here too.
Everything is the same up to the end of the triangle for primary wave 4 (see weekly charts for this larger structure). Thereafter, primary wave 5 is seen as an ending contracting diagonal.
Within the ending contracting diagonal, it is not possible to see intermediate wave (2) as a zigzag and meet all Elliott wave rules. To see an explanation of why see this video at 10:25.
The same problem exists for the ending diagonal of primary wave 5 itself. Intermediate wave (3) is longer than intermediate wave (1) which would suggest an expanding diagonal, but intermediate wave (4) is shorter than intermediate wave (2) and the trend lines converge which suggests a contracting diagonal.
From “Elliott Wave Principle” by Frost and Prechter, 10th edition, page 88: “In the contracting variety, wave 3 is always shorter than wave 1, wave 4 is always shorter than wave 2, and wave 5 is always shorter than wave 3. In the expanding variety, wave 3 is always longer than wave 1, wave 4 is always longer than wave 2, and wave 5 is always longer than wave 3.”
This structure violates the rules for both a contracting and expanding variety. If the rules in Frost and Prechter are accepted, then this is an invalid wave count.
It may be that the rules need to be rewritten to add “sometimes a third wave may be the longest within a contracting or expanding diagonal”. But I have never seen Robert Prechter publish such a rule, I do not know that it exists.
I cannot reconcile this wave count from EWI with the rules in Frost and Prechter.
Intermediate wave (5) should be shorter than intermediate wave (1). At 976.58 intermediate wave (5) would reach equality in length with intermediate wave (1). A new low below this point would take this possible diagonal structure too far from the rules. At that stage, it really should be finally discarded.
All sub waves within ending diagonals must subdivide as zigzags. Within the zigzag of intermediate wave (5), minor wave B may now be an incomplete flat correction requiring more upwards movement. Minute wave c must subdivide as a five wave structure in exactly the same way as subminuette wave c on the main daily chart.
Minor wave B may not move beyond the start of minor wave A above 1,189.
SECOND ALTERNATE DAILY WAVE COUNT
Click chart to enlarge.
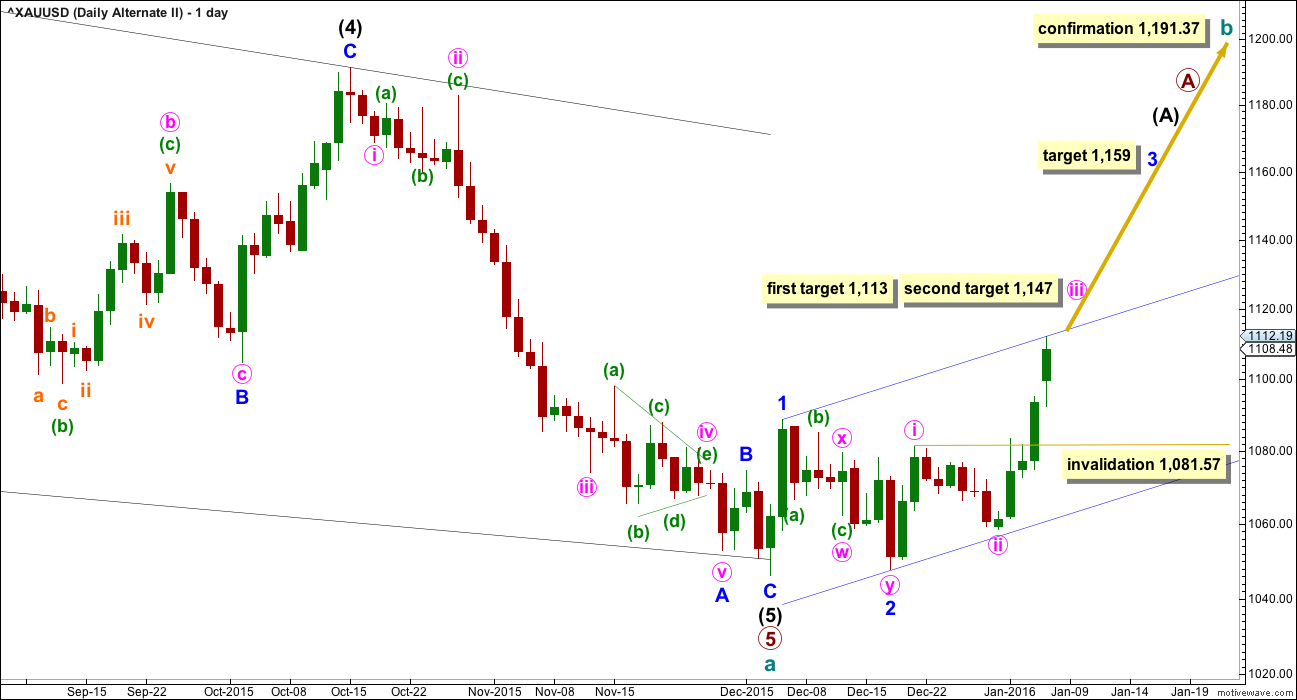
It is possible that the diagonal structure is over. It has the right look with a small overshoot of the (1)-(3) trend line.
Intermediate wave (3) is longer than intermediate wave (1), but intermediate wave (4) is shorter than intermediate wave (2) and the trend lines converge. This diagonal should be contracting. If this wave count is confirmed with a new high above 1,191.37, then the rules for diagonals would need to be rewritten to include “sometimes the third wave may be the longest of the actionary waves” for both contracting and expanding diagonals. All other rules should still be met.
If there has been a trend change at cycle degree at the last low, then it must be followed by a clear five up on the daily chart. So far minor waves 1 and 2 are complete. Minor wave 3 would reach 2.618 at 1,159.
Within minor wave 3, minute wave iii would have the same structure as the hourly chart but everything would be moved up three degrees. The target is also the same. At 1,113 minute wave iii would reach 1.618 the length of minute wave i. If price keeps rising through this first target, then the second target would be at the next Fibonacci ratio in the sequence. At 1,147 minute wave iii would reach 2.618 the length of minute wave i.
When minute wave iii is a completed five wave impulse, then minute wave iv should unfold sideways over a few days. It may not move into minute wave i price territory below 1,081.57.
In the short to mid term, this wave count and the main wave count do not diverge. All wave counts now expect overall upwards movement.
This alternate wave count is bullish at cycle degree. It calls for an end to the bull market which has lasted the last four and a half years. This is a huge call to make, and before any confidence can be had in a trend change of that size it absolutely requires price confirmation.
TECHNICAL ANALYSIS
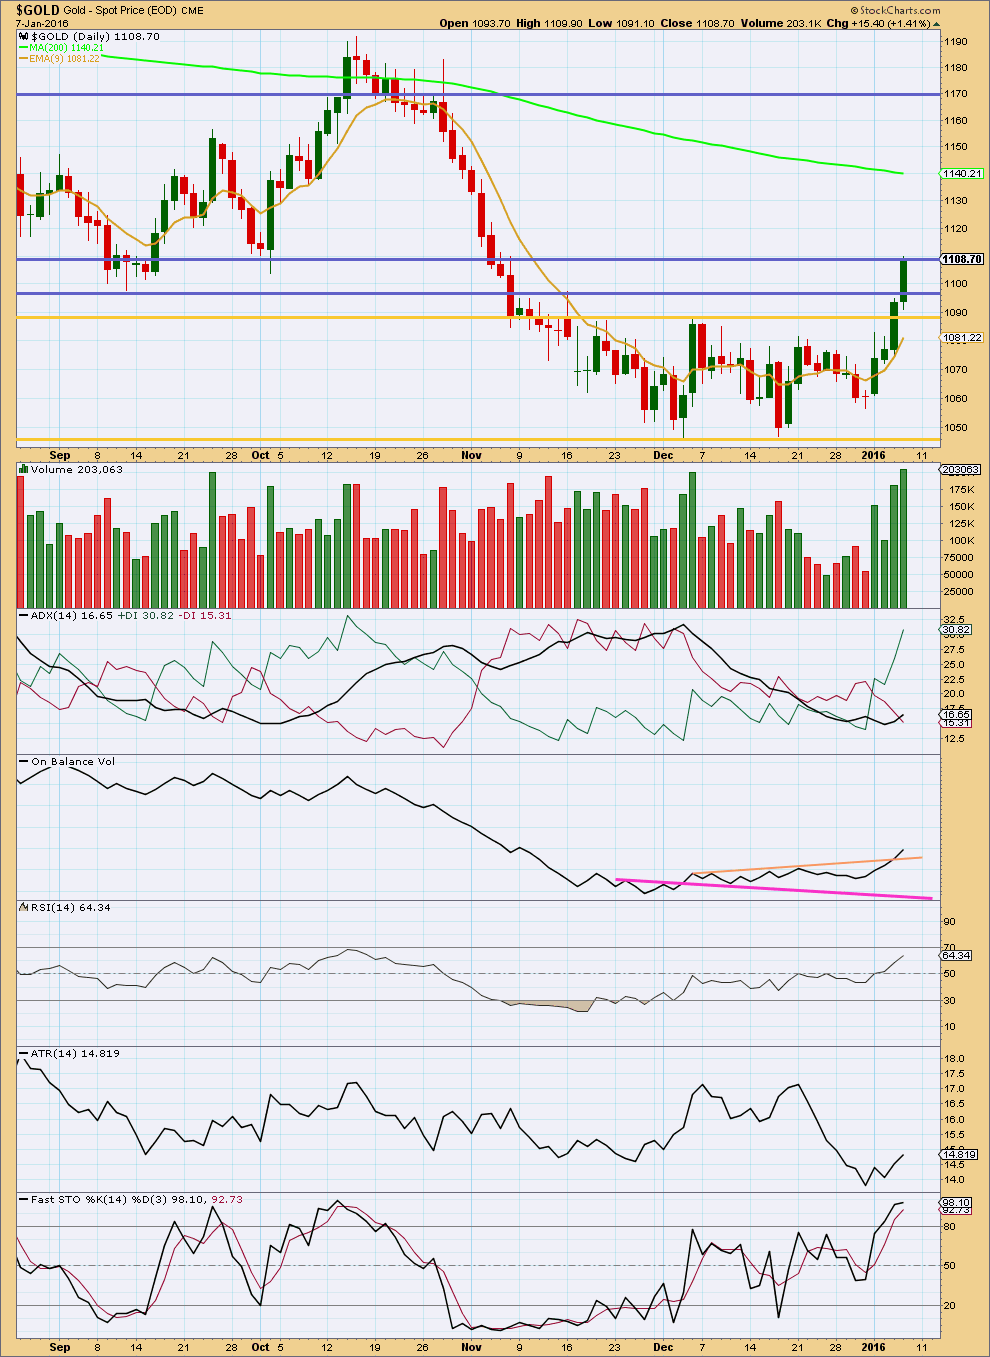
Click chart to enlarge. Chart courtesy of StockCharts.com.
Another strong upwards day comes with an increase in volume. The volume profile continues to be bullish.
ADX and ATR both agree that there is a trend. The trend is up.
On Balance Volume is more clearly bullish today with a break above the short peach trend line.
RSI is not yet overbought and shows no divergence from price. Upwards movement may be expected to continue. There is room for further rises in price.
Stochastics has reached overbought, but in a trending market this oscillator may remain extreme for long periods of time. The best use for this oscillator in a trending market is to look for short term divergence to indicate a potential correction against the trend. Today, there is no divergence between Stochastics and price, so a correction is not yet indicated to turn up.
Price may find some resistance about here at the blue horizontal trend line. If this line is breached, then it may be expected to provide some support for any corrections.
This analysis is published @ 08:36 p.m. EST.
Gold price appears to be encountering resistance under 1110, I would be looking for topping here and a break below 1096-90…. Lets see.
Updated Gold COT analysis. The next 3 weeks, the blue line is going to rocket up because of the large divergences from 8, 9, and 10 weeks ago. If you didn’t see, I went long 2/3’s position in NUGT avg. $26, 2/3’s position in GDX March $12 calls currently up 10%, and today I went long 1/3 position GLD March 107 calls, currently up 10%.
The blue line usually tops out after 10 weeks, which would put us in the Mid March time frame. Given the underlying COT data, I am expecting gold to move up for the next 2-3 weeks. I may choose to close my positions at that time instead of ride the whole 10 weeks.
Lots of time between now and then.
Good luck trading everyone, I had a great week short the QQQ’s, Long UVXY, long some miners, and also the positions above.
Have a great weekend,
M
The third wave ended and this downward day is day 1 of a fourth wave.
The 0.382 Fibonacci ratio is 1091 which is almost met already.
This fourth wave should be very choppy and overlapping. A nightmare to analyse and trade. Trading a correction requires a range bound trading system. Expect price to swing from resistance to support, and back again. Only for the most experienced of traders. It carries a much greater risk of losses than a trend following system.
Because this fourth wave correction may be an expanded flat (very common) or running triangle it may include a new high above the end of micro wave 3 at 1,112.19. A new high does not mean the correction is over, it would be very likely to be part of the correction.
2 lasted 6 days. So 4 may last a Fibonacci 5 or 8 days. If it is a combination or triangle which are particularly time consuming structures it may even last a Fibonacci 13 days.
At this stage that would be my expectation.
Last para above TA section.
Lara: Correction needed. ” It calls for an end to the bull market which has lasted the last four and a half years.”
You meant bear market?????
Oh goodness, Yes!
I meant bear market.
Sorry
I am a good student of yours. Thanks for great work!!!!
You’re welcome 🙂
Looking Good LARA, From Sunny- New London, Connecticut.
So far not too bad.
We got the upwards move we were expecting, although it moved higher than I expected.
And now we have a fourth wave correction showing up as expected.
And so if this all continues according to the wave count it should be followed by a fifth wave up, which may turn up as early as the end of next week.
Fifth waves can be very good moves for commodities. That one I may try to trade up myself. With the bullish alternate looking possible a buy at the end of this fourth wave may be a nice entry for me.
Lara please give us the sign to buy into the 5th wave as it sounds great!!!
Of course!
Gold dips from 9-week top as China sets yuan higher, stocks climb
2 Hours Ago
http://www.cnbc.com/2016/01/07/gold-firm-above-1100-as-china-jitters-prompt-safe-haven-bids.html
No where on your Jan 7th update does LARA show a sustained move down. Only to maybe 1097 or 1098 briefly today or into next Tuesday then all show a rise to 1135 or 1136. So of course I went long futures feeling I could sustain a TEMPORARY drop to 1097. But already we are at 1095. I was in fact ready to short gold last night but what do I do now?
I answered my own question by doubling up on Feb gold futures at 1096 50 area. Holding long for at least 1136 next week.
This correction should last several days and be shallow against the third wave, so maybe 0.382. That is about 1,091.
But it’s a correction. It’s a move against the trend. Generally not a good idea to trade in the direction against the trend. If you do then manage risk very carefully.
When I analyse a correction the wave count will change as it unfolds. Because there are 23 possible structures this fourth wave may take. So I will not be able to give you an accurate pathway of how price will move in the correction, my focus will be on figuring out when it is over and the trend is ready to resume.
Avi Gilburt EW – warned about an extended correction in his Saturday/Wed article
As long as the GDX remains below 13.90, we have an impulsive structure in place to head down below 12. While the set-up is not ideal, since it relies upon a leading diagonal down for wave (i), I still have to recognize the potential as long as we remain below 13.90.
“But, if we take out 13.90 resistance, then it opens the door to a more protracted corrective rally before the final lows are struck.”
http://www.kitco.com/commentaries/2016-01-06/2015-Was-The-Year-Of-Insanity-In-The-Metals-Market.html
Another look at the “zone” for this rally to end. Until proven otherwise, I’m in the camp that this is a bear market rally and I like the 1st alternate the best at the moment. It is however, good to see and follow the 2nd alternate because there are a lot of individual miners that are showing bullish signs. Thanks to Lara for adding it.
We did get an upwards break today in the GDX to Gold ratio. Supports the bull case.
Yet we have mixed signals. GDXJ was weaker than GDX. No support for the bull case today, but this could still break upwards from the triangle.
And then we have the Silver to Gold ratio. Silver has been very weak lately and so far this does not support the idea of a trend change in Gold.
I agree. SGR need to turn before PM bull begins. Out of three ratios only hold out is SGR. Other two ratios are XAU/GOLD and GOLD/CRB (REAL PRICE OF GOLD).
May be SGR is lagging.
Strong possibility that Miner bottom early and gold metal to bottom later. In 2011 Gold topped 3 months early than HUI.
Lara you mentioned, “The data points are slightly different which changes the invalidation points and targets slightly.”
So even though it might sound like a big deal when I read about the mix up with gold futures, cash price, Motivewave, Barchart and Comex, in fact the effects to your charts was “changes the invalidation points and targets slightly”, that is reassuring.
The data points are extremely similar. The charts of the futures data look very close indeed to the cash data.
With the huge number of symbols, all different between BarChart on their website and how the COMEX data comes through on MotiveWave, it’s an easy mistake to make.
And BarChart were totally and completely unhelpful. They simply did not give me the symbol for cash data. I had to search for it myself. They didn’t even give me any indication of what letter the symbol began with.
The wave count for Gold does not change at all.
But the alternate for Silver won’t work on the cash data.
The ending diagonal for Silver is just horrible. It violates Elliott wave rules.
I just cannot stress how much this problem has frustrated me. How on earth can I work if I don’t use the right data? And how on earth can I find what I’m paying for if they refuse to assist?
I am most unimpressed. And have to rework all my charts and calculations. What a waste of time.
To be honest, I just wish I’d stuck with FXCM data.
Anyhow, back to work. Silver is almost done.
Thanks Lara, for the great explanation.
By the way some traders use the wrong symbol for gold on stockcharts and use GLD instead even a top trader I knew did that.
I informed him that gold on stockcharts uses the symbol $GOLD and sent him the chart. He didn’t know about $GOLD.
http://stockcharts.com/h-sc/ui?s=%24GOLD
Thanks for that Richard. It’s a small relief to know I’m not alone.
After two weeks of side way action I am more convinced about COT data for trade in conjunction with EW counts.
Great call by MTLSD!!!
With gold latest move, now the trend and EW analysis is clearer. Your analysis is Spot on Lara, I think. Thanks.
I hope so. But don’t get too comfortable with that bullish wave count.
The same idea just won’t work for Silver cash data.
Thanks Lara for finding bull wave count. Second Alt suggests that cycle wave a is complete and gold is in beginning of corrective wave b.
I just cannot stress enough that the second alternate absolutely requires confirmation. It’s such a big trend change.
Do you remember when we were in this position last time?
I found three bullish wave counts.
And then Gold went to make new lows. And one by one they were all invalidated.
And what that did was really put us off while price fell that last time.
I just don’t want the same thing to happen again.
We know the trend will end and change to upwards again. But it is so important to be patient and wait for confirmation before having confidence that it has. That way we will only be wrong once, not often.
Yes, but if I recall correctly you also retained your bearish count all along then, without it invalidating. And sentiment indicators whether the FXCM SSI, DSI or even COT signaled bearish as toward the highs small traders were very long.
… it’s tricky business