
Last analysis expected a correction to complete with some upwards movement to a target at 14.695 – 14.855.
Price has moved higher so far reaching up to 14.832.
Summary: The correction is still incomplete and is taking its time. Short term more upwards movement is expected to a target at 15.01.
New updates to this analysis are in bold.
Note: Data used this week has been confirmed as Silver cash (spot) data from COMEX. Data used for last analysis was futures data, so the data points are slightly different. This changes Fibonacci ratio calculations, invalidation points slightly, and targets slightly. Most importantly for Silver the ending diagonal will no longer work for correct cash data.
MAIN WAVE COUNT
Click chart to enlarge.
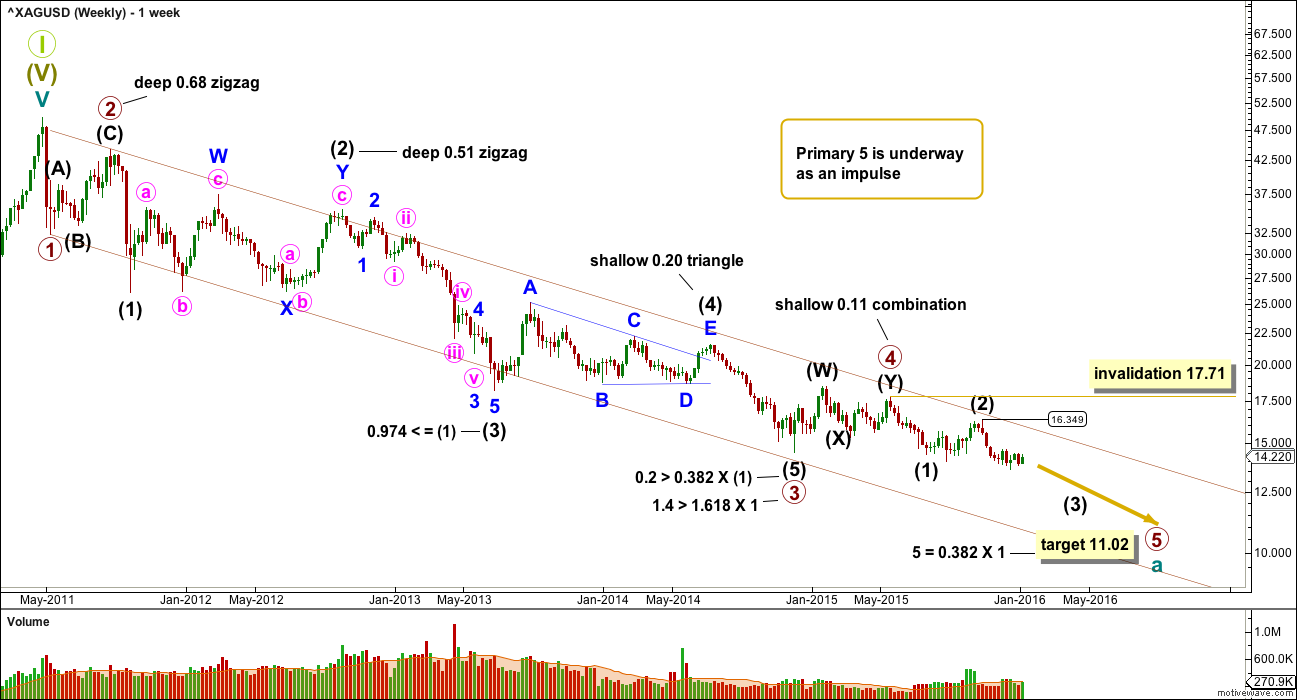
Primary wave 4 may be complete and primary wave 5 may be underway.
Primary waves 2 and 4 exhibit perfect alternation and good proportion: primary wave 2 was a deep zigzag lasting 15 weeks and primary wave 4 was a shallow combination lasting 24 weeks, 1.618 the duration of primary wave 2.
At 11.02 primary wave 5 would reach 0.382 the length of primary wave 1.
This wave count is preferred primarily for the reason that there has been no technical confirmation of a trend change from bear to bull for Silver.
Intermediate wave (2) may not move beyond the start of intermediate wave (1) above 17.71. A breach of this invalidation point would now also require a strong breach of the bear market channel, so this invalidation point should not be moved any higher. When that channel is breached that should indicate a trend change for Silver from bear to bull. At that stage, only bullish wave counts should be seriously considered.
Click chart to enlarge.
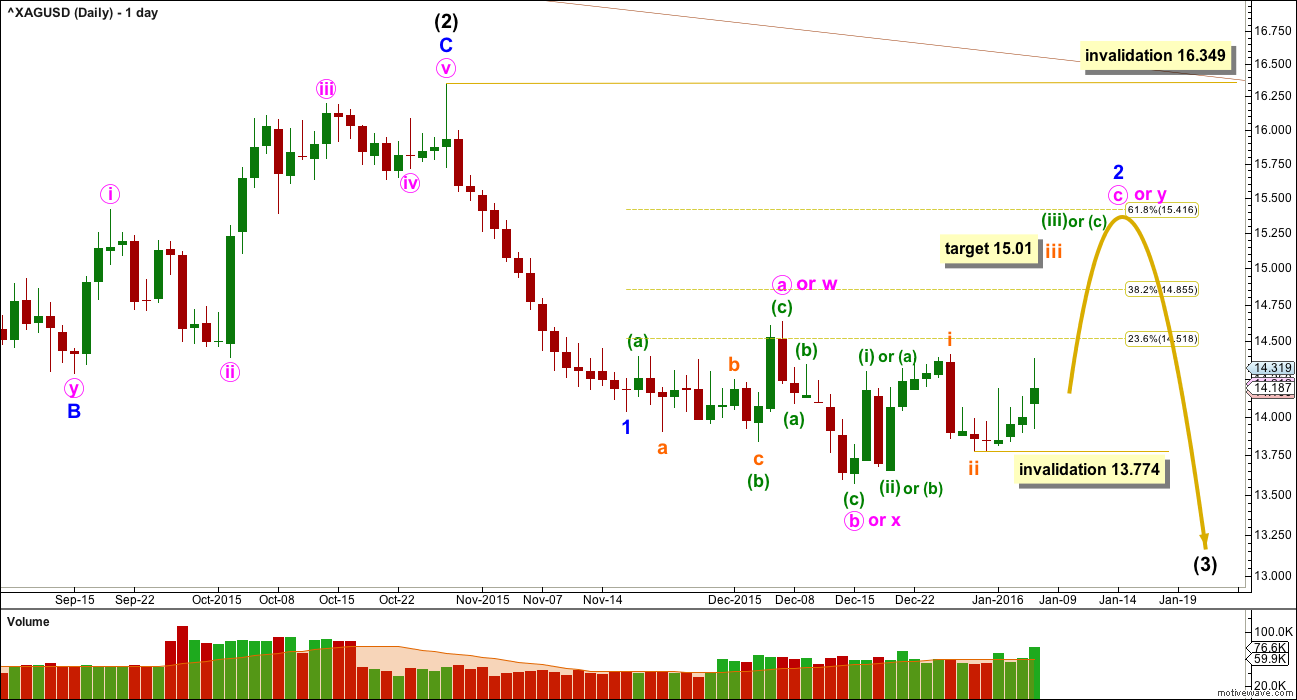
All wave counts at the daily chart level this week will show movement since the high at 16.349 on 28th October.
Choppy overlapping sideways movement fits the wave count. A second wave correction looks to most likely be incomplete for minor wave 2.
Minor wave 2 is most likely to be an expanded flat correction. Minute wave b is a 1.78 length of minute wave a. This is longer than the common range of up to 1.38, but less than the maximum convention of up to 2.
If minor wave 2 is a flat correction, then within it minute wave c must subdivide as a five wave impulse. So far there would be two overlapping first and second waves within it. This indicates an increase in upwards momentum as the middle of a third wave unfolds.
At 15.01 subminuette wave iii would reach 1.618 the length of subminuett wave i.
Minor wave 2 may also be a double combination: flat – X – zigzag. This idea would still require more upwards movement to complete the structure of minute wave y. Minute wave w would be an expanded flat. The double would be joined by a three in the opposite direction labelled minute wave x. Minute wave y may not be a second flat because within it the B wave would be less than 0.9 the length of the A wave, so minute wave y may only be a zigzag (or a triangle but at this stage that looks unlikely).
If minute wave y is a zigzag, then minuette waves (a) and (b) are complete and minuette wave (c) must unfold upwards as a five wave structure. The target for subminuette wave iii within it would be exactly the same at 15.01.
No second wave correction may move beyond its start below 13.774 within subminuette wave iii.
Subminuette wave iii must move above the end of subminuette wave i to a new high above 14.409. It must move far enough above this point to allow for a following fourth wave correction to unfold and remain above first wave price territory.
ALTERNATE WAVE COUNT
Click chart to enlarge.
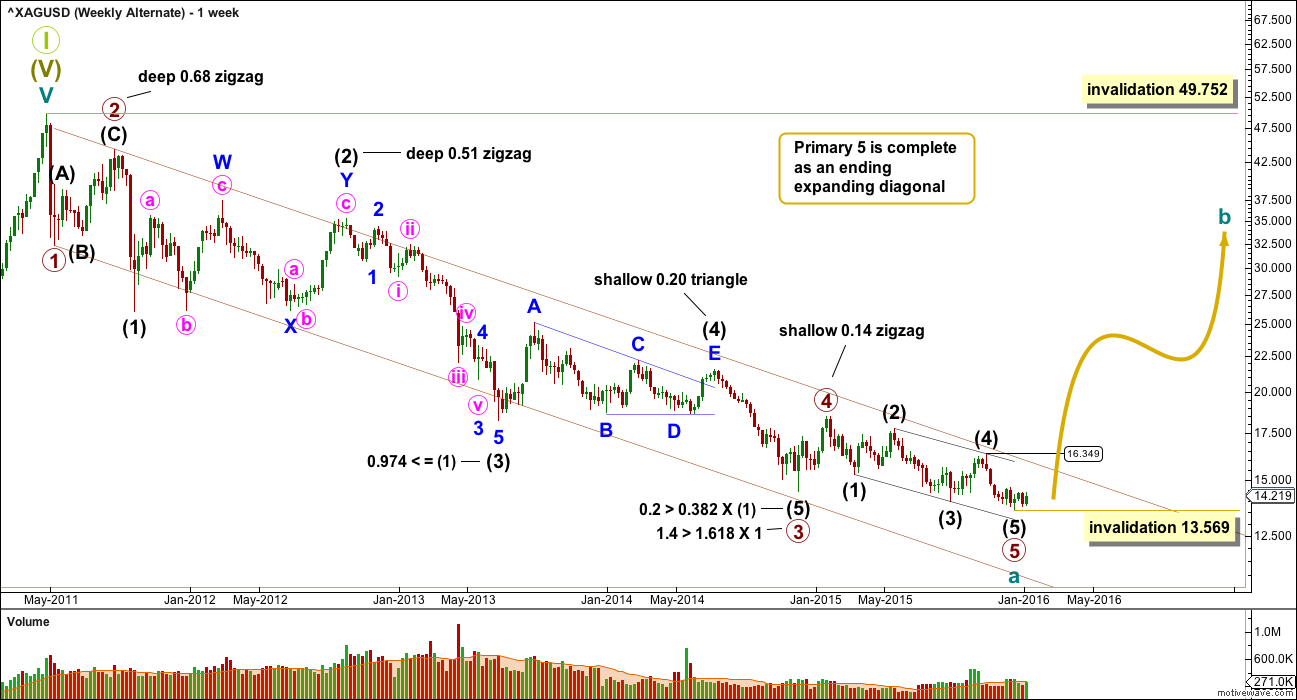
This second alternate wave count is identical to the first main wave count up to the low labelled primary wave 3. It sees primary wave 5 as complete. There are only two possible structures for a fifth wave within an impulse: either an impulse (main wave count) or an ending diagonal (this alternate wave count).
All the sub waves must subdivide as zigzags within an ending diagonal. The fourth wave should overlap back into first wave price territory and may not move beyond the end of the second wave.
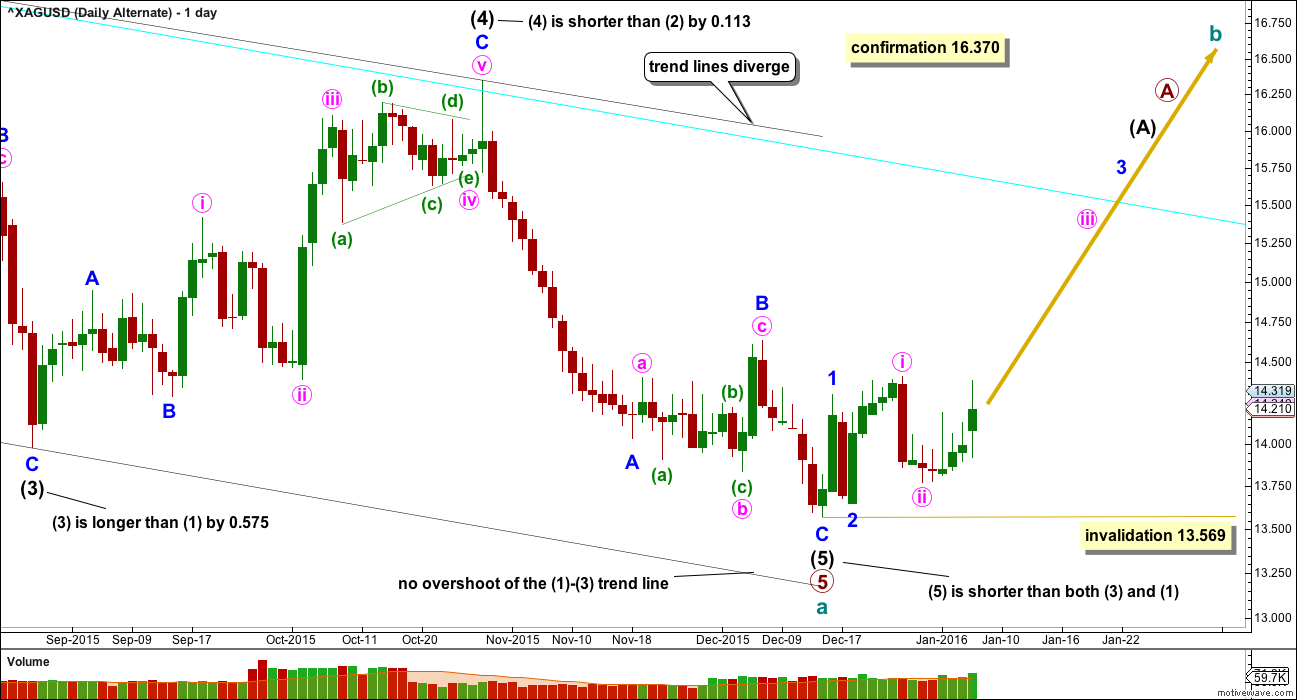
Intermediate wave (1) is now 3.183 in length, intermediate wave (2) is 2.485 in length, intermediate wave (3) is longer than intermediate wave (1) at 3.784 in length, and intermediate wave (4) is shorter than intermediate wave (2) at 2.372 in length. The rules for wave lengths of a contracting nor expanding diagonal are not met. The trend lines slightly diverge.
Click chart to enlarge.
The diagonal will not work with cash (spot) data (although the diagonal worked with futures data). It is the cash market which should lend itself to better Elliott wave analysis because it has less extreme leverage and has greater volume (even COMEX cash data). Markets require sufficient volume for Elliott wave analysis; the greater the volume the better the analysis.
The diagonal is neither expanding nor contracting. Intermediate wave (3) is longer than intermediate wave (1), but intermediate wave (4) is shorter than intermediate wave (2). The trend lines slightly diverge indicating an expanding diagonal.
If the diagonal is complete, then it violates the rules for both a contracting or expanding variety. Even a rewriting of the rules to include “sometimes the third wave may be the longest of the actionary waves” would still see this example violate the rule of trend lines. They should converge for a contracting diagonal, but they do not.
I can no longer have any confidence in this wave count with the violation of the rules. It should not be used.
Over the next few days I will take the time to look for a bullish alternate wave count for Silver which does not violate Elliott wave rules. If I find it, I will publish it as an update.
TECHNICAL ANALYSIS
WEEKLY CHART
Click chart to enlarge. Chart courtesy of StockCharts.com.
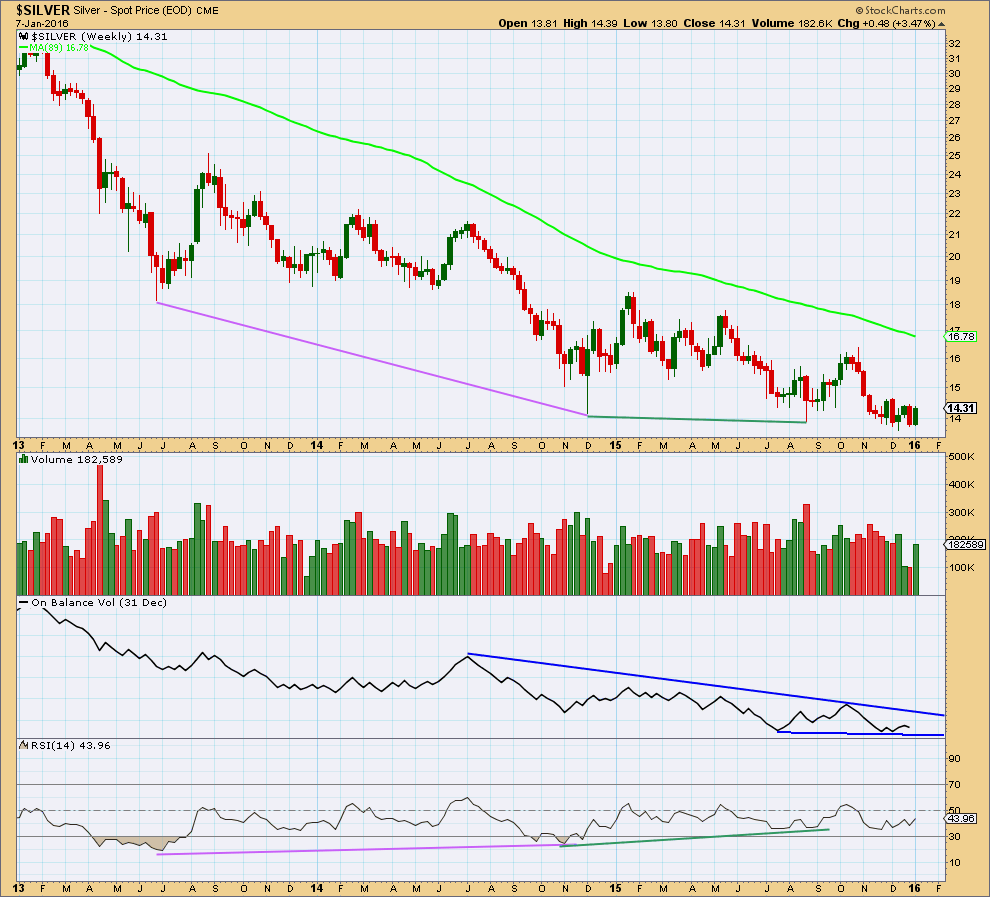
Silver has been in a bear market since April 2011. I am adjusting the length of the weekly moving average, so that it shows where this bear market has been finding resistance. The 89 week (a Fibonacci number) Simple Moving Average works well for this bear market. If that is breached by a weekly candlestick, it would be strong indication that Silver has changed from bear to bull.
Of recent weeks, strongest volume is for a downwards week. This is bearish. The last four completed weeks of overall downwards movement have come with declining volume. This indicates there is weakness in downwards price movement.
On Balance Volume remains below a long held trend line. While OBV remains below that trend line it will remain bearish.
Although RSI shows strong double divergence with price at two of the last three important lows (pink and green lines on price and RSI), this has been followed by yet another low in price which does not diverge from RSI as that too made a new low. The divergence between price and RSI is not proving to be an accurate indicator of a major trend change in this instance, so far.
The bear market will end, but it must be confirmed by price. A break above the 89 week moving average and / or the blue trend line on price is required for confirmation.
DAILY CHART
Click chart to enlarge. Chart courtesy of StockCharts.com.
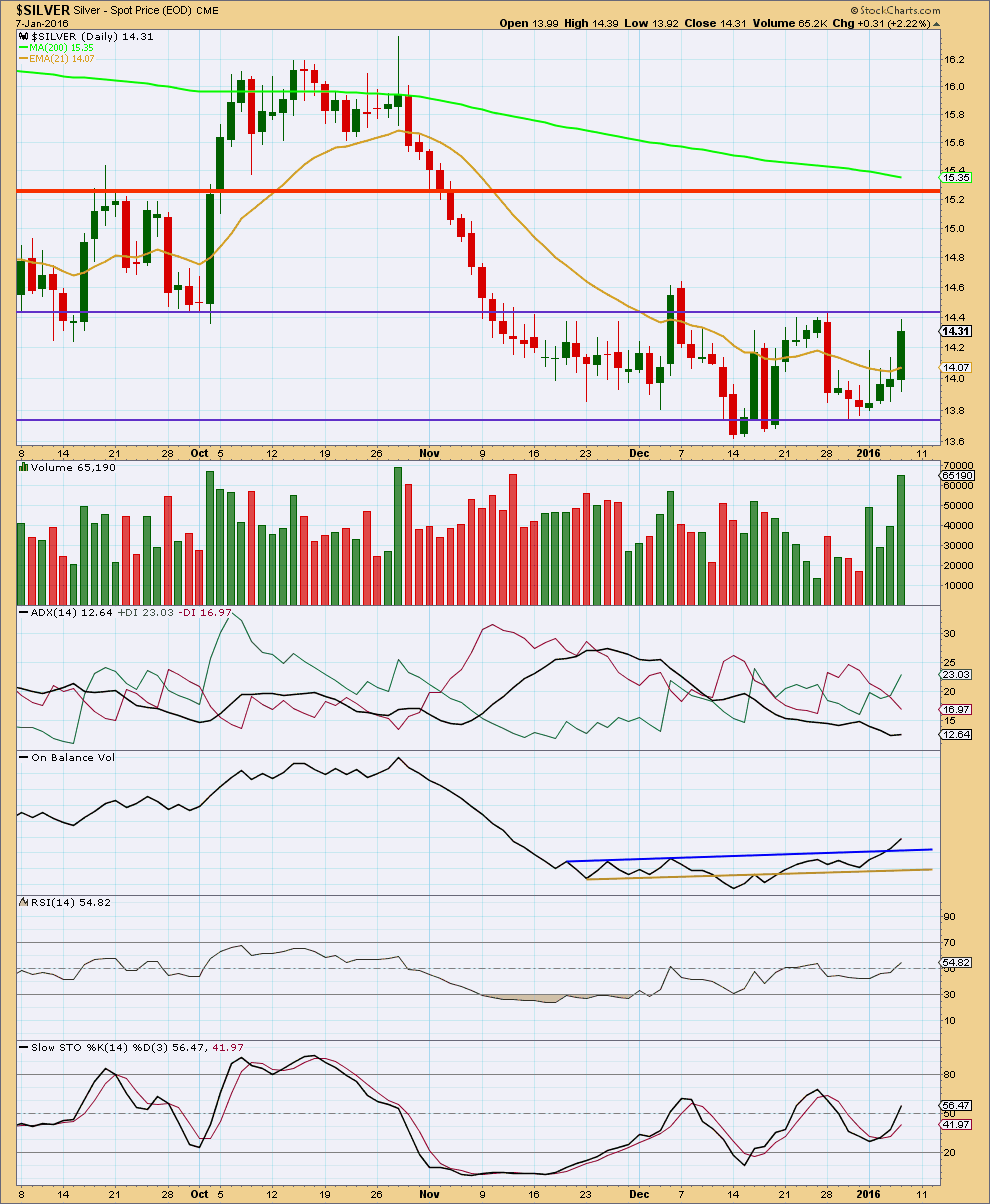
At the daily chart level, the volume profile is bullish. The rise in price is supported by volume. This supports the main Elliott wave count. It is today’s upwards day which shows strongest volume within the consolidation. This indicates an upwards breakout is most likely for Silver.
ADX does not yet indicate a trend. The market remains range bound for Silver. Price is finding resistance about the upper blue line and support about the lower blue line (these lines are slightly adjusted this week to be a little more conservative).
On Balance Volume has broken above the upper blue trend line. This may indicate that Silver should break out upwards from the consolidation zone.
RSI is not yet overbought. There is room for this market to rise.
This analysis is published @ 02:17 a.m. EST on 8th January, 2016.
Thanks for the update.