
Upwards movement has breached the cyan line which was providing resistance on the last updated US Oil daily chart. This indicates a trend change.
Summary: A correction for minor 4 looks to have arrived and at this early stage it is most likely to be a quick sharp zigzag. The expectation would be for 8 days of upwards movement to the most likely target at 31.47 or 34.16. It may find resistance at the upper edge of the blue channel on the daily chart.
New updates to this analysis are in bold.
MONTHLY ELLIOTT WAVE COUNT
Click chart to enlarge.
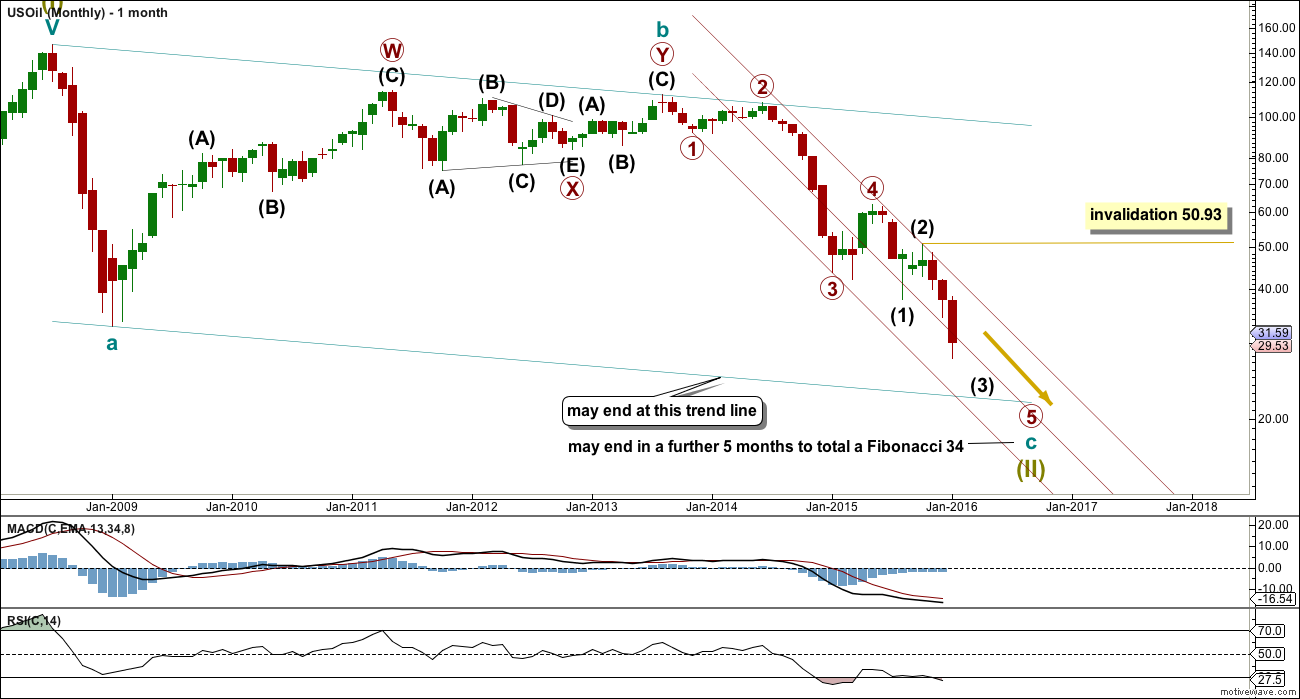
US Oil has been in a bear market since August 2013. While price remains below the upper edge of the maroon channel drawn here and below the 200 day simple moving average it must be accepted that the bear market most likely remains intact.
The structure of cycle wave c is incomplete.
This wave count sees US Oil as within a big super cycle wave (II) zigzag. Cycle wave c has moved below cycle wave a at 32.70 avoiding a truncation. At this stage, as soon as the structure for cycle c could be seen as complete an alternate wave count expecting an end to the Oil bear market would be published. That cannot be done yet because the structure is incomplete. Primary wave 5 has to unfold lower.
When the structure is complete and an alternate bull wave count is published, then it would come with the strong caveat that it is an alternate until there is technical confirmation of a trend change. That confirmation would be a breach of the maroon channel or a break above the 200 day moving average, or both.
Within cycle wave c, primary wave 5 is expected to be extended which is common for commodities.
No second wave correction may move beyond the start of its first wave above 50.93 within intermediate wave (3).
Draw a channel about this unfolding impulse downwards. Draw the first trend line from the lows labelled primary waves 1 to 3, then place a parallel copy up not the high labelled intermediate wave (2), so that all movement is contained. Add a mid line. Copy the channel over to the daily chart.
The wider teal green channel is drawn about this whole correction. Cycle wave c may end when price finds support at the lower edge of this channel. But sometimes these channels are breached by C waves, particularly if the C wave has a swift strong extended fifth wave to end it. How price behaves when it gets to the lower teal trend line, and how complete the structure is at that stage, will indicate if price may stop there or if it would continue.
DAILY ELLIOTT WAVE COUNT
Click chart to enlarge.
Note: FXCM data stream is closed over the weekend. I am aware the candlestick for Friday is missing. It can be seen on the technical analysis chart below.
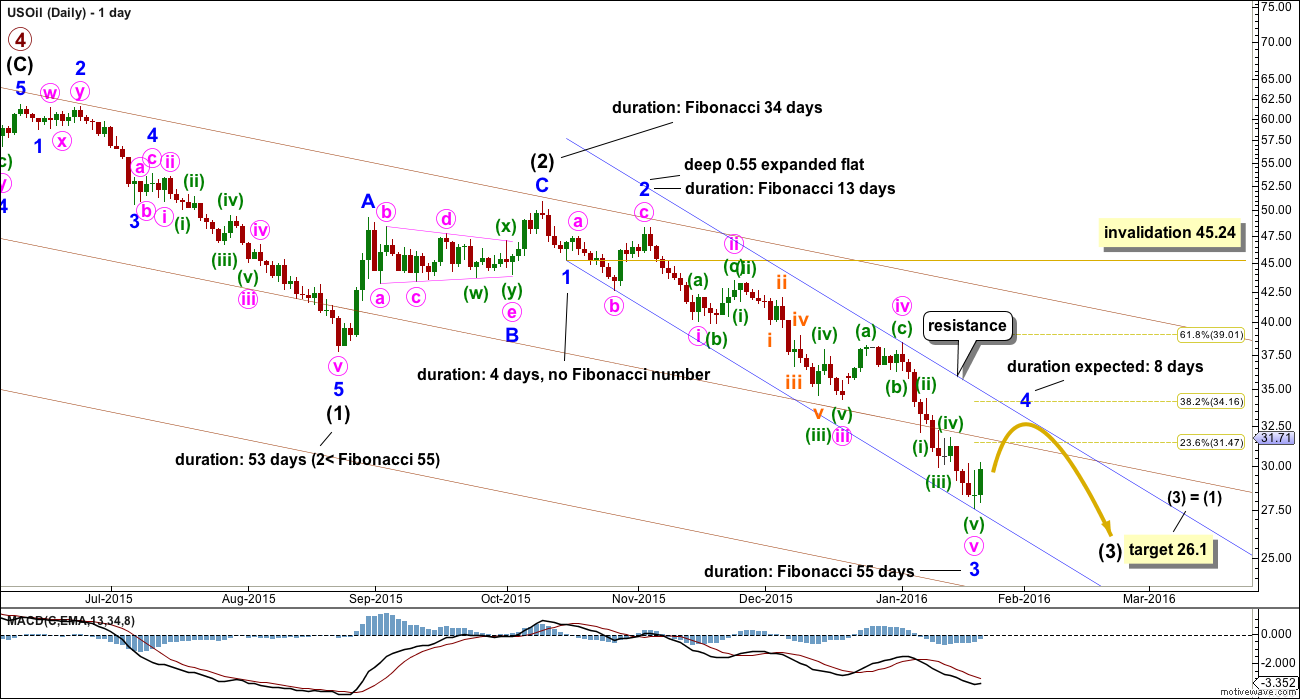
Because upwards movement for Friday reached above the high of minuette wave (iv), which here is 31.76 (and for StockCharts data is 32.83), the final fifth wave within minor wave 3 must be over. Upwards movement for Thursday and Friday may not be a second wave correction within minuette wave (v).
Ratios within minor wave 3 are: minute wave iii is 0.89 longer than equality in length with minute wave i, and minute wave v has no Fibonacci ratio to either of minute waves i or iii. There is alternation in structure between the flat of minute wave ii and the zigzag of minute iv. There is almost no alternation in depth.
Minute wave v is a complete impulse. Ratios within it are: there is no Fibonacci ratio between minuette waves (iii) and (i), and minuette wave (v) is 0.2 shorter than equality in length with minuette wave (iii).
The third wave is shorter than the first within the impulse of minute wave v. I did not consider the possibility it could be over because it was shorter and it was more likely to be incomplete and longer lasting. The rule that the third wave is not the shortest is now met; the third wave is longer than the fifth wave which is the shortest.
Minor wave 3 has no Fibonacci ratio to minor wave 1.
Minor wave 2 was a deep expanded flat correction. Minor wave 4 would most likely be shallow and most likely be a zigzag or zigzag multiple. It may be quicker than minor wave 2, so a Fibonacci 8 days is most likely.
The dark blue channel about intermediate wave (3) is a best fit. Minor wave 4 may find resistance at the upper edge.
Minor wave 4 may not move into minor wave 1 price territory above 45.24.
Intermediate wave (3) is still incomplete. Minor waves 4 and 5 are required to complete it.
At 26.1 intermediate wave (3) would reach equality in length with intermediate wave (1). If this target is wrong, it may not be low enough. The target may be calculated at two wave degrees when minor wave 4 is complete. At that stage, it may widen to a zone or it may change.
TECHNICAL ANALYSIS
DAILY CHART
Click chart to enlarge. Chart courtesy of StockCharts.com.
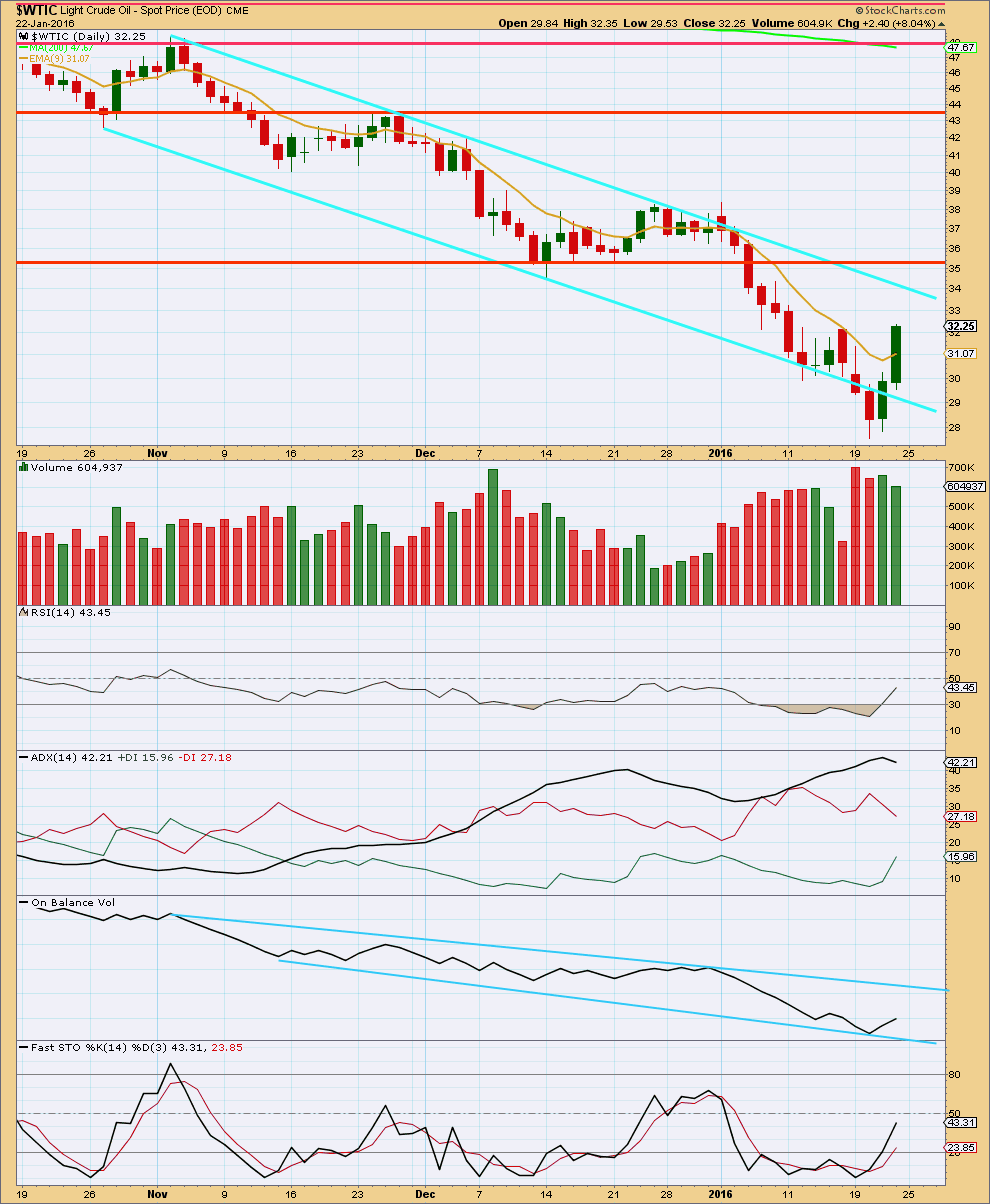
Overall, as price falls it comes on increasing volume. Apart from high volume for the upwards day of 8th December, as price rises it comes with declining volume. The volume profile is bearish. Upwards movement in price is corrective.
ADX has just turned downwards. With ADX between 30 to 45 and now declining, this indicates a correction from an extreme is most likely. This supports a wave count which expects some more upwards movement, and is supported by the volume profile.
On Balance Volume may come to find resistance at the upper trend line as price moves higher. This may help to stop upwards movement in price, if OBV stops there.
When price reaches resistance and Stochastics is overbought at the same time, that may be an end to an upwards swing. The first line of resistance would be the upper cyan line. The next line would be the first horizontal red line about 37.
This analysis is published @ 01:23 a.m. EST.
I’ve got a more bullish idea for Minor wave 4, which sees a series of 1-2, 1-2, 1-2 waves for an extended Minute wave c. This would mean several more days (possibly a total fib 13) of stepping upward to a possible target of 37.62. Oil seems to be finding support above the downward acceleration channel. A move up to 37.62 will still keep Minor wave 4 below the invalidation point and within the main downtrend channel. Volume seems to support a continued move up. Lara, others, thoughts?
Bullish volume
Dreamer, I have a tough time seeing minuette wave (i) as an impulse. Here’s a chart seeing minute wave (c) as an ending expanding diagonal.
There’s a small 4th wave at the top. Those small, quick waves make the structure look like a “3”. That said, I do like the look of your new expanding ending diagonal. Good catch! I should have thought of that when my original contracting diagonal idea was invalidated. Either way, looks like more up next week. Monday may give us a clue as to which option will play out.
Lara’s update on oil
It’s doing exactly as the wave count expected. Price moved higher for a fourth wave zigzag.
Now a channel can be drawn around that upwards move. When its breached by downwards movement then it may be over.
Would appreciate oil update for EW count.
Carter Worth is a pretty good technical analyst. Short video with big picture look on Oil price.
http://www.cnbc.com/2016/01/29/shale-will-cap-crudes-rally-with-fast-production-citi.html
US Oil break out. It must go higher to 36 to 38 range.
A deep wave 4 correction.
Lara how high to expect for this correction??
Thanks.
Might be a good visual, but it doesn’t look like a valid EW count.
Wave labels are from Lara’s wave count.
https://youtu.be/PYoAOaYi0tI
Mr carboni is giving target of nearly 45 $..before a new low…
I found him accurate many times but this target invalidates counts..
Is this intermediate 4..??
Actually want to be on long side to play intermediate 4…
One of the analyst on blue channels stating that Primary 5 is dne..
As Primary 3 was extended
Primary 5=Primary 1
Lolzz:))
My guess is minor 4 is not over.
Is this chart labelling possible..!!!???
My ending diagonal idea no longer works. You may be onto something here. Minute wave b may become an expanded flat and Minor 4 will continue for a few more days. Let’s see if Lara agrees.
http://stockcharts.com/articles/dont_ignore_this_chart/2016/01/oil-shuts-in-a-well-fire-in-the-hole.html
Good read. Thanks.
Its looking like minor 4 is over..we can clearly see A B C on daily charts…
News from russia over cut in output is a concern
I think lara will give an update if required…
Yes. I’ll update with a chart later today.
Hi Lara,
would be wonderful an update on Oil this weekend.
Thank you very much
Let’s see how this works out….
That looks highly plausible Dreamer. Not risking anymore trades here until it looks like we’ve turned down for minor 5.
appreciate your charts Dreamer, keep them coming!!!
Good work dreamer
Thanks for this so the turning point would be around 33.55? or 33.75?
Looks like Minor 4 may not be a simple zigzag after all and may take 8 days total as Lara originally suggested. Here’s a look at a possible count for Minor 4 with Minute b as a triangle.
Nice chart dreamer
US Oil daily ADX black line x-over 5ema. Trend change expected.
Lara great analysis of US oil.
In comment below : “It still needs intermediate (4) correction then intermediate (5) down to new lows to complete it.”
Clarifying statement like this in the body of your report would help newcomers like me.
Also some very important statements under monthly chart can be remain bold and italic to differentiate with new material but important to keep reminding the importance. e.g.: “Within cycle wave c, primary wave 5 is expected to be extended which is common for commodities.”
Thanks.
Possible count for Minor 4
I agree
If you move the minuette (a) to the left, then minuette (b) is an expanded flat and (a) fits better as an impulse.
And then you can label (c) as an impulse.
And if you do that, does (a) have a ratio of equality with (c)? It looks a bit longer actually.
If (c) is longer then at what point would it reach 1.618 X (a)? that could be where it ends.
Next, draw a channel about it. A breach of the channel = confirmation it is over.
Great feedback. Thanks!
Dreamer can u draw the channel mentioned by lara and post ur chart again..
Added channel around Dreamer’s chart.
Channel is breached. Minute wave b possibly over?
Nice chart. Looks like Minute b is over.
Target for Minute wave c = a @ 34.42
Brilliant! I spotted that too and went long near the extreme of minute (b). So far, so good.
Oil seems so much easier to trade using Elliott at the moment. Maybe because it’s a bigger market…and freer?
Thank u Edwin..
U made it so easy to spot
We had a complete 5 waves up today to new highs and then it dorps and is dropping after hours.
Do you think it is possible that minor wave 4 finished already at todays high?
Thanks
Thank you, Lara, for these Oil updates!
I’ve been trading exclusively (and quite profitably) in UWTI/DWTI for the last few weeks, as the intra-day wave patterns seem a lot easier to discern than Gold or GDM — at least for me.
Your weekly Oil updates definitely help with the big picture.
I appreciate all your careful analysis work and your trading insights.
You’re most welcome Curtis 🙂
Get ready for a 2 to 3$ bounce again
Crude down…May be we are witnessing the minutte 2 of an implulse wave A of minor 4..
Or may be minutte 4
Hi Lara,
Lately, SPX has been following WTIC…So, if WTIC continues to bounce so should the SPX?
They do appear to be moving together at this time don’t they.
I am also expecting a bounce for S&P for a few days.
When you say it is likely to end in 8 days, does that include weekends?
I’m saying that because the bounce started on wednesday, so 8 days will make it wednesday of next week. The day of the Fed rate hike or not decision.
Thanks
No, 8 daily candlesticks.
Only trading days.
It seams the technical chars and the interpretation are from the last date 15 & 18 Jan and not up to date.
It would be wonderful to have an update on this too. So much has happened since.
Hi Lara,
looks like the charts for the technical analysis have been mixed up, this one is dated 15 Jan 2016?
Would it be possible tu update this chart, please?
Do I understand correctly; target for wave 3 is 26.10 then another correction and lower to 5?
Thanks Ursula
I am sorry everybody, I did not update my code.
That is fixed now. The TA chart is now correct.
Lara u mentioned above..
‘an alternate wave count expecting an end to the Oil bear market would be published. That cannot be done yet because the structure is incomplete. Primary wave 5 has to unfold lower.’
I heard that if 3rd wave extends to its extreme limits than wave 5 usually gets truncated..
Is it true..??
Yes. That is correct.
What I mean by “the structure is incomplete” is the monthly chart.
Look at the structure of primary 5 on the monthly chart. To try and see it over there would see it a three wave structure. It must be a five.
It still needs intermediate (4) correction then intermediate (5) down to new lows to complete it.
Thanks laraa…
Again a clear and easy to understand analysis…thank u
But why the last bar in technical analysis chart showing in red..??
Hi Lara,
is the technical chart diagram up to date?