
The Elliott wave count remains the same.
There is still only one Elliott wave count for US Oil.
Summary: A fifth wave down to end a third wave may have begun. For confidence in this idea, price needs to break below the upwards sloping cyan trend line on the classic technical analysis chart and On Balance Volume needs to break below its two blue trend lines on the same chart. Fifth waves to end third waves are often the strongest part of the trend for commodities. The target for this trend is 29.21 which may be met in twelve days time.
New updates to this analysis are in bold.
MONTHLY ELLIOTT WAVE COUNT
Click chart to enlarge.
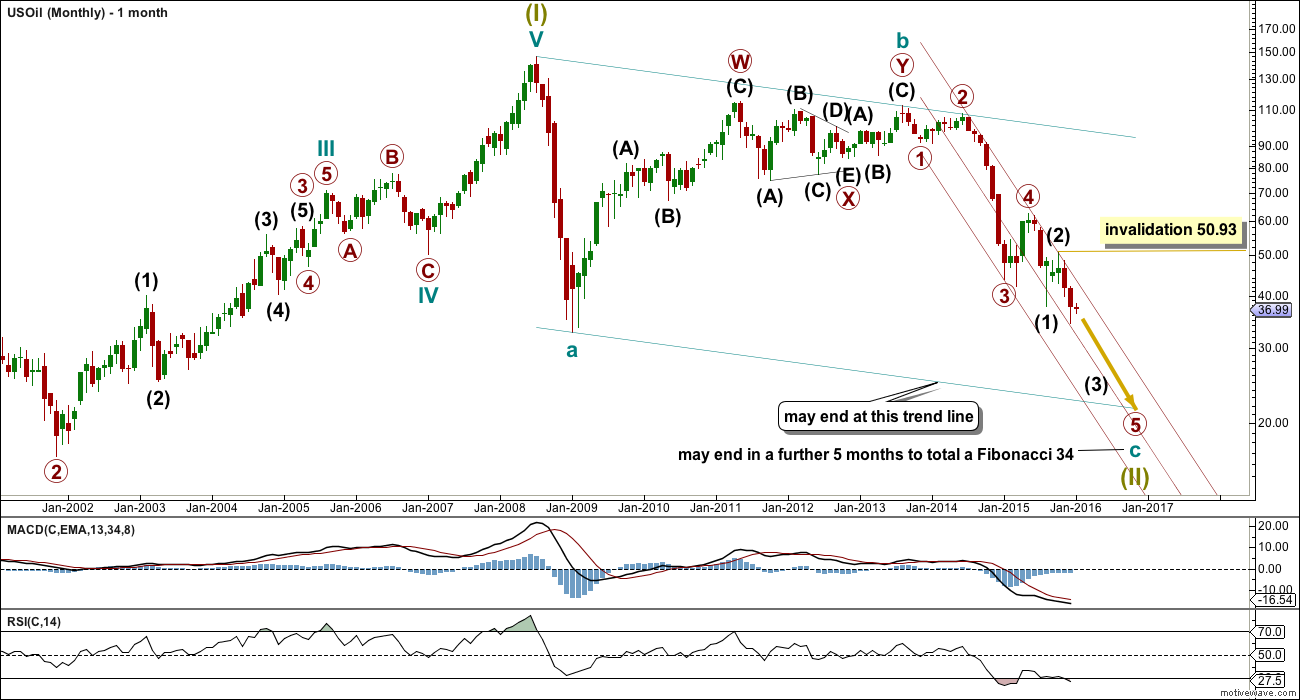
US Oil has been in a bear market since August 2013. While price remains below the upper edge of the maroon channel drawn here and below the 200 day simple moving average it must be accepted that the bear market most likely remains intact. I will not publish a bull wave count while this is the case and while there is no technical confirmation of a trend change from bear to bull.
The structure of cycle wave c is incomplete.
This wave count sees US Oil as within a big super cycle wave (II) zigzag. Cycle wave c is highly likely to move at least slightly below the end of cycle wave a at 32.70 to avoid a truncation. Cycle wave c may end when price touches the lower edge of the big teal channel about this zigzag.
Within cycle wave c, primary wave 5 is expected to be extended which is common for commodities.
No second wave correction may move beyond the start of its first wave above 50.93 within intermediate wave (3).
Draw a channel about this unfolding impulse downwards. Draw the first trend line from the highs labelled primary waves 2 and 4 then place a parallel copy on the end of primary wave 3. Next push up the upper trend line slightly to contain all of primary waves 3 and 4. Copy this channel over to the daily chart. The upper edge should provide resistance. Add a mid line to the channel to the daily chart, which is currently showing about where price is finding support. When the mid line is properly breached, it may then provide resistance.
DAILY ELLIOTT WAVE COUNT
Click chart to enlarge.
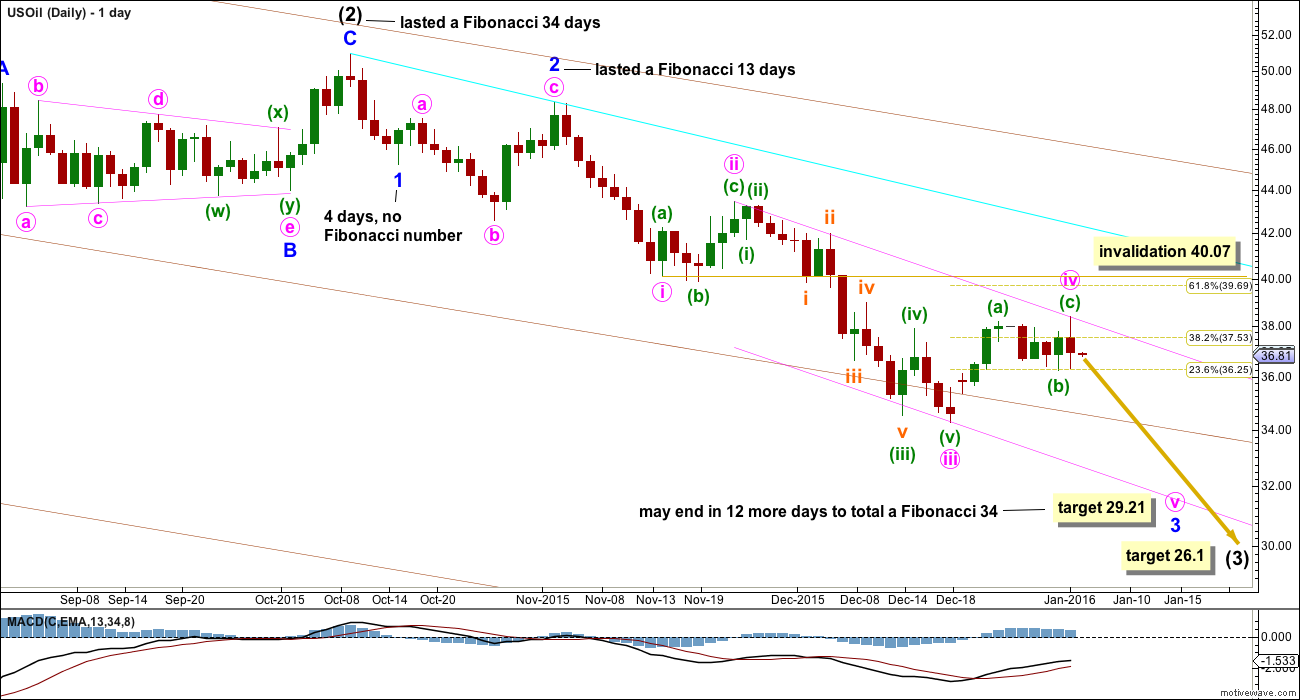
At 26.1 intermediate wave (3) would reach equality in length with intermediate wave (1).
Minor waves 1 and 2 are complete within intermediate wave (3).
Minor wave 3 is an incomplete impulse.
Minute waves i and ii are complete within minor wave 3. Minute wave iii is now also most likely over. It did not reach the target and it does not exhibit a Fibonacci ratio to minute wave i.
Ratios within minute wave iii are: there is no Fibonacci ratio between minuette waves (i) and (iii), and minuette wave (v) is 0.26 longer than 0.382 the length of minuette wave (iii).
Minuete wave ii was a shallow 0.41 flat correction. Minute wave iv is also shallow at 0.45 but exhibits alternation as a zigzag.
At 29.21 minute wave v would reach equality in length with minute wave iii. Both minute waves iii and v would be extended. Minute wave v may be stronger and may be relatively swift.
So far minor wave 3 has lasted 22 days. If it continues for a further 13, it may total a Fibonacci 34 days.
Minute wave iv may not move into minute wave i price territory above 40.07.
The channel about minor wave 3 is drawn using Elliott’s second technique. Downwards movement may find support and end at the lower edge of the channel, or this lower edge may be overshot if minute wave v is particularly strong. Along the way down, upwards corrections should find resistance at the upper edge of the channel.
Look out for surprises for US Oil at this stage to be to the downside. Fifth waves to end third wave impulses are often very swift and strong for this market.
So far downwards movement is finding some support about the mid line of the maroon channel copied over from the monthly chart. When the mid line is clearly and properly breached with at least one (preferably two) full daily candlesticks below it and not touching it, then that line may be about where corrections find resistance.
TECHNICAL ANALYSIS
DAILY CHART
Click chart to enlarge. Chart courtesy of StockCharts.com.
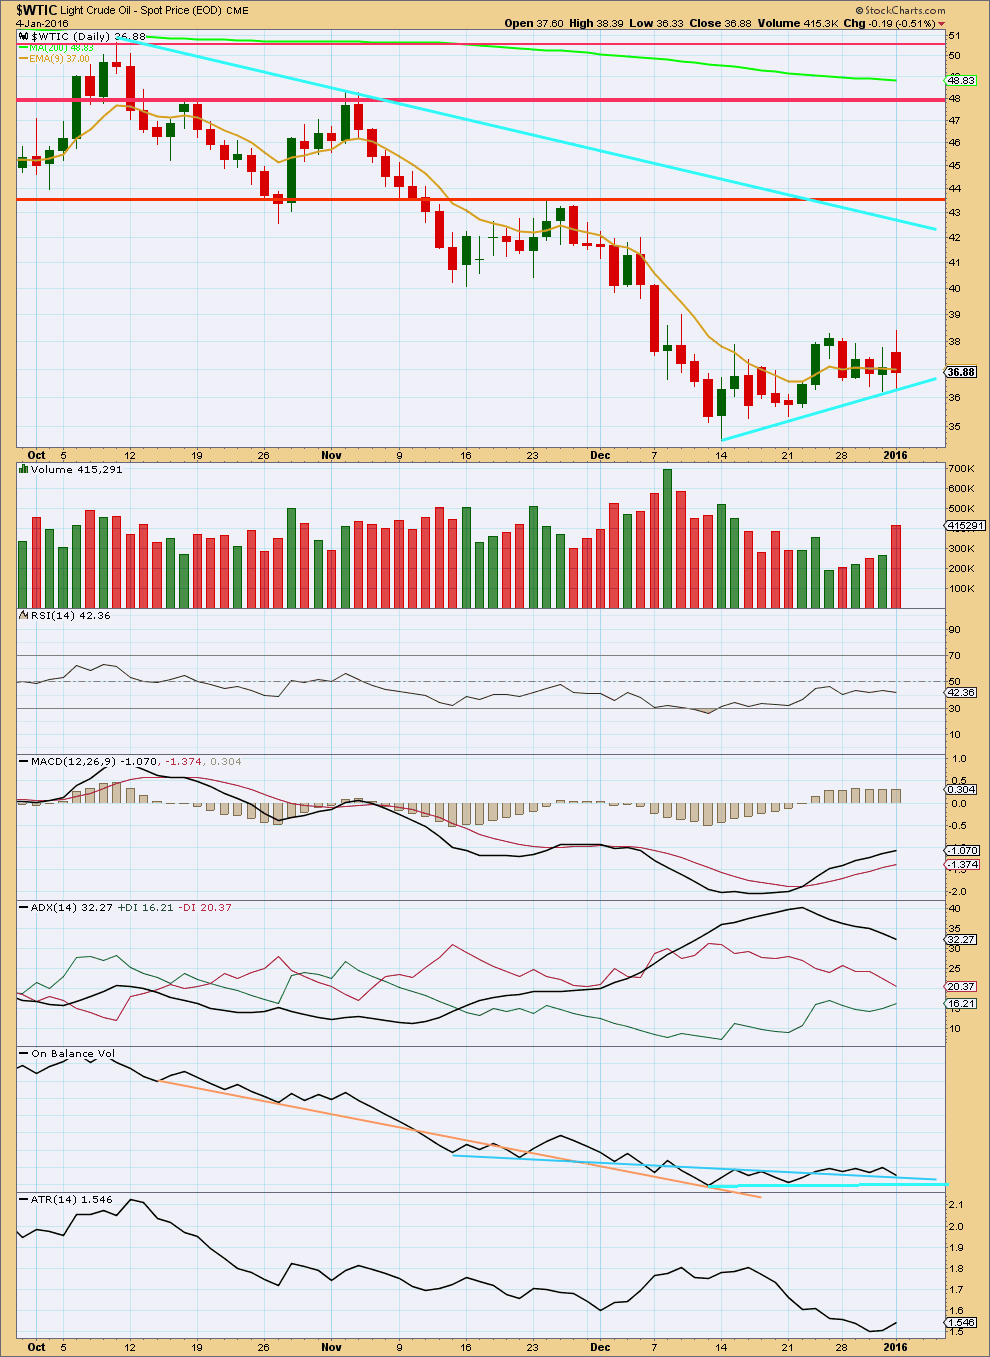
ADX is declining indicating a correction is unfolding, which is what price has been doing for the last 14 days.
Monday’s downwards day comes with an increase in volume. The volume profile is bearish.
Price is finding some support at the short term cyan trend line sloping upwards. If price breaks below this line, then more confidence may be had that the downwards trend has resumed.
On Balance Volume is finding some support at the blue trend lines. If OBV breaks below those two blue lines, that would be an indication that the downwards trend has resumed. While OBV remains above those blue lines, the risk is that the correction is not over and price may swing within a narrow range for some time yet.
There has not yet been a downwards breakout. The cyan line needs to be breached on a downwards day preferably with an increase in volume (but not necessarily) for confidence that the correction is over and price is breaking out downwards.
This analysis is published about 09:34 p.m. EST.
US Oil chart daily.
Do we have a breakdown in crude now? Certainly looks like it. Have gone short with a stop on a close back above the line.
Yes, it sure looks like we do.
Your entry point sounds perfect.
It broke below. Lara’s EW target in sight for this wave down. Bot SCO.