
Sideways movement for a correction was expected.
Summary: The trend is still up, but a multi day correction is unfolding. Choppy overlapping sideways movement may continue for one or more likely three more days. It may end either within 1,174 – 1,164 or at 1,151.
New updates to this analysis are in bold.
Last published weekly charts with the bigger picture are here, with video here.
DAILY ELLIOTT WAVE COUNT
Click chart to enlarge.
A new high above 1,191.37 has invalidated the bear wave count and confirmed that Gold is now in a bull market.
Super Cycle wave (b) may be any one of 23 possible corrective structures. First, a move of this size should have a clear five up on the daily and weekly charts. That is still to complete.
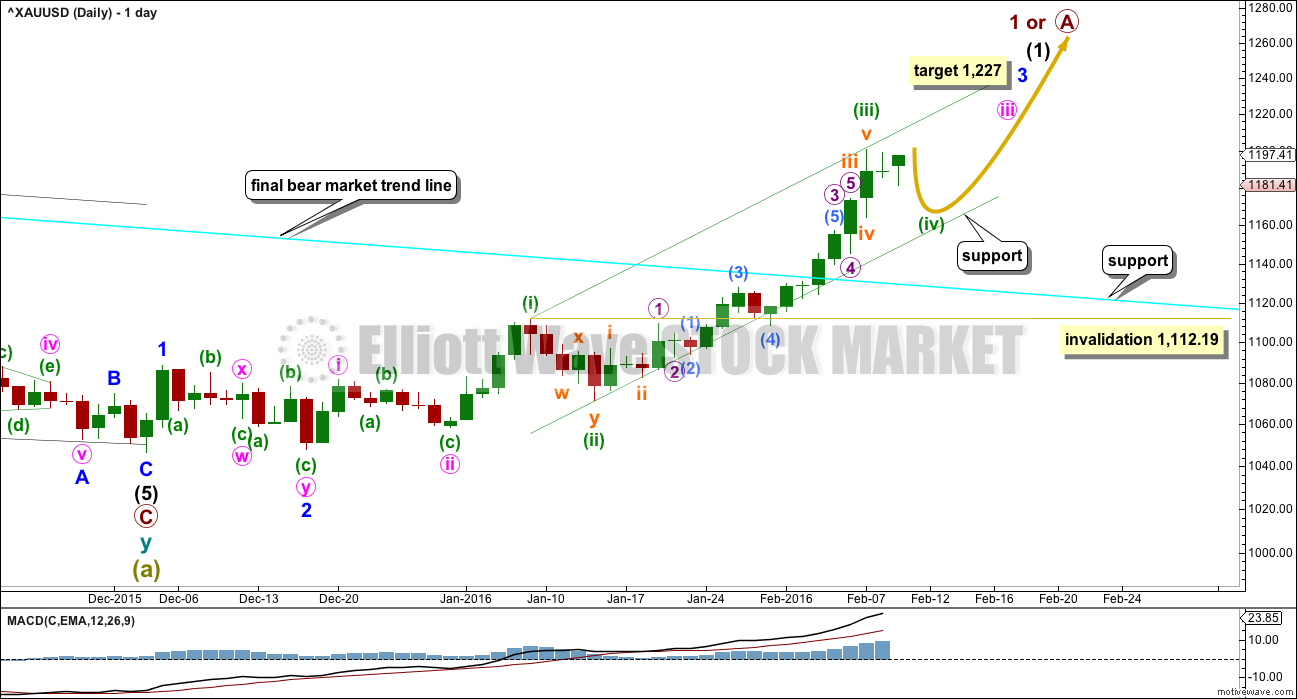
So far, within the first five up, the middle of the third wave is now most likely complete. The strongest move may yet be ahead. Gold typically exhibits swift strong fifth waves to end its third wave impulses. Look out for surprises to the upside for one or more of subminuette wave v, minuette wave (v), minute wave v, and minor wave 5.
At 1,227 minor wave 3 would reach 4.236 the length of minor wave 1. If this target is wrong, it may not be high enough. Minor wave 3 may not exhibit a Fibonacci ratio to minor wave 1.
Within minor wave 3, minute waves i and ii are complete. Minute wave iii is incomplete.
Within minute wave iii, minuette waves (i), (ii) and now (iii) are complete.
Minuette wave (ii) was a time consuming and deep double zigzag which lasted 4 sessions. Minuette wave (iv) should also be a multi day correction showing up clearly on the daily chart.
Subminuette wave iv was over within one session, lasting just 12 hours and very shallow. This is a typical tendency of Gold when fifth waves are swift and strong. When this happens fourth wave corrections are forced to be more brief and shallow, giving an impulse a slightly three wave look and ending with a sharp spike. Look out for this tendency again as minor wave 3 comes to an end in the next couple of weeks or so.
Draw a channel about the impulse of minute wave iii. Draw the first trend line from the highs labelled minuette waves (i) to (iii), then place a parallel copy on the low labelled minuette wave (ii). Minuette wave (iv) should find support at the lower edge of the channel. Copy it over to the hourly chart.
HOURLY WAVE COUNT
Click chart to enlarge.
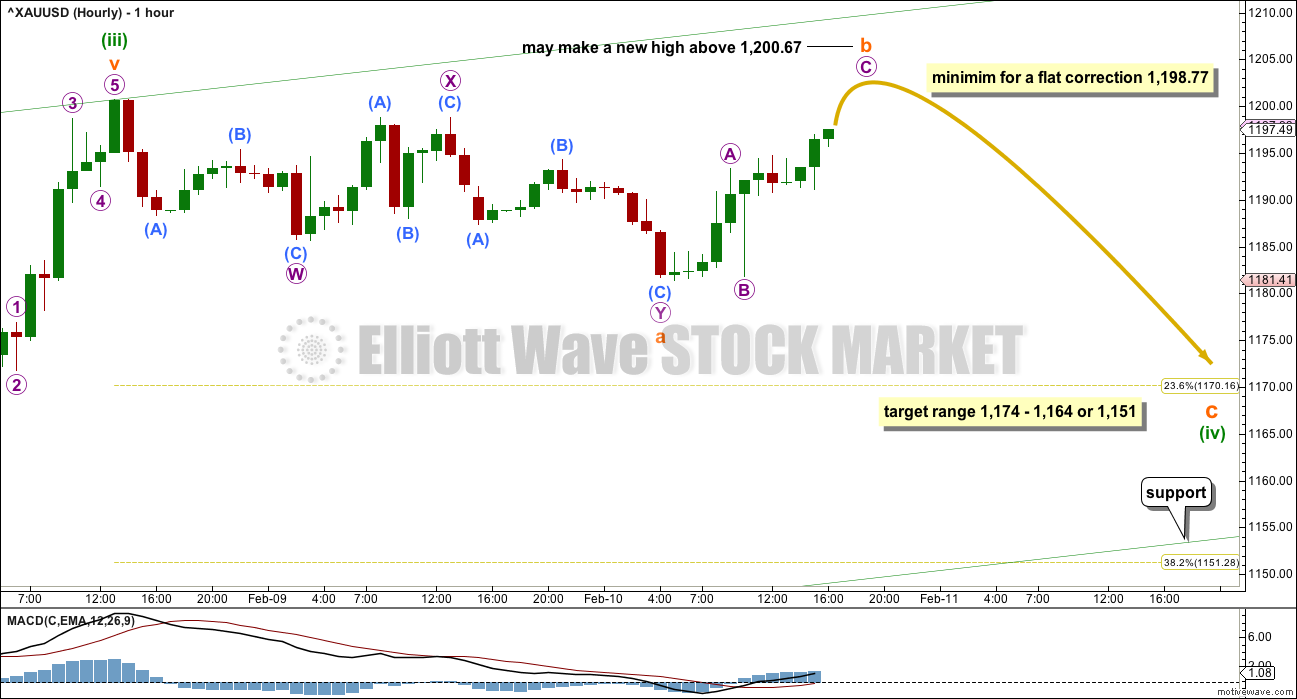
Minuette wave (iv) should exhibit alternation with minuette wave (ii). Minuette wave (ii) was a deep 0.76 double zigzag lasting four sessions. Minuette wave (iv) should be shallow. It is most likely to be a flat, combination or triangle. These structures tend to be more time consuming than zigzags.
There are two competing tendencies regarding the duration of minuette wave (iv). It may be forced to be more brief and shallow than otherwise, if the following fifth wave of minuette wave (v) is to be a typically swift strong fifth wave. But it may be longer lasting than minuette wave (ii) because sideways corrections tend to be quicker than zigzags.
At this stage, it is impossible to say how long it would last. It is again unlikely to be over today, and it is possible that it is over but that would have a low probability. What is much more likely is it should continue. If minuette wave (iv) lasts a total Fibonacci three days, it could end in just one more day now. It is more likely to last longer though; a total Fibonacci five days would see it continue for three more days.
Minuette wvae (iv) may end within the price territory of the fourth wave of one lesser degree. Subminuette wave iv has its price territory from 1,174 to 1,164.
If minuette wave (iv) is a little deeper, it may end about the 0.382 Fibonacci ratio at 1,151.
Minuette wave (iv) may not move into minuette wave (i) price territory below 1,112.19.
There are still 23 possible structures that this fourth wave may unfold as, so it is impossible to tell which it will be only that it is unlikely to be a zigzag or zigzag multiple. That leaves a likely 20 structures. The labelling within it will change as this correction unfolds, as the structure becomes clearer. The focus cannot be on what pathway price may take during the correction; the focus must be on identifying when it is complete.
If minuette wave (iv) is an expanded flat, running triangle or combination, then it may include a new high above its start at 1,200.67. A new high does not mean this correction is over. There is no upper invalidation point for this correction.
Corrections are not good trading opportunities. They present an opportunity to join the trend when they are complete.
TECHNICAL ANALYSIS
Click chart to enlarge. Chart courtesy of StockCharts.com.
Volume data for StockCharts for this session will probably change after 6:30 p.m. EST, when it is updated. Further comment regarding volume will be made later today.
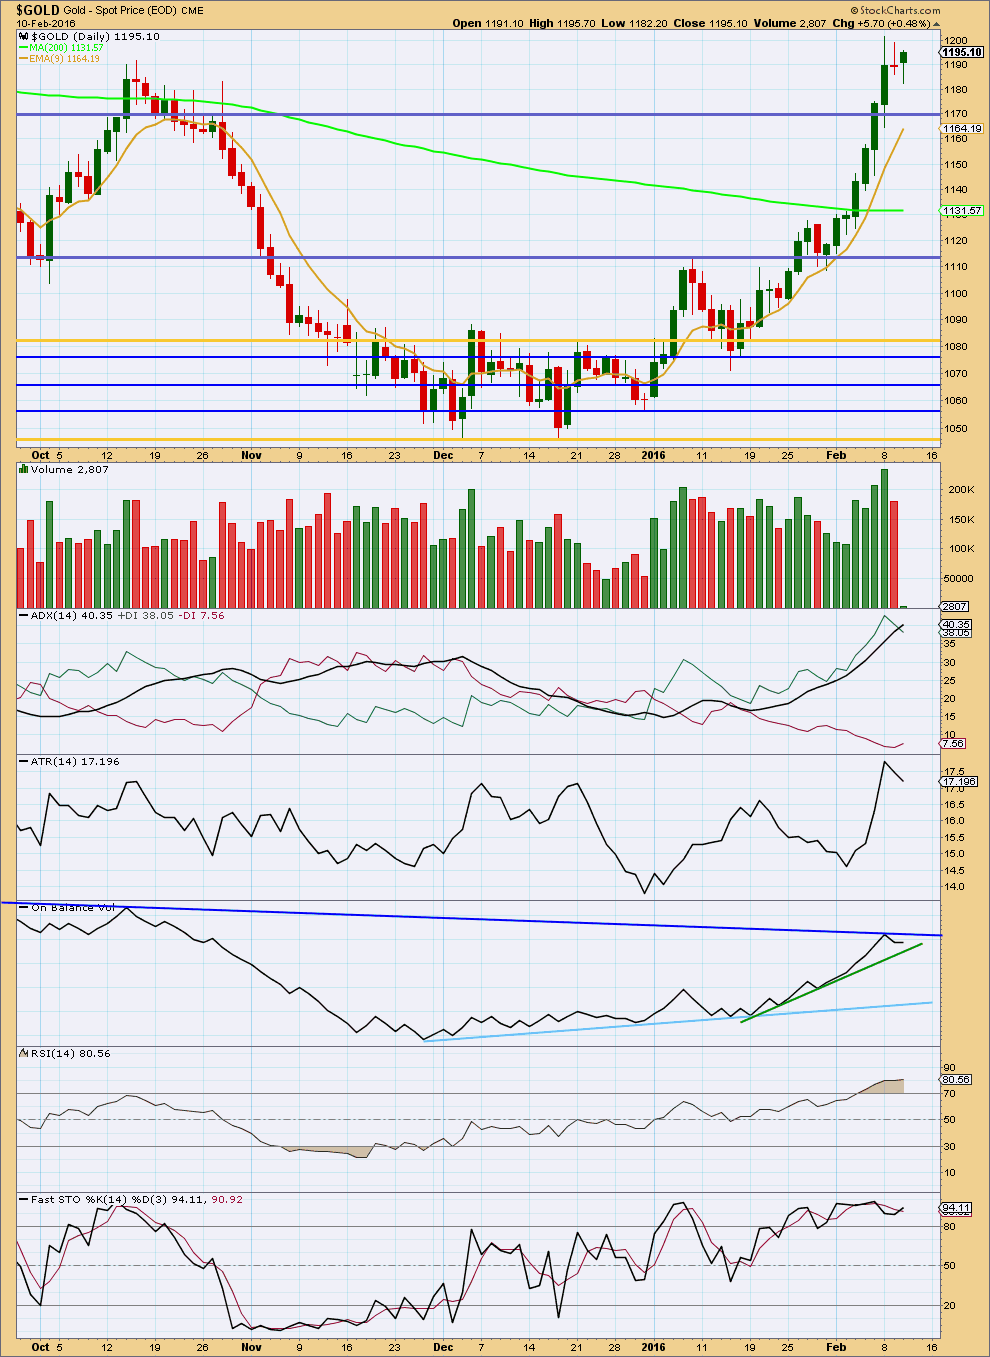
Another small real body with a long lower shadow looks corrective.
ADX still indicates there is an upwards trend, but it is a lagging indicator. ATR has today more clearly pointed lower; as it is declining, it is indicating the market has most likely entered a correction.
On Balance Volume should again find resistance at the dark blue line, if it turns up again. It may find some support at the green trend line although this line is not very technically significant. The light blue line is more technically significant as it is shallow and has been tested more often. The light blue line should offer good support, if OBV gets that low.
I would expect this correction to continue for a few days more to return RSI from overbought.
This analysis is published @ 06:04 p.m. EST.
And… now the current impulse is over.
The target at 1,800 was probably too low.
If we are going to see another Dead Cat Bounce then this is probably the start here.
How high can a Dead Cat Bounce?
(I’m thinking of making a T-Shirt with that on it 🙂 )
What is 1800 ????
we got an spx update by mistake
That what I am thinking.
Ha Ha 🙂 yep this was meant for Laras S&P blog.
You’ve got too many websites to worry about Lara!
I’ll copy it over to the guys on S&P blog
I’m so sorry, yes, I have both open at the same time and posted an update for S&P on Gold 🙁
I was hoping $1,800 was a gold forecast high for 2016. Nope darn was S&P.
This is the alternate I have so far.
At 1,269 minuette (v) would equal 1.618 X minuette (i).
This alternate expects one final push up before this third wave is over.
I would use the lilac trend line. If / when that line is breached then the probability that Gold has entered the next fourth wave should be high.
Still expect minute iv to be brief and shallow.
Minuette (iv) is clearly over more quickly and was more brief than expected.
This is a surprise to the upside.
There are still two fifth waves ahead; minute v and minor 5.
Short term I need to determine the probability of minuette (v) being over. It does subdivide neatly as a five wave impulse and would be very close to 0.618 the length of minuette (iii).
This is what I have so far for the hourly chart. I want to use this cyan trend line to confirm when minuette (v) is over and so when minute iii is over. When price breaks below the cyan line then Gold should have entered another fourth wave correction.
The lesson I must learn from today: there are two competing tendencies for these fourth waves – the tendency to exhibit alternation with the second wave and so to be a longer lasting flat, combination or triangle, and – the tendency for fourth waves within third wave impulses to be brief and shallow. The second tendency, to be brief and shallow because they’re fourth wave corrections within third wave impulses, is much stronger.
And so we have two more of these fourth waves coming up, and two more strong fifth waves up also. The next fourth wave correction may begin here according to this hourly chart.
A new low below 1,229.69 could not be an extension within the final fifth wave, at that stage the probability that a multi day correction is underway would be increased.
Minute ii lasted 7 days. Minute iv is likely to be more brief, and shallow. It may find support at the upper edge of the green channel. It may reach only to the 0.236 ratio of minute iii at 1,214. It may last about three days. At this stage that should be the expectation, based on probability and current behaviour of this upwards impulse.
I will now work on an alternate to see what if minuette (v) and so minute iii is not yet over.
Hi – am new ‘kid’ on here… well actually I am a Grandma and a senior. I have been reading some of the posts with interest. I have learned not to listen to the ‘pundits’ because most of the time what they say is completely off kilter. However, I do very much appreciate Lara’s dedication to studying these charts, and for me Gold is my main interest. Last year I spent weeks putting all of my own lay overs on my chart (following the Steve Copan mathematical method which is Elliott wave based and with lunar cycles drawn on), marked off all of the numbering and was able to roughly work out where the gold market could go next. Then poof – my computer packed up, and as I had a downloaded platform, all of my hard work went with it! Now that I have joined this site, I write Lara’s comments on my chart with warnings in very large letters. It stops me from making silly mistakes, and yesterday didn’t trade as it was a bit choppy. I traded today and made some money. I am very glad about that!
But do you really think that Yellen’s comments can have that kind of effect for that length of time? I ask this because on the 15th January last year, the USD/CHF took a massive tumble. All I kept hearing from the pundits was that it would go higher for various reasons, and apart from those who recognise the Elliott wave cycles, most people were long on their trades and consequently lost a bucketload of cash. But when I looked at it, all I kept seeing was that it was going to go lower and by a very long way. It did and past where I would have put my target. I didn’t trade that day, because of the news comments, conflicting with what I could see on the chart. This is why I am so thankful for this site, and Lara’s cautions. I’ve only been trading for little over a year, and for the past nine months, haven’t been in the market at all.
Thank you Joanna, and welcome to this community.
HI lara, looks like 1181 completed minute wave 4 and now in minute wave 5 of larger wave 3. Best estimate on where 3 might end and best estimate for corrective wave 4 ,then wave 5 up to ? Thanks , I’m sure you are busy.
Chart posted above.
Now I’m working on an alternate which could see minute iii continuing higher.
“Buy gold back down about 1200 to 1190” in maybe 2 weeks according to an Elliott Wave EWI Legendary trader Jeffrey Kennedy Thursday Feb 11th 11:34 am.
I just watched a free 1 hour live seminar with Elliott Wave International Master Guru Trader/teacher Jeffrey Kennedy.
Luckily I watched most of the video and saw the 4 minute gold comment.
He just said this morning at gold high, he wouldn’t buy gold now or short.
Gold was at 1162 at 11:34 or 11:35 am EST Thursday Feb 11th and he said gold may have finished a 3rd wave up and then we have a 4th wave correction down maybe to the 1200 to 1190 area.
He doesn’t trade 4th waves as too complex and would be against the bullish uptrend.
He is a Guru trader if anyone could do it he would but won’t and he trades where he gets a 3 to 1 reward to risk trades.
What is his wave v target once the wave iv is done?
Lara’s wave count is same. We are all waiting for for this wave iii to be over.
We just have to wait to see what new wave count looks like.
That’s all he said about gold.
Thank you for this post Richard. Timing an entry is so important and this is really good info. I’m praying I get it right. Well more like I’ve been cursing the wrongs lately. A few others here are also trying to be a patient cat. Thanks again.
Janet Yellen US Fed chair live conference began at 10:00 am Wednesday, she spooked the stock markets worldwide with possible pending problems, gold hit day low at 10:33 am and started picking up momentum and went around the world and went into Turbo Bullish gold.
Gold is up $67 since Janet Yellen Wednesday talk 1181.60 to 1248.59 now. So watch out for the Janet Yellen effect on gold as it may effect the direction of gold for weeks and months. The mid October gold high began crashing at the US Fed meeting and went down until Dec 3rd gold low.
This move in gold looked more like bottom of the 1999. AND then corrects back down.
I have posted this chart before.
This move will up will end and then will be plenty oppot to ride this multi year bull.
Gold rose from bottom 30%.
Yes, I remember stating on the Kitco forum in 2001 that a REAL bottom was made in gold in 2001 at $ 255 and did extremely well buying gold mining stocks over the next year.
SEEMS LIKE TRYING TO SHORT THIS GOLD BULL IS SUICIDE. Back in 1986 i borrowed $50,000 on a home equity loan and bought sugar futures at 5 cents per pound I added to dips (on my rising equity) never shorting and in 6 months had over $500,000 in my account. No more trying to short this gold bull for me.
Yes unless you are watching every minute, forget about shorting.
Gold price is parabolic lol nothing to short yet… Firstly as was expecting 20dma made a bullish crossover above 200dma and at about the same time something that hasn’t happened since June 2013, the monthly CCI crossed above 0 inviting to initiate longs…. At this rate it wont take long to take out 1308…. Hard to say if any healthy correction will be forthcoming anytime soon…. it does not matter that daily RSI is way above 80 in overbought territory because for now StochRSI on daily and weekly is heavily locked in and not letting up at all…
You have got that right!
…. appears 1260-69 range being lined up with weekly RSI not yet hit 70 lol….
There will be a sizeable correction. But it will still be against the trend which is up.
Anyone going short here is trying to pick a high and that generally does not end well.
IMHO Gold price appear to be basing off 1232-31 with 1230-25 holding; poised for a break above 1241-42 for 1250-59 range….
Hi Lara,
I must admit I am very disappointed…..
You said gold moved along “classic lines”, or something to that effect, and this is why you enjoy making gold charts….
So, how did you come up with the conclusion, for two consecutive days, that gold was going to reach 1174 or 1161 or even 1151 !!!
And now, as gold opens in new york it is at 1242…..
Really Lara?
It is clear….you have no idea what is going to happen next….
I place 3 orders at 1182 and when they went up to 1193 I cashed out, because of your warning….
thank you…..
Dror, Lara has been warning every day.
The strongest move may yet be ahead. Look out for surprises to the upside…
She did confirm last week gold was in a new bullish market.
She also warned that this correction was unpredictable. Also that this gold bullish market is a B wave, which is the hardest to analysis.
Lara pointed us in the right direction, UP for gold. Daily events along the way have surprises some bearish and bullish.
Richard, I think Lara can speak for herself. She is good enough and big enough to not go without criticism. And although she is excellent in the detail work, I have noticed more than once she’s missed big turns. Traders will get frustrated at times because EW is an analysis of past action only no matter how you slice it. Anyone who spends as much time as she does on EW of so many markets at the same time does not have time to delve into all the politics going on in the global economy which may affect gold- that’s a fact. She can’t be perfect. (and I don’t expect her to) But it doesn’t look good if she isn’t defending herself and every time an apparently new post er posts a criticism everyone else answers for her. My $.02.
Thanks, yes, I can respond myself. And have done so.
no Richard…
Every day for one month Lara was predicting that the market would turn down at 1135…
then she predicted that there would be a double dip, from 1162 for the first dip and an even lower dip to 1140
now, as I noted, she predicted for two days the market will go down to the three numbers I quoted….
that she correctly identified the up trend is really just a joke…….
no Richard…
Every day for one month Lara was predicting that the market would turn down at 1135…
then she predicted that there would be a double dip, from 1162 for the first dip and an even lower dip to 1140
now, as I noted, she predicted for two days the market will go down to the three numbers I quoted….
that she correctly identified the up trend is really just a joke……. as I wrote her about a week ago…just drawing simple channel lines in October, I “predicted” that the market would turn at 1045 and go up to at least 1161….
Dror – I hear your feedback. However I don’t agree with it. All long term investors realize that analysts projections are based on probability and not written in stone. I think you expected to find someone where their projection is fact. It will never happen. I’ve been investing in gold since mid 2013 and receiving Lara’s analysis since then and stay with her because although I do read three other EW analysts work for free every week I find Lara’s analysis the most detailed, useful and accurate so I still subscribe. I’ve found big errors in the other gold EW analysts ongoing work yet found a much, much lower ratio of error in Lara’s work. No one will ever get gold analysis perfect that is impossible so I stay subscribed with the gold analyst who provides the most tradable information and who I have the highest respect, trust, and belief in and that has been Lara since I started trading in gold. Without Lara’s analysis, I would no longer invest in gold.
Laura has made it clear that surprises would be to the upside, how you trade that information is up to you.
:-). Aren’t we in the game of probabilities? Best trade are yet to come. So don’t worry. Someone in this forum used the term “opportunities galore”. So yes, you will have plenty of opportunities to make money.
never go against the trend, the trend is your friend
I am human and make mistakes.
If you are looking for the perfect analysis which will pick exactly when corrections end so that you can get the perfect entry every time, you will not find it here.
I understand the frustration, I have also missed this opportunity.
If you think that I have no idea what is going to happen next, then I strongly suggest that you cancel your membership. I will refund the unused portion of your monthly fee. And if you choose to vent your frustration at me again I will cancel it for you.
I do not appreciate you letting your frustration out on me in these comments. I insist on a polite and respectful tone in all comments at all times.
As traders we all know that we make mistakes and sometimes miss opportunities. It is the nature of markets and trading. Managing risk and managing our emotions is absolutely central to our success.
And to be fair, I did note last night in comments (which I know you read) that a new high above 1,219.68 would mean minuette (v) upwards was underway.
So if you chose to enter long there you would have a positive position now which is $27.61 above the entry point.
I would consider that information profitable, and actionable.
I might be wrong but looks like it wants to tag 1300 before turning lower. Isn’t weekly falling edge in play? Once 1240-48 rage is cleared, don’t see real resistance.
Traders Shunning U.S. Dollar In Favor Of Gold, Silver – optionsXpress
…
RBC’s Gero: Investors Seeking Safe Havens Such As Gold
Thursday February 11, 2016 08:42
Comex gold is sharply higher on safe-haven demand. “Portable, liquid (and) convertible to any currency, gold is the additional haven many investors in countries with greater problems are rushing to,” says George Gero, precious-metals strategist with RBC Capital Markets Global Futures. The yellow metal is sharply higher so far Thursday with global equities on the defensive. Fund managers are rediscovering gold, he continues. Still, he offers at least some caution, suggesting “we may get ahead of ourselves” in these rallies as short covering occurs.
By Allen Sykora of Kitco News; asykora@kitco.com
Hmmmm…a little upset that we missed to catch this fireyy rocket fli8 of gold…now waiting for intermediate 2 correction…
So guys be hopefull we will board jet speed intermediate 3 on time…
Happy trading…
Many traders are trapped on bearish side
LARA thank you for keeping us away from bear trap…
Yes many other advisers were saying gold still bottoming and their shorting was overnight problem.
The bigger they get, the harder they fall. The pace of gold’s move up is unsustainable. I would expect an equally ruthless drop over the next weeks.
At 11:28 PM below Lara: “If upwards movement reaches 1,219.68 then subminuette wave b would be 2 X subminuette a. Any movement above that price point would take b above 2 X a, at that stage the probability that a flat is unfolding would reduce to so low it should be discarded.”
Gold is trading at 1230 and going higher.
So subminuette wave b is dicarded??????
Need a new wave count at hour ??
This is not a B wave.
These bull markets in gold never let you in. And when the correction finally comes, those sitting on the sidelines will buy in too soon from frustration, and suffer a steep fall making the whole move look like a fake out. I’ve been here before and never learn.
Sorry. Just venting my angst. Thank goodness for crude oil.
I know. It is most frustrating.
They move fast, especially at the end, which tempts us in right before the end because it looks so good.
Price do not move above 1219,69, but the up movement from 1181 seems in five
Lara, which symbol is it that completes a larger degree 5 wave move off the gold bottom low to complete wave I off the lows. Then gold would retrace back down for another opportunity to buy in low again for the bull run.
Would it be at Intermediate wave (1)
“GDX needs to complete a larger degree 5 wave move off the 12.40 level, and take us up towards the 21/22 region target to complete wave I off the lows.”
Yes, black Intermediate Wave 1 is the 1st “5” up for both gold and GDX. The end of Intermediate wave 2 will offer a great entry to buy and hold for a strong Intermediate wave 3.
Dreamer that is great.
Black Intermediate Wave 1 is the 1st “5” up for both gold and GDX.
I may buy some GDX and NUGT down at Lara’s minuette wave (iv) target of $1,164 and hold until Avi Gilburt target of 21/22 for GDX, unless some big retrace before then.
Check out this great EW article and charts. He says miners did bottom.
http://www.gold-eagle.com/article/has-bull-market-finally-returned
If price moves above 1,219.68 then the probability that minuette (iv) is over already would be high.
Minuette (v) upwards would be underway already.
Thanks for the price point warning.
Looks like maybe yesterdays 1181 wqs somehow the low of minute 4th wave (not 1174 or lower) AT 3:30 THIS am GOLD WAS STILL UP TO 1208 ,AFTER REACHING 1215 I still kept my April gold shorts ,but by 7:00 am when I woke gold was at 1232 after reaching 1240. Needless to say I covered my shorts at a great loss. However I had been long some junior gold stocks and added to them this AM which somewhat reduced my futures loss. My fault. SZhould have had a stop in overnight ,but did not expect this move to carry to 1245, and was looking for 1174. I think when gold made a double bottom in Dec off 1040 or so and currency conditions in the world and the dollar overprinted in mass quantities I should have just bought and hold. Now we are all waiting to “get in at a lower Price” We may be waiting a Loooong time! IMHO.
In bullish market with bullish surprises it is very dangerous to short overnight when out of sight and control.
Very dangerous indeed . Must attach an alarm to my computer if certain levels are reached while asleep at 4:00 AM. My Bad. Not Lara’s.
The default expectation for this upwards move should be that it is part of minuette wave (iv).
The most likely structures for this fourth wave are a flat, combination or triangle.
The most common type of flat is an expanded flat where wave B is 105% or more of wave A.
So far this upwards move is 1.71 of subminuette wave a.
The common range is 1 to 1.38. The maximum convention (not a rule) is 2. So this is within the maximum convention.
If upwards movement reaches 1,219.68 then subminuette wave b would be 2 X subminuette a. Any movement above that price point would take b above 2 X a, at that stage the probability that a flat is unfolding would reduce to so low it should be discarded.
While price remains below 1,219.68 then an expanded flat for a fourth wave is the most likely structure that would be unfolding.
If subminuette b ends here and price doesn’t move any higher from where it has currently reached at 1,214.15 then a target for subminuette c would be 1,164. It would reach 2.618 X subminuette a.
Lara I remember running into this before – not sure what date or which larger wave – but in the case of an hourly chart where we run into this again — being not definitive whether we’re in a b wave staying under 2x the length of a — could we see the other chart scenario for comparison? (an alternate where the correction is complete) I’m sure thats a runon sentence. Just a request for times you don’t have a gazillion gold charts already to do.
Seeing is believing.
Thanks.
Lara you removed the invalidation 1,112.19 from the hourly but not from the daily chart, however it only appears in the text under hourly chart? Please clarify, thank you.
The invalidation for the hourly should be the same, it is 1,112.19.
The label is AWOL, below the chart. Will move back up.
Apologies for that everybody.
Lara: Looks like minuette wave iii (green) continued to 1214. Now gold correction in minuette wave iv should unfold????
Is it correct?
Correct, yes minuette wave iv is unfolding. Lara explains at the bottom of today’s analysis. If minuette wave (iv) is an expanded “FLAT”, running triangle or combination, then it may include a new high above its start at 1,200.67. A new high does not mean this correction is over. There is no upper invalidation point for this correction. Also at the top of the hourly chart Lara wrote, “May make a new high above 1,200.67.” “Minimum for a “FLAT” correction, 1,198.77.” So it was a flat correction tonight up to 1,215. That is my interpretation.
Lara,
Are adjustments needed to the analysis, because of the new high to 1214 shortly after publication? Thanks.
If minuette wave (iv) is an expanded flat, running triangle or combination, then it may include a new high above its start at 1,200.67. A new high does not mean this correction is over. There is no upper invalidation point for this correction.
No. See my comment above.
For now I’m holding fast and not entering long, because the highest probability wave count sees this upwards move as wave B within an expanded flat
(it could also be a running triangle)
Lara thanks a lot for your insight.
Lara: Suggestion: Is it possible to have Wave Notation on the side bar open in a small new window so members can identify wave references correctly?
This will help us.
Every time I try to see which colour wave is minor, etc a new window opens.
I would suggest that you print it out in colour and have it beside you.
After a couple of weeks you’ll have it memorised.
The sidebar is crowded. And you’d be scrolling.
As for the expanding graphic idea… I’ve asked Cesar and he seems to think that is something he can do and should be relatively easy. Have passed on this suggestion to him.
Ahhh, a smile comes to my face. I remember the days when Lara first suggested that to me. It was motivation. Now I have it memorized! (I used a seperate open window at every session for quite a while.) If I can do it I’m sure you can do it. 🙂 Good luck.
Lara’s weekly chart shows gold at $1,600 not sure if timing is right at around May 2016? Time line may not be accurate. Even $1,600 this year would be amazingly bullish.
Lara might gold hit 1,600 this year?
That is a definite possibility.
Feb 4 th weekly chart do not show any gold target of 1600.
Can you post the chart???
You just looked at the Feb 4th weekly chart. That is the chart I am speaking about but there is no target. However there is a zigzag up to the top of super cyle (b) which must end above $1,920. The top of the first zig looks to be at about $1,600 and appears over May 2016 maybe it is Primary A.. The chart is not to scale time wise. I was just asking Lara if she could clarify $1600 as a possibility this year.
Richard
That yellow scribble is just the graphic. It does not represent any price expectation.
Do not read any thing from this line.
Let’s see what Lara says about 1,600 this year, thanks. Also in the daily chart today I am curious how high might the red A , Primary A get up to?
Exactly. It’s a wiggly arrow to show a three wave structure unfolding upwards.
Yes lara seems unlikely that correction is over..
RSI is way overbought..gold made a new high of 1207 just now…is ther any higher price level to considor for this correction is over..??..or gold requires to test the support once to considor it..??..
And also please require a small query in oil..
Thank u lara