
Downwards movement was expected for Friday’s session.
Price moved overall lower in a small inside day.
Summary: The trend is up. Corrections present opportunities to join the trend. Minute wave iv is most likely to continue for another two or four days. There is a possibility it could be over already within one day, but this requires confirmation with a clear five wave structure up on the hourly chart.
New updates to this analysis are in bold.
WEEKLY ELLIOTT WAVE COUNT
Click chart to enlarge.
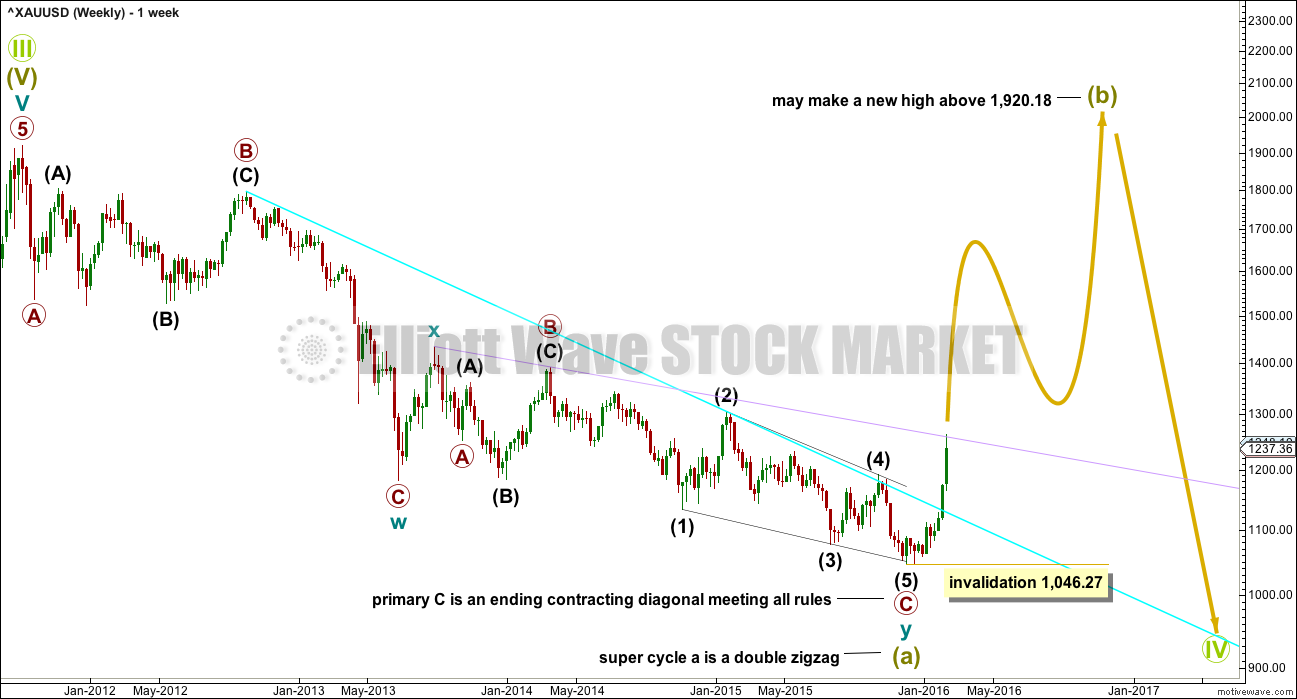
The cyan trend line is now breached by a full weekly candlestick above and not touching it. This gives substantial confidence that Gold has very likely changed from bear to bull.
This downwards movement subdivides as a double zigzag from the all time high.
Within the first zigzag labelled cycle wave w, primary wave C is 10.13 short of 1.618 the length of primary wave C.
Within the second zigzag labelled cycle wave y, there is no Fibonacci ratio between primary waves A and C. Primary wave C is an ending contracting diagonal which meets all Elliott wave rules.
For this downwards movement this is the only wave count that I have been able to see so far which meets all Elliott wave rules. I remain aware that Elliott Wave International and Danerics have this downwards movement as a five wave impulse which ends with a contracting diagonal for the fifth wave, but that wave count violates the rule for wave lengths within a contracting diagonal. I will keep that wave count in mind, but for now I do not want to publish a wave count which does not meet all Elliott wave rules as laid out in Frost and Prechter.
Grand Super Cycle wave IV may not be a combination because the first wave subdivides as a multiple, and the maximum number of corrective structures within a multiple is three. To label multiples within multiples increases the maximum beyond three, violating the rule.
It may not be a zigzag because Super Cycle wave (a) subdivides as a three and not a five.
This leaves two groups of corrective structures: flats or triangles.
Within an expanded flat or running triangle, Super Cycle wave (b) may make a new high above the start of Super Cycle wave (a) at 1,920.18.
Within a flat, Super Cycle wave (b) must retrace a minimum 90% of Super Cycle wave (a) at 1,833.71.
Super Cycle wave (b) may be any one of 23 possible corrective structures. First, a move of this size should have a clear five up on the daily and weekly charts. That is still to complete. Within the first five up, no second wave correction may move beyond its start below 1,046.27.
DAILY ELLIOTT WAVE COUNT
Click chart to enlarge.
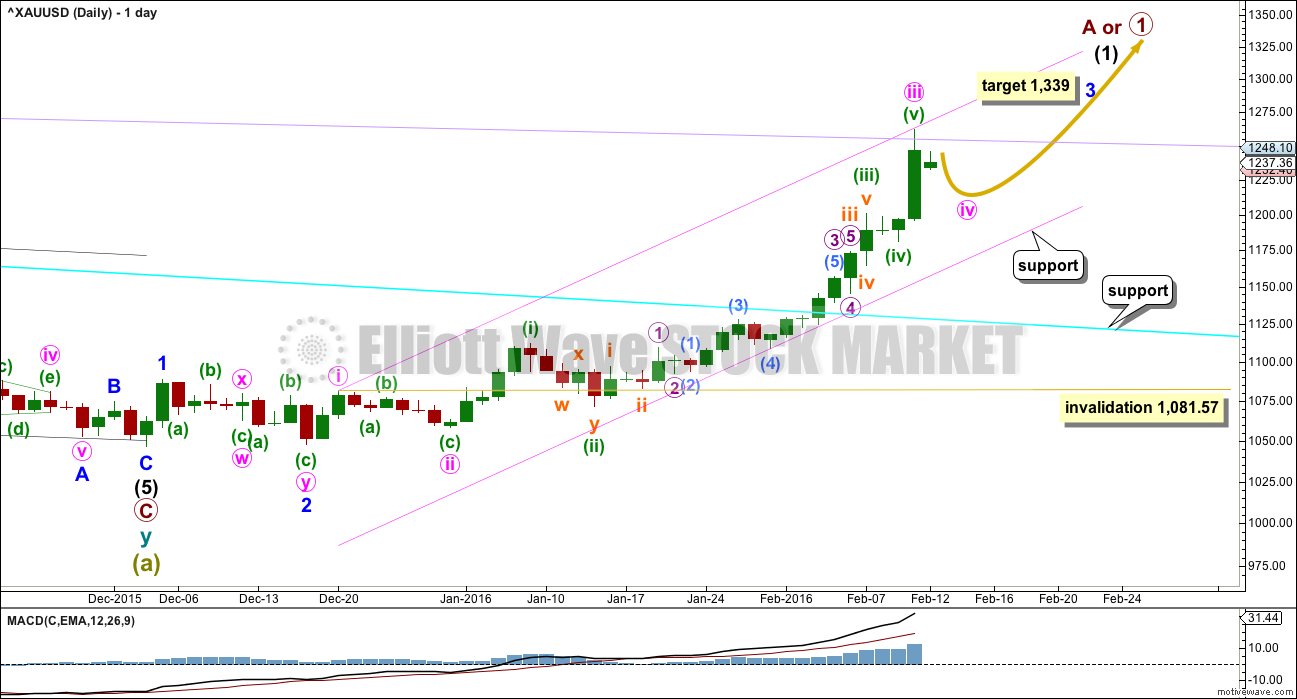
So far, within the first five up, the middle of the third wave is now most likely complete. The strongest move may still be ahead. Gold typically exhibits swift strong fifth waves to end its third wave impulses. Look out for surprises to the upside for minute wave v and minor wave 5.
At 1,339 minor wave 3 would reach 6.854 the length of minor wave 1. When minute wave iv is complete, then this target may also be calculated at minute degree. At that stage, it may widen to a zone or it may change.
Minute waves i, ii and now iii are complete within minor wave 3.
The fourth wave corrections are so far more brief and shallow than expected within this impulse unfolding upwards. This pattern may continue, which is why I say look out for surprises to the upside. Gold typically exhibits swift strong fifth waves to end its third wave impulses, and this often forces the fourth wave corrections which unfold right before to be over more quickly and be very shallow. It gives Gold’s impulses a curved look at a higher time frame.
The pink channel is a best fit. Draw the first trend line from the highs labeled minute waves i to iii then place a parallel copy lower to contain the whole upwards wave. Minute wave iv should find strong support at the lower edge if it gets that low.
Minute wave ii was a deep 0.68 zigzag. Minute wave iv should be shallow and may be a flat, combination or triangle most likely. Minute wave ii lasted 7 days. Minute wave iv may be over in a Fibonacci 3 or 5 days.
I have three hourly wave counts. These cover the main possibilities but not all that I can see. Other possibilities are noted where appropriate.
HOURLY WAVE COUNT
Click chart to enlarge.
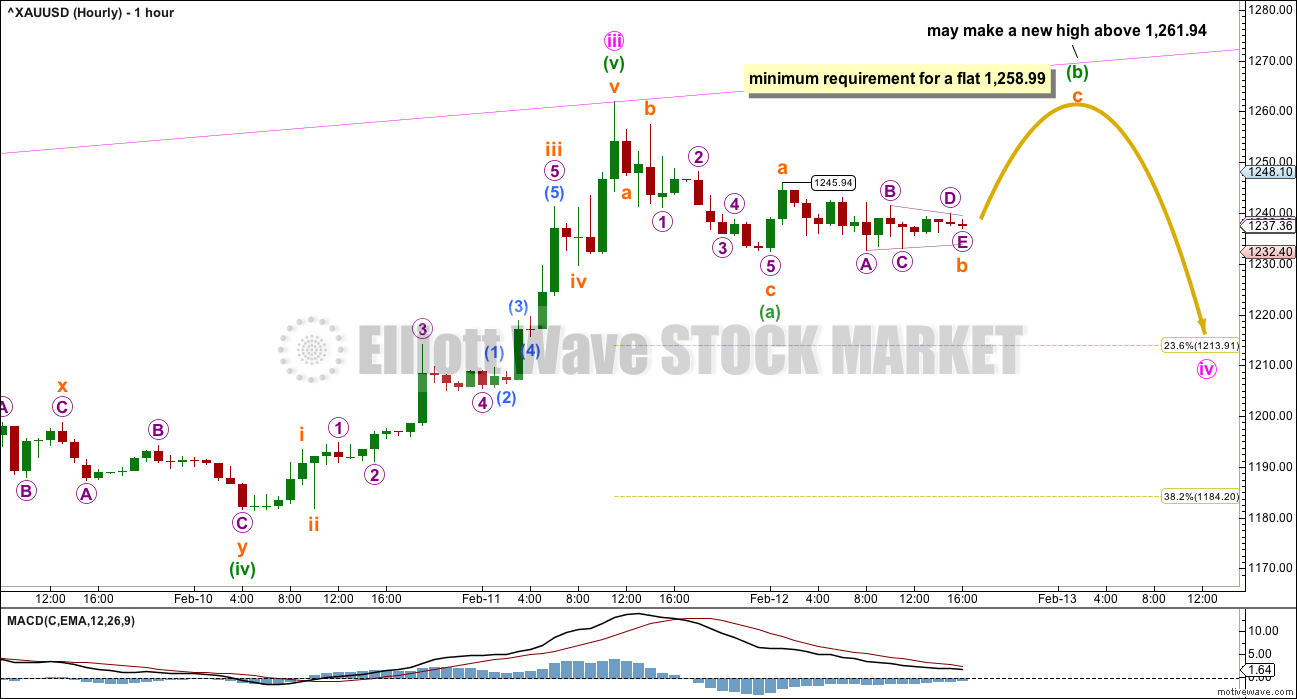
Minute wave ii was a deep 0.68 zigzag. Minute wave iv would most likely be a flat, combination or triangle. This first hourly wave count looks at the possibility of a flat unfolding.
The first wave subdivides as a three within a flat. Here, minuette wave (a) fits as a zigzag. Minuette wave (b) must retrace a minimum 90% of minuette wave (a) at 1,258.99. The most common type of flat is an expanded flat which would see minuette wave (b) move beyond the start of (a) above 1,258.99.
The maximum convention for a B wave within a flat is twice the length of the A wave. This would be at 1,291.47. A new high above that point would reduce the probability to so low that a flat correction is unfolding, so that at that point it should be discarded. If price moves strongly upwards in a five wave structure above 1,291.47, then minute wave iv would be over and minute wave v would be underway.
This wave count expects to see a five wave structure upwards for subminuette wave c to unfold early next week to complete the zigzag of minuette wave (b). If price moves higher in a five wave structure to 1,258.99 or above, and then turns down an makes a new low below 1,245.94, this wave count would be confirmed. At that stage, downwards movement could not be a fourth wave correction within a new impulse unfolding upwards, because price would be in first wave price territory (which would be the high labelled subminuette wave a).
This first hourly wave count has the highest probability based on structure and alternation. It expects another two or four days of sideways movement to complete the correction.
ALTERNATE HOURLY WAVE COUNT
Click chart to enlarge.
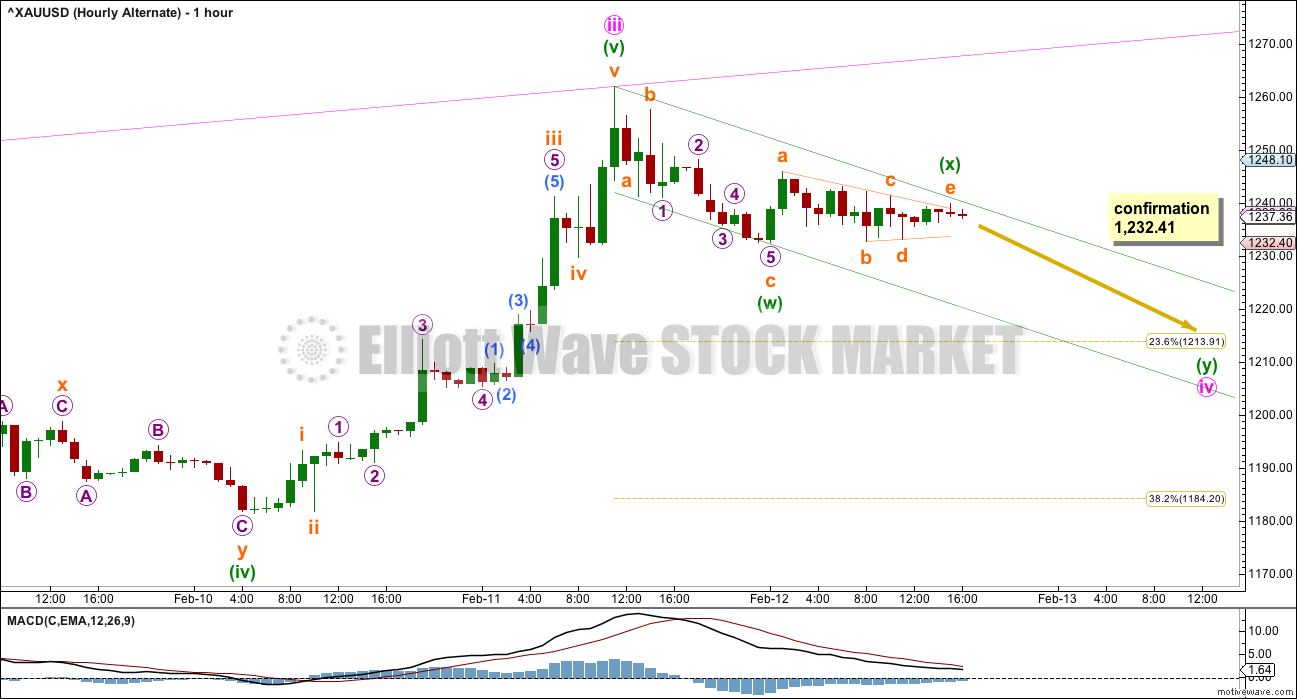
Minute wave iv may be an incomplete double zigzag. The first zigzag in the double is labelled minuette wave (w). The double may be joined by a “three” in the opposite direction labelled minuette wave (x) (triangles are counted as threes even though they have five subwaves).
The second zigzag in the double may take price lower and may reach down to the 0.236 Fibonacci ratio at 1,214.
This structure so far fits in a best fit channel. Minuette wave (y) may end about the lower edge of the channel.
Minuette wave (x) may also be relabelled as a zigzag with the triangle as wave B within it (for this idea see the main hourly chart for this piece of movement).
This first hourly wave count would see minute wave ii as a single zigzag and minute wave iv as a double zigzag. There would be alternation in depth but only a little alternation in structure. That is okay, alternation is a guideline and not a rule, but it does reduce the probability of this wave count.
SECOND ALTERNATE HOURLY WAVE COUNT
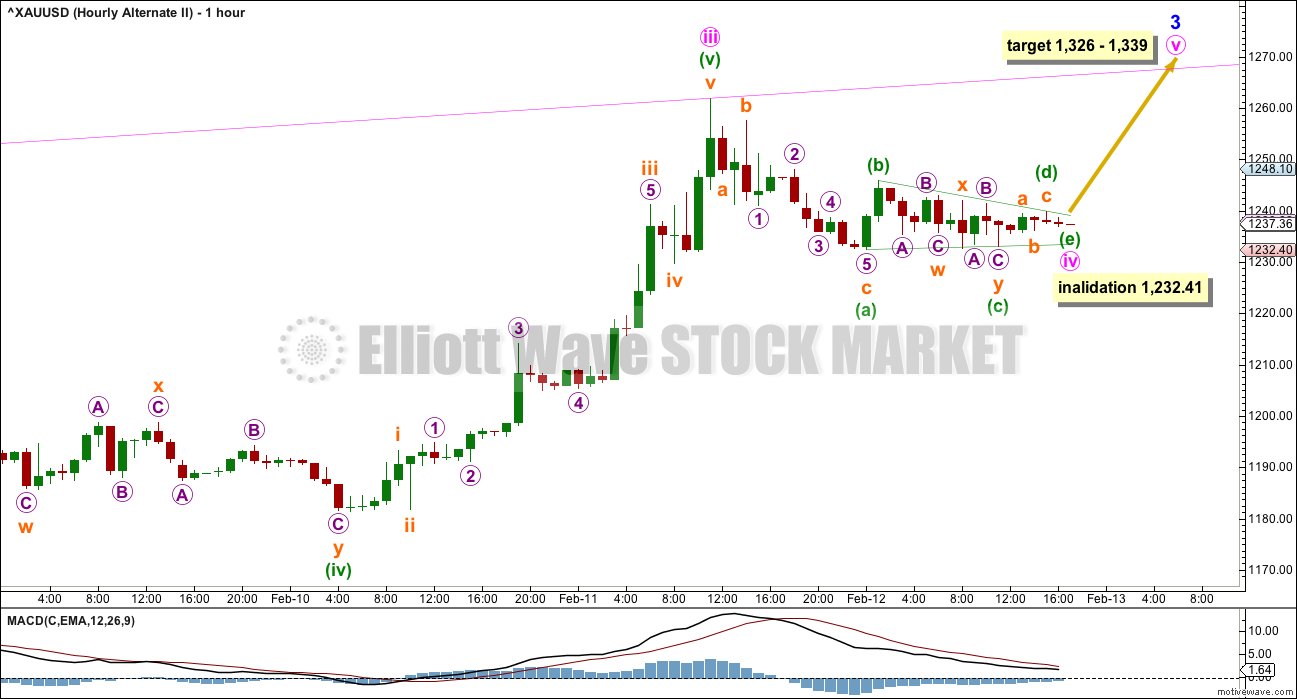
Click chart to enlarge.
It is possible that minute wave iv was over as a quick shallow triangle on Friday. All subwaves are complete and all rules for a regular contracting triangle are met.
If Monday sees a clear five wave structure up followed by a correction which remains above 1,245.94, then this wave count would be correct.
At 1,326 minute wave v would reach 2.618 the length of minute wave i. I am aware that the target range here is too large to be very useful. When there is more structure within minute wave v and it can be calculated at a third wave degree, then it may be narrowed down.
To the downside, if the triangle is incomplete and if minuette wave (c) is still to complete within it, then it may not move below the end of minuette wave (a) below 1,232.41.
A new low next week below 1,232.41 would provide strong price confirmation that the correction for minute wave iv is incomplete.
TECHNICAL ANALYSIS
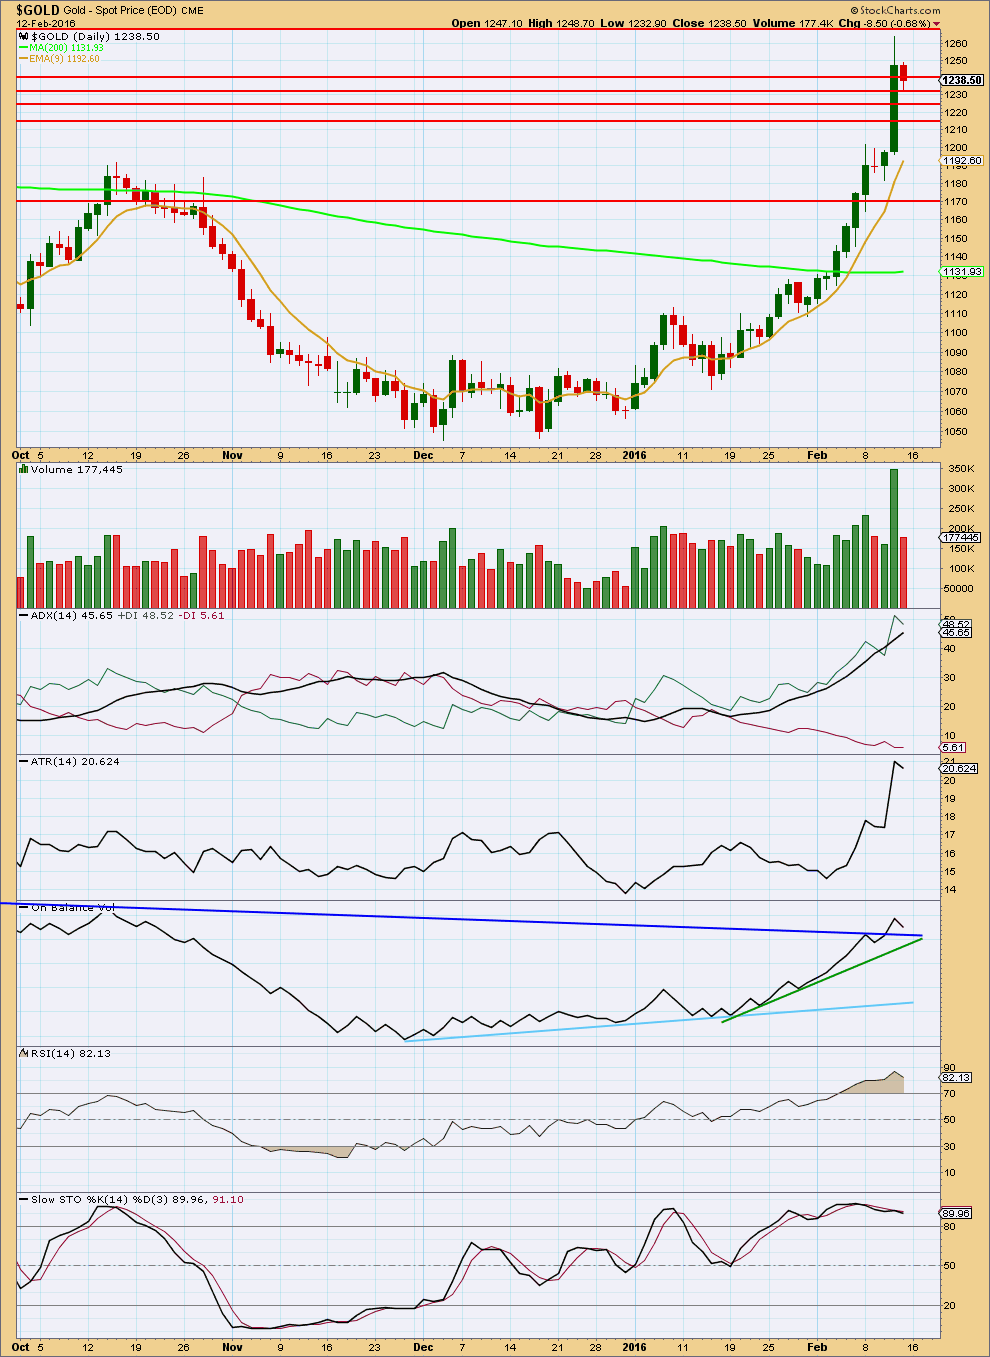
Click chart to enlarge. Chart courtesy of StockCharts.com.
A strong upwards day with a strong volume spike for Thursday looks like a typical blowoff top for Gold. Friday’s small red candlestick would most likely be just the first day of a correction to last about two to eight days.
I have taken some time to look back over price data back to December 2010. I have noted wide ranging days (a wide range compared to several days immediately prior) which completed a trend with a spike in volume and looked at how long the following correction lasted. This list is not exhaustive; it is the few that appeared to be clear from a visual identification. (I did not find any wide ranging days with volume spikes at the end of movements for the end of the last bull market from December 2010 to September 2011). Results are listed here:
Past wide ranging days with volume spikes at the end of movements:
Date, Price range, Volume (K), Result (any candlestick pattern?)
26 Sep 2011, $128.07, 150.3, 31 day correction (hammer)
4 Jan 2013, $38.19, 297.1, 12 day correction (hammer)
12 Apr 2013, $83.03, 24.4, low next day, 8 day correction
19 Jul 2013, $26.87, 222.1, 2 day correction
15 Oct 2013, $35.88, 298.9, 9 day correction (hammer)
18 Dec 2013, $28.23, 183.7, 5 day correction
19 Jul 2014, $45.65, 158.5, 5 day correction
My conclusion is that a wide ranging day at the end of a movement which has a volume spike should result in a correction lasting two to eight days. If the wide ranging day is also a single candlestick reversal pattern (a hammer in a downtrend, or a shooting star or hanging man in an uptrend), then the correction that follows it may be more long lasting.
In this instance for 11th February, 2016, the candlestick is not a reversal pattern, so a more brief correction looks most likely.
The decline in volume for Friday supports the Elliott wave count in that it expects this is a correction against the trend and not a new downwards trend. The fall in price was not supported by volume.
ADX is above 45 and rising. This indicates the trend is overextended, so a correction should be expected. This supports the Elliott wave count.
ATR is overall still rising. If the slight dip for Friday turns into a downwards move for ATR, then it would be indicating a correction is unfolding.
RSI is extreme overbought. A correction should be expected.
Stochastics shows divergence with price at the high. This also supports the idea of a correction unfolding here.
On Balance Volume may find support at the dark blue or green lines. If OBV finds support and turns up at either of those lines, then the correction may be over. If OBV breaks below these lines, then the correction may continue and may be deeper than the Elliott wave count expects.
Some horizontal support lines are added by looking back over the last 3 years for prior areas of support and resistance. The support lines in order are about 1,240, 1,230, 1,225, and 1,215. This general area saw a lot of price congestion back from October 2014 to October 2015.
This analysis is published @ 01:40 p.m. EST on 13th February, 2016.
This may be either a double zigzag downwards almost complete….
Or it could be a longer impulse downwards almost complete for just wave A of a larger correction.
We can now begin to draw a channel about this downwards movement: from the start to the end of wave (x) (alternate hourly wave count), then place a parallel copy on the low of (w). Downwards movement is now overshooting the lower edge of that channel.
I do not think this correction is over yet. The structure does not look complete.
There should be a B wave (or X wave) upwards within it, and then a C or Y wave down (or sideways). On the daily chart I would expect it to have a clear three wave look to it.
It looks like the 0.382 Fibonacci ratio at 1,184 may now be a reasonable target for it to end. And now I would expect it to last at least one more day to total a Fibonacci three, but it could yet continue for several more days to total a Fibonacci five or eight.
I will use a channel about this correction. When it is breached then I will have confidence it is over. Today it is incomplete.
What looks clear from volume analysis so far is this should be a correction against an upwards trend. If that is correct then it should end and the upwards trend should resume.
Thank you lara for your useful suggestion on my comment…thanks…
You’re welcome.
Trying to pick highs and lows often will not end well. It is wiser to wait for confirmation.
That way you reduce the number of losses. And so increase overall profits.
It does require more patience though.
In “Reminiscences of a Stock Operator” the comment is made that he was proud to have never caught a movement at the start and never exited at the end. He caught it after it had started and exited after it had ended.
So wait for confirmation a movement has begun, and wait for confirmation when it has ended.
One other thing I have been doing is looking at GLD Option Open Interest and the changes in open interest. Attached is a chart that shows the open interest in GLD as of 1/30 (in Blue) and the ADDED open interest in the subsequent 2 weeks (In Red). I am viewing the Red as the ‘late comers’, and that these positions will have the premium burned on them. Note the volume of open interest by strike. I am expecting GLD to be under 114 for 3/18 expiration, maybe as low as the 108 wall that is easy to see.
920K calls vs. 262K puts, 50K of those puts were added in the last 2 trading days. The PC Ratio for the March GLD expiration was hovering around 0.22.
Good Morning,
Attached is my COT analysis. We are right at 11 weeks with tomorrow’s COT measurement. The blue line hit about 150K, I expect it to be closer to 175K next COT report (because of the Holiday, I don’t think it comes out until Feb 22nd). My perspective is different from Lara’s at this point. My analysis is not intended to be trading advice. You are accountable for your own decisions.
I went full position in Dust on Friday close and I am full position on GLD puts. Based on the data I look at, the SWAPS have built a position on the short side with an average cost around 1180-1200. Historically, gold will achieve a level of 6% to 17% return in favor of the SWAP position. So at a minimum, I am expecting a correction to low 1100’s. But to fit with what normally plays out in their positions, I am looking for sub-1100.
Now, the only way this fits with Lara’s EW work is if we have a bunch of 4/5’s that are lost in the huge run, and we finished the first wave off of the low at 1263. Or, if the bear count is still alive and this was a C-wave.
I am looking for the low in this timing cycle to be between April Wk 1 and April Wk 4.
Good Luck Everyone,
Good stuff. I keep looking for a 5 down to confirm my views, which we may have already. Either way, I expect gold to move back up to at least 1238+ to fill a gap on the hourly chart. This same gap occurs in the USD, the S&P and other markets too. Perhaps that would be a 2nd wave.
Me too. A b-wave up to close the gap, then a c-wave down to the 1100 area possibly. For the c-wave down That would be 1.618 the length of the a wave assuming the b-wave tops around 1238 and the a wave ends around 1185. That would coincide with the 108 GLD area on the option chart I posted, and also put the swaps in the money by about 7%-9%.
Matt, one other thing, I think some funds got liquidated. We have SPX bottoming potentially while gold/bonds peaked in panic fashion. Because the short side of the COT was dominated by specs, my gut says some fund(s) was liquidated. Probably on the wrong side of a few positions.
I’ve been reason around about this potential but not banking on it.
Could well be.
Aside from the very short term filling of the gap, I expect stocks will stage a relief rally (within a larger bear market) to last several weeks/months. This, in turn, will snuff out the gold fire for a while.
It will be interesting to see where gold is at in Apr/May. That may be the next big reversal moment – either a final bear rally could begin here, before the final drop to new lows, or the beginning of the new gold bull could start. If gold only makes it to the 1130s/1140s by Apr/May, I would expect a bear rally. On the other hand, if it drops down to the 2015 low, then that may be it for downward movement.
PM sector may have bottom per two ratio charts.
XAU to Gold and Gold to CRB.
But to confirm gold and PM sector one more ratio needs to break out from a base: Silver to Gold ratio (SGR).
SGR has been the leader signalling the bull trend in PM sector for over hundred years.
After french revolution Napoleon fixed the gold to silver ratio (GSR) at 15 by decree.
Papudi, very interesting chart thank you.
A view: It appears the task ahead for Gold price is to be able to rise back up through 1216-1225 range…. At 1210-09 with daily RSI still tagging 70/70+, a break below 1198-97 looks imminent and then will remain to be seen if 1181 can hold else IMHO Gold price will likely enter 1198-1155 price zone….
Good 3 minute video by Carter Worth. Germany’s biggest bank is in trouble. Likely more down for stock markets and more up for gold.
http://www.cnbc.com/2016/02/12/recession-might-be-in-the-cards-if-historys-a-guide-analyst.html
Hi Lara..
Gold tested almost the target of alternate count…now what is that we must see to enter long..??
It depends on your risk appetite.
If you draw a trend line from the lows of 2nd Feb to 5th Feb you can see price is touching that now.
If this correction is going to be more brief and shallow then it could possibly be over now, it has hit that trend line.
The risk is that it could continue lower for another few days and your trade may have a few days of pain before it becomes positive. The invalidation point is a long way away at 1,081.57.
So far I can see a clear three down. It is so far coming on declining volume. This looks corrective. My analysis of what happens after a price spike on high volume suggests that a two, five or possibly eight day correction should result. Today is day two. It could end here.
On the hourly alternate draw a channel now about this possible double zigzag: from the start of (w) to the end of (x) with a copy on the end of (w). Price is now touching the lower edge. If you don’t mind a reasonable risk then entering long here may work well for you. But, understand that means picking the end of the correction.
I will wait for that channel to be breached upwards before having confidence the correction is over. I prefer lower risk. I would set my stop if that happens at the prior low.
Jose Canseco is making the news for predicting gold at $1500 by Memorial Day.
Time for a correction when Gold starts making too many headlines….
Opportunity to make more than 1000% in this upcoming bull market (BMR).
http://goldtadise.com/?p=362916#comment-19169
Plus take a look at Australian micro juniors now.
I have loaded some of them in the portfolio after Lara discarded bear count.
Top of the list is : Resolute Mining ASX.RSG.
ASX.MML
ASX.GRY
ASX.BDR
ASX.SLR
ASX.DRM
These are buy and hold.
Do your own due diligence.
Lara, thanks for the extra time in this analysis and the research into past similar wide range, high volume days. Also, wanted to say that I really admire your dedication to EW rules, even when other EW “pros” seem to ignore , misinterpret, or bend them. I know it’s going to take several or many years to confirm that Super Cycle wave a is in fact a “3” vs a “5” and that’s going to be a great validation when it occurs.
Dreamer
I am still learning EW.
How early one can determine wave (a) was 3 or 5?
In hindsight one should know now that wave was 3 or5 is it not??
If we see a new all time high then Super Cycle (a) must have been a three, it can’t be a five.
If we don’t see a new all time high then we may never know.
Hopefully the overall structure of Grand Supercycle IV will give us the answer, but as Lara states, we may not know if it’s ambiguous.
You’re welcome. It did take most of my Saturday which is why it was late.
And thanks for noticing I always stick to the rules in Frost and Prechter. Always.
It mystifies me that some of my critics say I make up my own rules… or that I don’t follow the rules. I have no idea where they get that from. Poor thinking skills?
I got a really good laugh from your comment, “Poor thinking skills?”
Good to know you go by the book/rules with your EW analysis.
My sense of humour is rather dry. Nice to see you get it Richard 🙂
Gold COT data bearish leaning. Several days of correction or deep correction???
Close of today COT data has blown to high short position for large commercial.
Commercial short increased 72,796 contracts.
Net shorts increased 131,630 which is 20% of total open interest.
Compare the data with gold bottom on 12/04/2105 to todays data:
02/12/2016 Commercial shorts 340,796 (+72850) Net Shorts+131,630, Gold close:1238
12/04/2016 Commercial shorts 225,105 (-6370) Net Shorts +7050, Gold close:1084
Today’s COT data compared to May 2015 top is similar and indicating temporary top here.
Great chart. It confirms why I remain bearish, despite the majority now turning bullish.
It’s a brave call to be bearish at the moment Matt! I can see why you might be somewhat bearish but would be interested to know what you anticipate.
Do you believe we are in a late 1999 type situation where the stock market needs to get its panics over with first? In other words we have a 12-18 months wait before things really take off. Or do you believe we are heading substantially sub $1000 in the near future?
Lara Great analysis. I am with you on this forecast.
TA portion:”12 Apr 2013, $83.03, 24.4, low next day, 8 day correction”
The data Needs correction.
I checked the price of those days. Those three days trading is etched in my memory where gold began bear market.
Apr 11 Gold closed at $ 1560.50
Apr 12 2013 Price dropped $80 vol 352,248 big red candle (Friday)
Apr15 2013 price dropped $129 vol 656,794 huge red candle
Apr 16 white candle doji lower price and followed with 13 days correction.
Those three days were like 1929 crash in gold.
http://stockcharts.com/h-sc/ui?s=%24GOLD&p=D&st=2013-02-13&en=2013-12-30&id=p07400908927
Yes, indeed.
Now the problem with technical analysis is that we can look back at past behaviour and use that to inform us of most likely future behaviour.
But it does not mean that the future must be the same.
Sometimes its different.
It’s all an exercise based in probability.
Because that is what happened before it means it is most likely to happen again, but it doesn’t have to.
I wanted to see what the probability of a multi week correction was vs the probability of just a few days. Turns out a few days is more likely.
Awesome, so we need to buy in this week for the run up.
“I wanted to see what the probability of a multi week correction was vs the probability of just a few days. Turns out a few days is more likely.”
Sorry, I should have said 15th April. Not 12th.
I was looking at that huge downwards move which ended on a volume spike.
Hi Lara,
Do you have a timeframe for the market reaching 1600? 1920+? I see that your zig zag lasts about a year on the chart but I don’t know if that is your intent.
Also there was a nice article that may help us determine what the commercial tipping point is on gold-eagle. It shows commercials at peaks during the bear market and during the bull market. I think the author is Chan.
Regards
The wiggly line on the weekly chart is only intended to show a three wave movement upwards for super cycle wave (b).
The height of the first part is not intended to show where that may end.
I cannot make a calculation for where cycle wave a may end until primary waves 3 and 4 or primary waves A and B within it have completed. That is still many months to a year or more away.
I can make a very vague guess. That is all the wiggly line can indicate.
Cycle wave a should last one to several years. If super cycle (b) is a zigzag (most likely) then cycle a within it would most likely be about a year.