
Again, I have three hourly wave counts.
Volume is used to indicate which is most likely.
Summary: Minute wave iv may be over. As long as price remains above 1,216.92, this should be expected to be the most likely scenario. The target for a strong fifth wave up is at 1,317. If the target is wrong, it may not be high enough. A new low below 1,216.92 would indicate that the fourth wave correction is continuing; the target then for downward movement to end would be at 1,184 and price should find strong support at the pink channel. Any long entries here should manage risk carefully. The risk is price may yet turn down to make a new low before the upwards trend resumes. Only when there is a clear five up on the hourly chart would that risk be substantially reduced.
New updates to this analysis are in bold.
Last published weekly chart is here.
DAILY ELLIOTT WAVE COUNT
Click chart to enlarge.
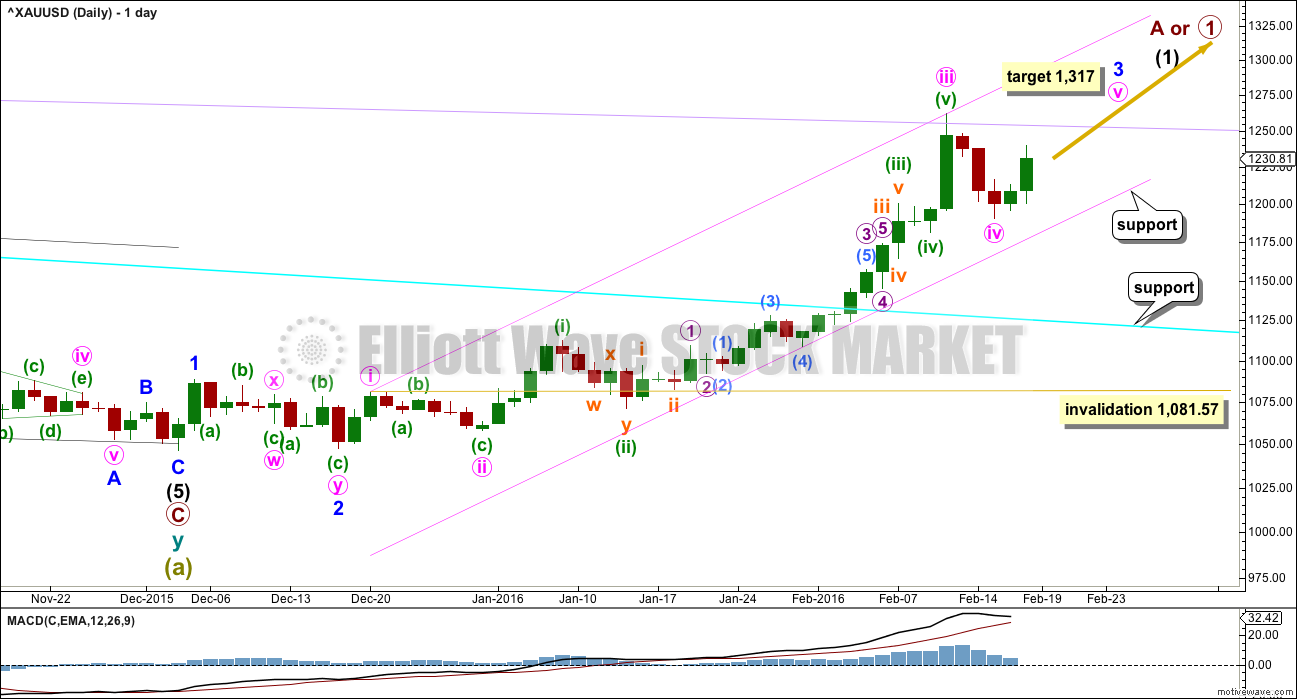
The cyan trend line is now breached by a full weekly candlestick above and not touching it. This gives substantial confidence that Gold has very likely changed from bear to bull.
So far, within the first five up, the middle of the third wave is now most likely complete. The strongest move may still be ahead. Gold typically exhibits swift strong fifth waves to end its third wave impulses. Look out for surprises to the upside for minute wave v and minor wave 5.
At 1,317 minute wave v would reach 0.618 the length of minute wave iii.
Minute waves i, ii and now iii are complete within minor wave 3.
The fourth wave corrections are so far more brief and shallow than expected within this impulse unfolding upwards. This pattern may continue, which is why I say look out for surprises to the upside. Gold typically exhibits swift strong fifth waves to end its third wave impulses, and this often forces the fourth wave corrections which unfold right before to be over more quickly and be very shallow. It gives Gold’s impulses a curved look at a higher time frame.
The pink channel is a best fit. Draw the first trend line from the highs labeled minute waves i to iii then place a parallel copy lower to contain the whole upwards wave. If the alternate hourly wave counts (either of them) are proven to be correct, then look for price to find strong support at the lower edge of this channel.
Minute wave ii was a deep 0.68 zigzag. Minute wave iv may be complete as a more shallow 0.35 double zigzag. There is alternation in depth but only a little alternation in structure. If it continues any further, then minute wave iv may not move into minute wave i price territory below 1,081.57.
MAIN HOURLY WAVE COUNT
Click chart to enlarge.
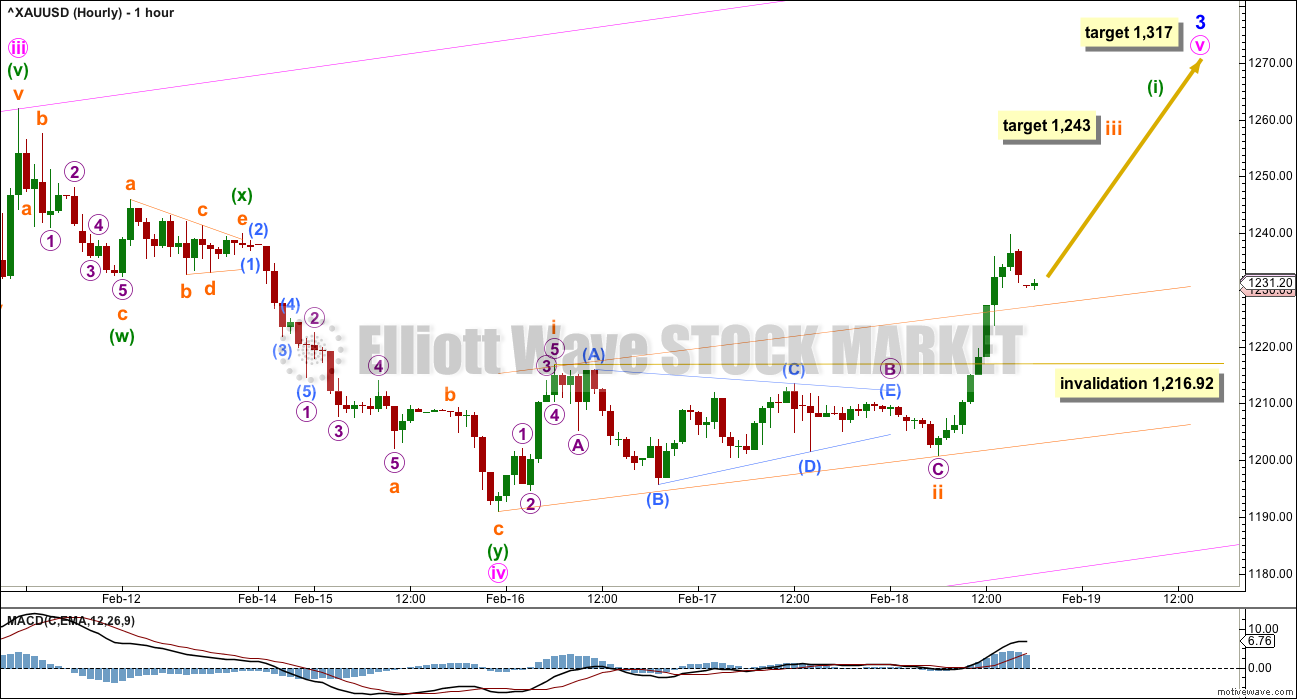
Today, because upwards movement comes with some increase in volume, this is the main wave count.
Minute wave iv may be over as a brief shallow double zigzag. Minute wave v is a fifth wave to end a third wave impulse. These are often surprisingly swift and strong for Gold. Look out for surprises to the upside.
So far the first five up is incomplete within minute wave v. When minuette wave (i) is a complete impulse, then I would have full confidence in this wave count and would move the invalidation point on the daily chart up to the end of minute wave iv.
So far subminuette waves i and ii are complete within minuette wave (i). At 1,243 subminuette wave iii would reach 1.618 the length of subminuette wave i.
Subminuette wave iv may not move into subminuette wave i price territory below 1,216.92.
Subminuette wave ii unfolded as a deep zigzag. Within Subminuette wave ii, the triangle was micro wave B, a running contracting triangle. Micro wave C ends below the end of micro wave A, it is not truncated, and it did not move below the price territory of micro wave B.
The orange channel is a base channel about subminuette waves i and ii. Price may find support there now that the upper edge has been breached. If price moves below the upper orange line, then the probability of the alternate wave counts would slightly increase.
ALTERNATE HOURLY WAVE COUNT
Click chart to enlarge.
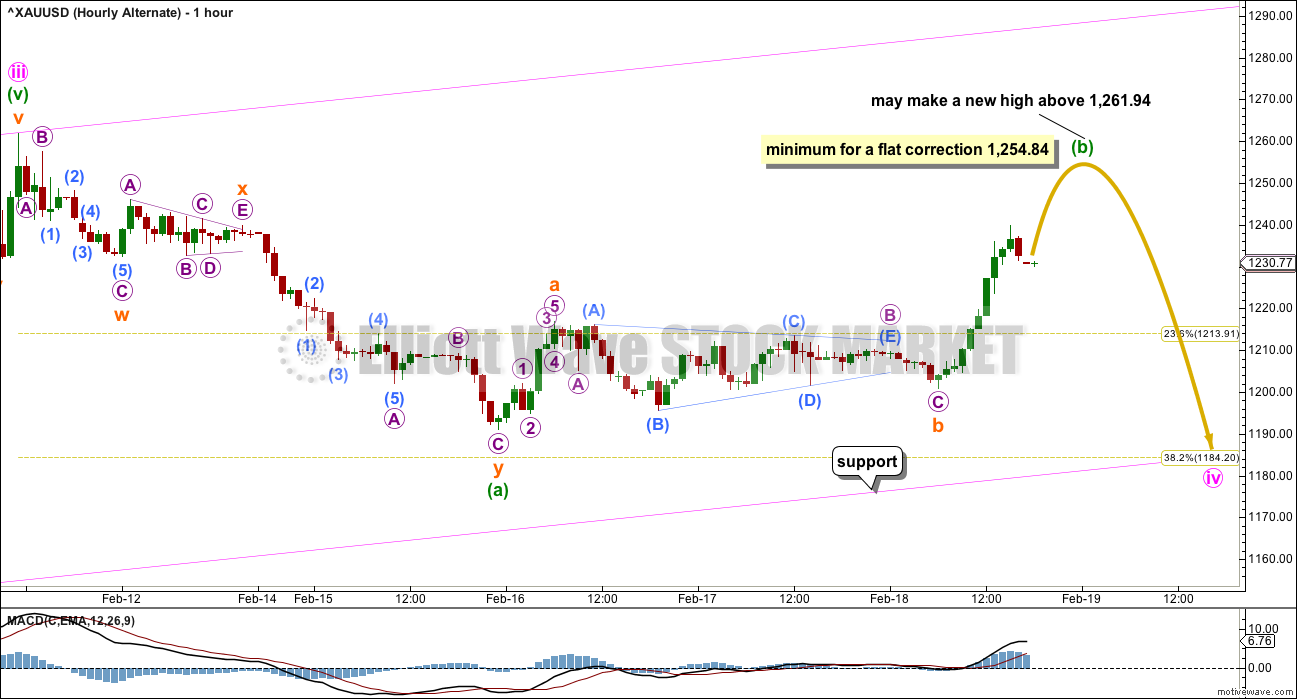
It is still possible that minute wave iv is an incomplete flat correction. This an alternate wave count only because today’s upwards day shows some increase in volume.
Within a flat correction, minuette wave (b) must retrace a minimum 90% of minuette wave (a) at 1,254.84. It may also make a new high above the start of minuette wave (a) at 1,261.94 as in an expanded flat.
When minuette wave (b) is a complete zigzag and has met the minimum requirement at or above 1,254.84, then a target may be calculated for minuette wave (c) downwards. For now the target will remain the 0.382 Fibonacci ratio at 1,184.
The structure of subminuette wave b is seen in the same way as subminuette wave ii for the main hourly wave count.
SECOND ALTERNATE HOURLY WAVE COUNT
Click chart to enlarge.
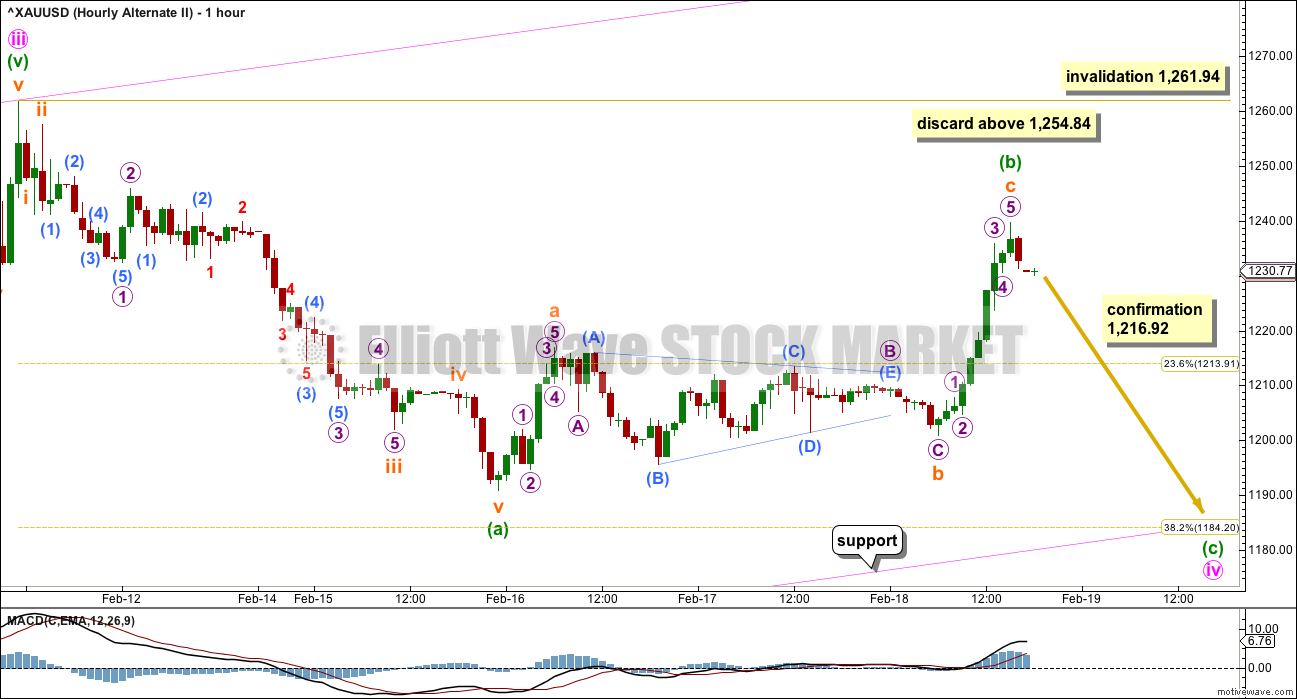
What if my analysis of the downwards wave labelled here minuette wave (a) is wrong for the first two hourly wave counts? What if it was not a double zigzag but was an impulse?
Zigzags and impulses often have a very similar look. Both possibilities must be considered.
I have slightly resolved the problem of yesterday within the first piece of downwards movement from the last high. This has a better fit today.
If a single zigzag is completing for minute wave iv, there would still be inadequate alternation between minute waves ii and iv. There would be alternation in depth but not structure. A new low below 1,216.92 would invalidate the main hourly wave count and confirm this alternate. If price has not reached to 1,254.84 first, then the first alternate would also be invalid, leaving only this one wave count.
This wave count expects a little more downwards movement to end about 1,184, if minute wave iv is to end at the 0.382 Fibonacci ratio and find support at the pink trend line.
If price does come back down to touch that pink line, it should provide a high probability set up for a long entry.
TECHNICAL ANALYSIS
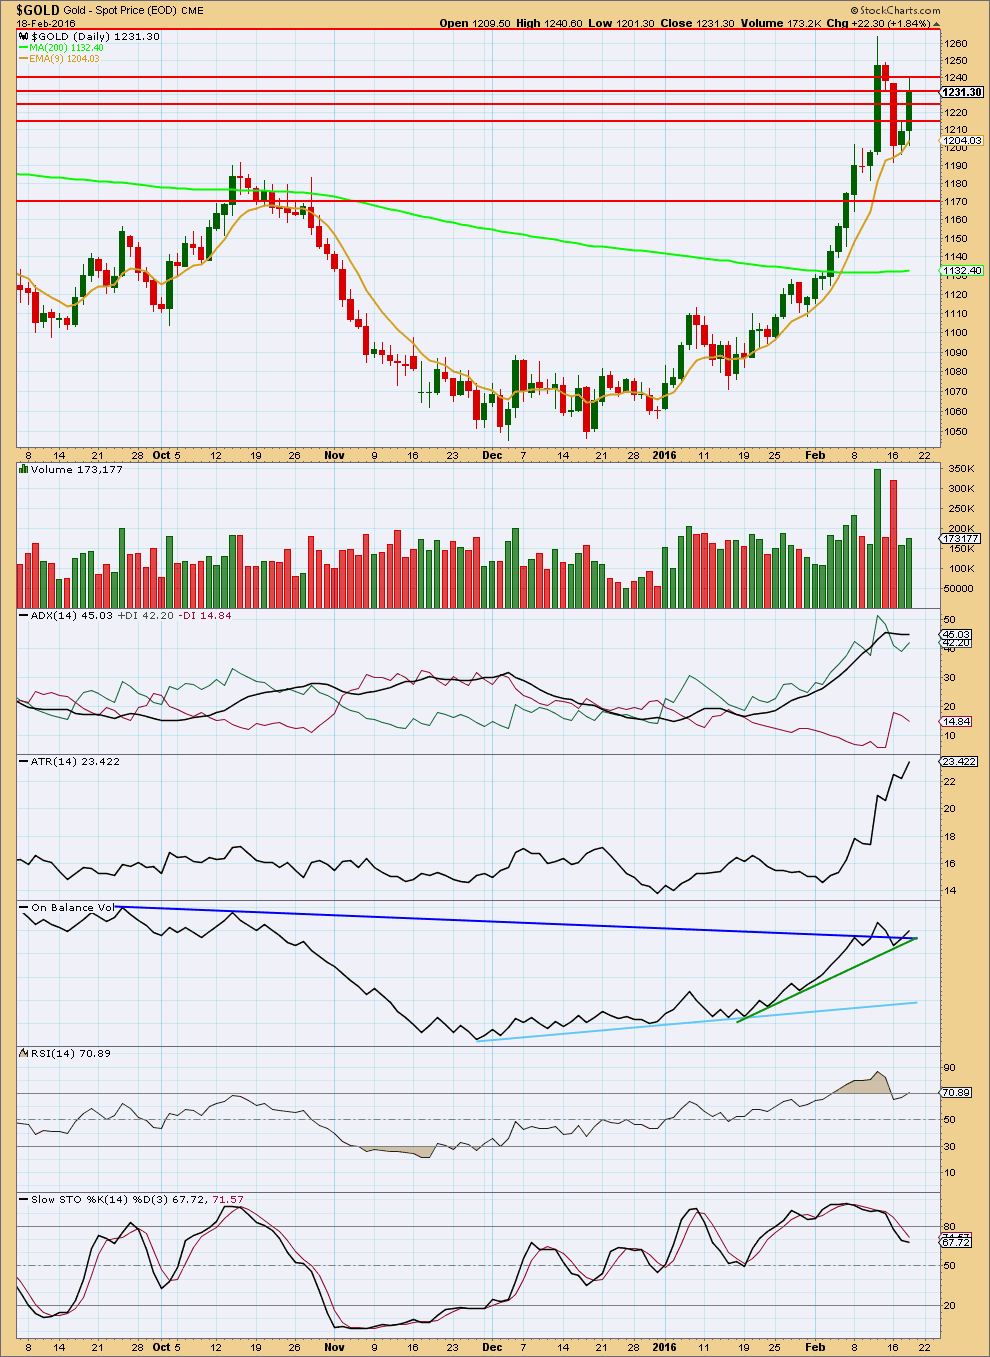
Click chart to enlarge. Chart courtesy of StockCharts.com.
A stronger upwards day comes with some increase in volume. This provides some support to the main Elliott wave count. The rise in price was supported by volume. Overall, volume remains relatively light, so the risk remains that price may yet turn down to complete the consolidation before it is done. We have not yet had a clear breakout of this consolidation. That would only come with a new high on an upwards day, and preferably with an increase in volume.
Price is so far finding support at the 9 day Exponential Moving Average, as it tends to do when Gold is trending.
ADX is flat. It indicates the market is consolidating. This does not support the main Elliott wave count. ADX is a lagging indicator.
ATR disagrees as it is increasing. This supports the main hourly Elliott wave count.
On Balance Volume has found support at the short term green line, and now broken above the dark blue line again. This supports the main Elliott wave count.
RSI is not yet overbought. Only when price makes a new high and shows divergence with RSI should an end to upwards movement be expected.
Stochastics is not overbought. There is room for price to rise.
I have taken some time to look back over price data back to December 2010. I have noted wide ranging days (a wide range compared to several days immediately prior) which completed a trend with a spike in volume and looked at how long the following correction lasted. This list is not exhaustive; it is the few that appeared to be clear from a visual identification. (I did not find any wide ranging days with volume spikes at the end of movements for the end of the last bull market from December 2010 to September 2011). Results are listed here:
Past wide ranging days with volume spikes at the end of movements:
Date, Price range, Volume (K), Result (any candlestick pattern?)
26 Sep 2011, $128.07, 150.3, 31 day correction (hammer)
4 Jan 2013, $38.19, 297.1, 12 day correction (hammer)
15 Apr 2013, $83.03, 24.4, low next day, 8 day correction
19 Jul 2013, $26.87, 222.1, 2 day correction
15 Oct 2013, $35.88, 298.9, 9 day correction (hammer)
18 Dec 2013, $28.23, 183.7, 5 day correction
19 Jul 2014, $45.65, 158.5, 5 day correction
My conclusion is that a wide ranging day at the end of a movement which has a volume spike should result in a correction lasting two to eight days. If the wide ranging day is also a single candlestick reversal pattern (a hammer in a downtrend, or a shooting star or hanging man in an uptrend), then the correction that follows it may be more long lasting.
In this instance for 11th February, 2016, the candlestick is not a reversal pattern, so a more brief correction looks most likely.
This analysis is published @ 07:50 p.m. EST.
Anyone notice the similarity between the weekly candle following the Jan 2015 high and this week? If the pattern continues like then, next week could bring a strong down movement. Big increase in COT commercial shorts on Tuesday.
I’m looking now at stockcharts gold and it was the same candlestick the week after Jan 2015 high and last week high
It took 11 weeks to reach January 2015 high and 12 weeks to reach last week high.
This time the RSI and MACD went higher also this time it went two weeks above the 50 DMA and 2015 only 1 week above 50 DMA.
Makes me question how much consolidation we’ll get after today and how bullish gold really is?
Gold looks like it is breaking out Down Now 3:07 pm
Lara, a brief comment on oil would be appreciated. Thanks
Done
“The risk is price may yet turn down to make a new low before the upwards trend resumes. Only when there is a clear five up on the hourly chart would that risk be substantially reduced.”
Sorry for my ignorance, I’m very new to Elliott Wave, so just to make this clear, is Lara saying that if gold doesn’t go to $1317 soon, it may drop down to $1000?
No.
What I mean by a five up is a five wave structure that you can count as 1-2-3-4-5 on the hourly chart. That should happen well before 1,317.
It would be labelled minuette wave (i). The first wave of minute wave v.
While we do not have that then the risk is that the consolidation isn’t over, and another downwards swing may happen before the trend resumes.
Elliott wave is fractal, so think of it like Russian dolls. When the smaller wave of minuette (i) is clear then we know what set of dolls we’re playing with 🙂
I hope my analogy makes sense and doesn’t confuse the issue.
Lara to see wave 4 as a triangle…which is the point from where we can draw a channel..??..
Had you ever worked on Natural Gas chart lara..??
I havent found any usefull NG chart yet..
🙂
Your first question will be answered in next analysis. I’ll be charting the triangle idea.
Second question, I’ve never done an analysis of Gas. And I’m probably not going to.
Thank u 🙂
I think I will now need to chart the possibility that minute wave iv is continuing sideways as a triangle.
If MACD begins to hover about the zero line then that would be very likely.
All three wave counts will remain viable while price is above 1,216.92.
We still need a five up, which has to be clearly a five and not a three, to confirm that minute iv is indeed over.
So far todays candlestick is green. If it shows again increased volume that would support the main hourly wave count. If it shows decreased volume that would favour the alternate hourly wave counts. If that happens I think I’ll stop trying to figure out which is more likely and just label them 1, 2, 3. And maybe 4. And then let price tell us which one is correct, or wait until volume is clear and one is more likely.
GDX right now has MACD sell 1,3,5,15 and 39 minute time frames. They can and do change throughout the day. Yesterday at 8 am GDX 195, 78 and 39 minutes were all a BUY which was a strong signal.
I’m just not sure those signals are reliable.
Like moving averages, in a consolidating market they’ll whipsaw.
So I think you need to add something to such a system to differentiate a consolidating market from a trending market.
I do combine the MACD with 4 other advanced indicators and see 4 time frames on the same monitor, 1,3,5,and 15 minute then can look at other longer times during the day. Also have up the GDX and a compare with line to see real time what gold is doing. It was set up by one of the top traders in the world then he gave it to me with an oath of secrecy.
Brilliant!
Opinion: Expect gold prices to be massively volatile
Feb 19, 2016 8:56 a.m. ET
Sentiment is simply unfavorable for the yellow metal
Hulbert Gold Newsletter Sentiment Index, or HGNSI
http://www.marketwatch.com/story/expect-gold-prices-to-be-massively-volatile-2016-02-19
I will wait for COT data today after the close. It is risky to stay long or enter long here.
According to MTSLD chart on cot today is week 11. Normally gold turns down with bearish COT data which supports Lara’s second alt wave.
I confess I got out of miners too early. It is the beginning of the BMR for several years. There will be many opportunity to go long and stay long in the near future.
Lara: “The risk is price may yet turn down to make a new low before the upwards trend resumes. Only when there is a clear five up on the hourly chart would that risk be substantially reduced.”
My 2 cents????
This kind of huge retracement of almost 18$ in a swift and strong 5th wave looks unusual…
Gold is confusing a lot
I agree. Price is not behaving as expected for the main wave count so far.
My judgement for the main wave count was based on StockCharts data showing an increase in volume for Thursdays session. Volume is a very useful indicator and is most often reliable, but not always. It is not definitive.
There are two alternate wave counts which may still be correct.
Until we have a clear five up it will not be confirmed that the correction is over.
Mind you… while price remains above 1,216.92 this downward move could still be a fourth wave.
Price is the ultimate determinator.
Yess lara..
🙂
… not expecting gold price to get below its pivot/1223-22, long and seeking upside target range 124x-126x; just a matter of time when 50dma gets above 100dma for a bullish crossover….
Gold dropped to 1219.99 at 5:02 am that is below the pivot.
Top 10 miners in GDX. YTD returns and % of GDX. Looks like a bull market!
Bullish bet on Barrick Gold. ABX is the largest holding of GDX at 7.83%.
An extract below from Rick Ackerman’s commentary on gold. Bears especially pay heed.
…While we kept the $815 target in the back of our minds as gold fell, we were ready to put our skepticism aside if the hourly chart turned bullish. This time, however, I am being especially cautious – not out of fear that I will overestimate the rally’s power and longevity, but that I will underestimate it…
…Whatever happens, it was predictable all along than any bull market in gold would develop in such a way as to leave even bullion’s most devoted supporters skeptical. Assuming the rally continues to make its way higher by fits and starts, on low volume and without a sustained push, you should start asking yourself now whether you might be in the group of war-weary gold bugs that the bull is trying hardest to fool.
Lara
Here is a screenshot of gold /GC and MACDTwoLines (3, 10, 16, EXPONENTIAL) at 78 minute time frame on the TOS platform.
MACDTwoLines (3, 10, 16, EXPONENTIAL)
It gave a Buy today at 8 am and peaked at 3 pm
First upload of a chart I’ve done here. Live and learn.
GDX – Daily, 195, 78 and 39 minutes charts. 39 Fired buy at 530 am, 195,78, 39 minute all MACD Buys at 8 am EST this morning for bullish all day.
I missed seeing these signals this morning for an all day bullish event GDX and would of been NUGT also. These long time frames are very strong signs when they fire.
Thank you Richard. That looks like a pretty good signal.
I would use it in conjunction with ADX to indicate a trending market, because it looks like the MACD signals lines whipsaw when the market is consolidating.
Adding ADX on the same timeframe may make it a little more reliable?
Richard which indicator is in the bottom panel????
Is this weekly chart?
MACDTwoLines (3, 10, 16, EXPONENTIAL) at 78 minute time frame is in bottom.
On TOS platform you can use any time frame you want even custom.
I often look at month, week, day, and minutes, 195,78,39,15,5,3,1 minute
Thanks. Stockcharts does not provide this MACD. Plus do not have intra time period choices.
Thanks for posting.
You can get TOS -Think or Swim Trading Platform for free at TD Ameritrade or TD Waterhouse on line in real time with 100 indicators to chose from.
Free for paper trading and I trade with different broker.