
The correction so far is unfolding as the main hourly Elliott wave count expects.
Summary: The correction may end in just one more day, if it is to total a Fibonacci thirteen daily candlesticks. One more day of sideways movement could see it end. The next wave up may be surprisingly short at only about $34 in length.
New updates to this analysis are in bold.
Last published weekly chart is here.
DAILY ELLIOTT WAVE COUNT
Click chart to enlarge.
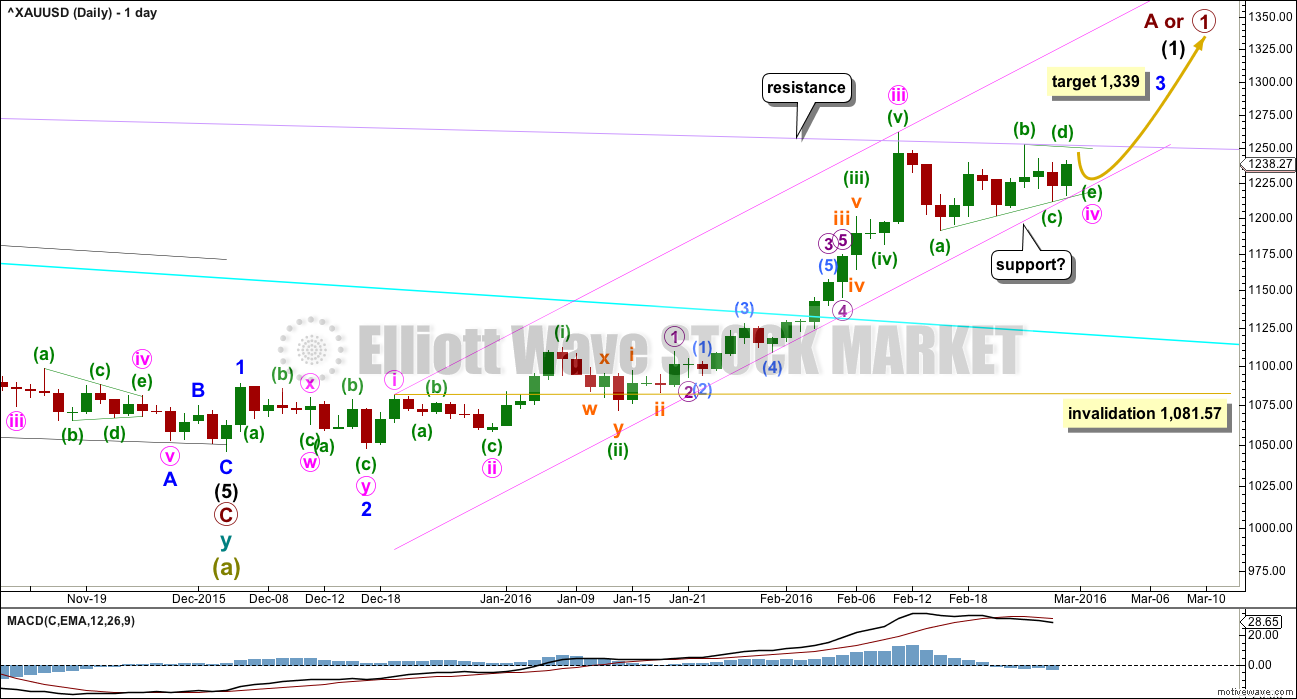
Gold has very likely changed from bear to bull.
So far, within the first five up, the middle of the third wave is now most likely complete. The strongest move may still be ahead. Gold typically exhibits swift strong fifth waves to end its third wave impulses. Look out for surprises to the upside for minute wave v and minor wave 5.
At 1,339 minor wave 3 would reach 6.854 the length of minor wave 1. When minute wave iv is confirmed as over, then this target may be calculated at a second degree. At that stage, it may widen to a zone, it may change, or a second target may be added.
Minute waves i, ii and now iii are complete within minor wave 3.
The pink channel is a best fit. Draw the first trend line from the highs labeled minute waves i to iii then place a parallel copy lower to contain the whole upwards wave. Minute wave iv may find support at the lower pink line. If price touches that line, it should offer a low risk entry point to join the upwards trend.
The main hourly wave count now expects a triangle is most likely unfolding sideways. Upwards movement is finding resistance at the lilac line and downwards movement is finding support at the (a)-(c) triangle trend line. To see how to draw the lilac line see the weekly chart here.
If the main hourly wave count is correct and Gold continues sideways to complete a triangle, then the following fifth wave may not be a strong extension and may be surprisingly short. Gold often exhibits very short quick fifth waves after its fourth wave triangles. The target for minor wave 3 at 1,339 may be too high. When minute wave iv is complete, if it is a triangle, then the target will probably be recalculated. If minute wave v is just 33.88 in length, which would be the most likely length, then at that point it would reach equality in length with minute wave i.
If the alternate hourly wave count is correct, then the lower pink trend line may be breached. Sometimes fourth waves are not contained nicely within channels; sometimes they breach channels.
Minute wave iv may not move into minute wave i price territory below 1,081.57.
MAIN HOURLY WAVE COUNT
Click chart to enlarge.
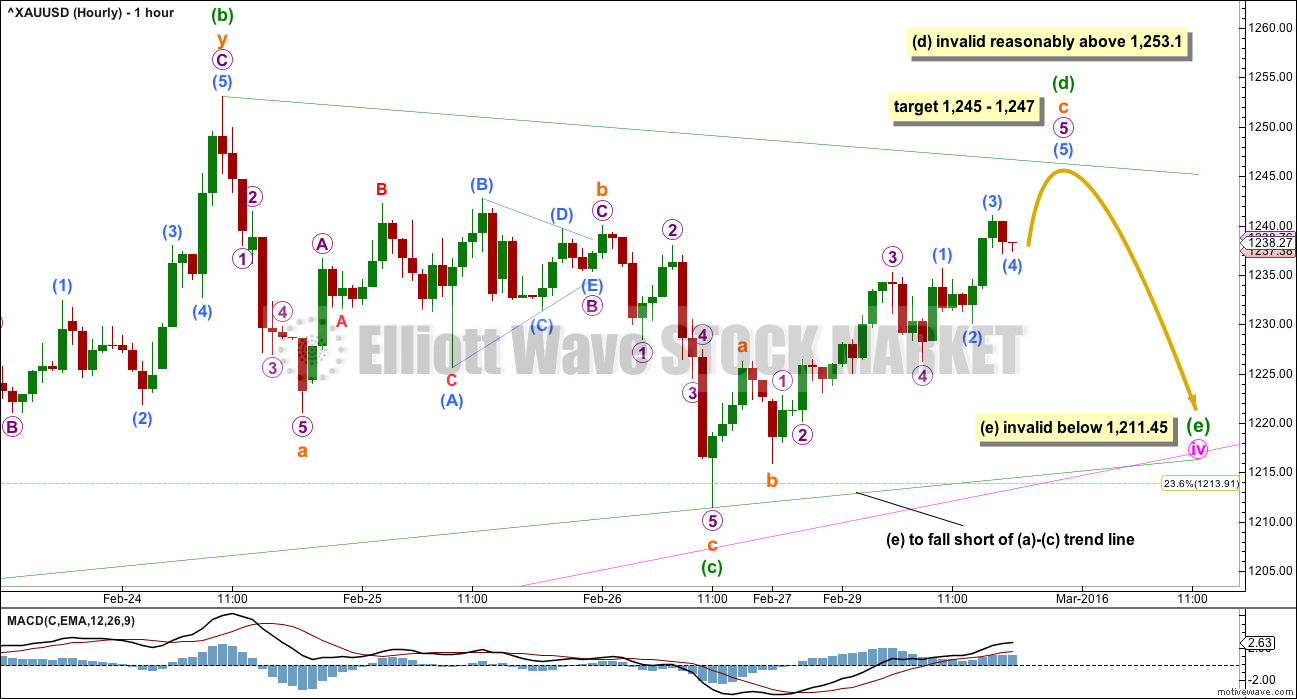
This main hourly wave count expects to see alternation in structure between the zigzag of minute wave ii and the triangle of minute wave iv. This is the main wave count mostly for this reason.
Minuette wave (b) subdivides as a double zigzag. Minuette wave (a) may be seen as a single zigzag. Minuette wave (b) is less than 0.9 the length of minuette wave (a), so a flat correction is not possible as the minimum requirement was not met. A triangle may still be unfolding sideways.
The triangle may be a regular contracting or regular barrier triangle. The rule for minuette wave (d) is slightly different for each type of triangle.
If minute wave iv is a regular contracting triangle (more common), then minuette wave (d) may not move beyond the end of minuette wave (b) above 1,253.10.
If minute wave iv is a regular barrier triangle, then minuette wave (d) should end about the same level of minuette wave (b) at 1,253.10, so that the (b)-(d) trend line is essentially flat. What this means in practice is minuette wave (d) may end slightly above 1,253.10. This invalidation point is not black and white. This is the only Elliott wave rule which has any grey area.
I have found a fairly reliable wave length for triangle subwaves to be about 0.8 to 0.85 the length of the prior wave. This gives a target for minuette wave (d) to end about 1,245 – 1,247.
Thereafter, a small final zigzag down would be required to complete minuette wave (e) as the last subwave. It would most likely fall short of the (a)-(c) triangle trend line, but if it does not end there then expect it to slightly overshoot the trend line.
As soon as minuette wave (e) looks complete, and particularly if price again touches either the lower green triangle trend line or the lower pink trend line, that may offer a low risk entry point for a long position. However, if minuette wave (e) falls short of the triangle trend line, be warned that this line may not again be reached.
Stops may be money management stops or the Elliott wave invalidation point for subminuette wave (e) at 1,211.45. The risk to this wave count is that if it is wrong and the alternate is correct price may move substantially lower. It is up to each member to manage the risk to their account carefully. Conventional advice is to risk no more than 3-5% of your equity in any one trade.
This main wave count expects minute wave iv to find support at the pink trend line. It may end about the 0.236 Fibonacci ratio at 1,213.91. If it continues for a further one session, it may total a Fibonacci thirteen daily candlesticks.
ALTERNATE HOURLY WAVE COUNT
Click chart to enlarge.
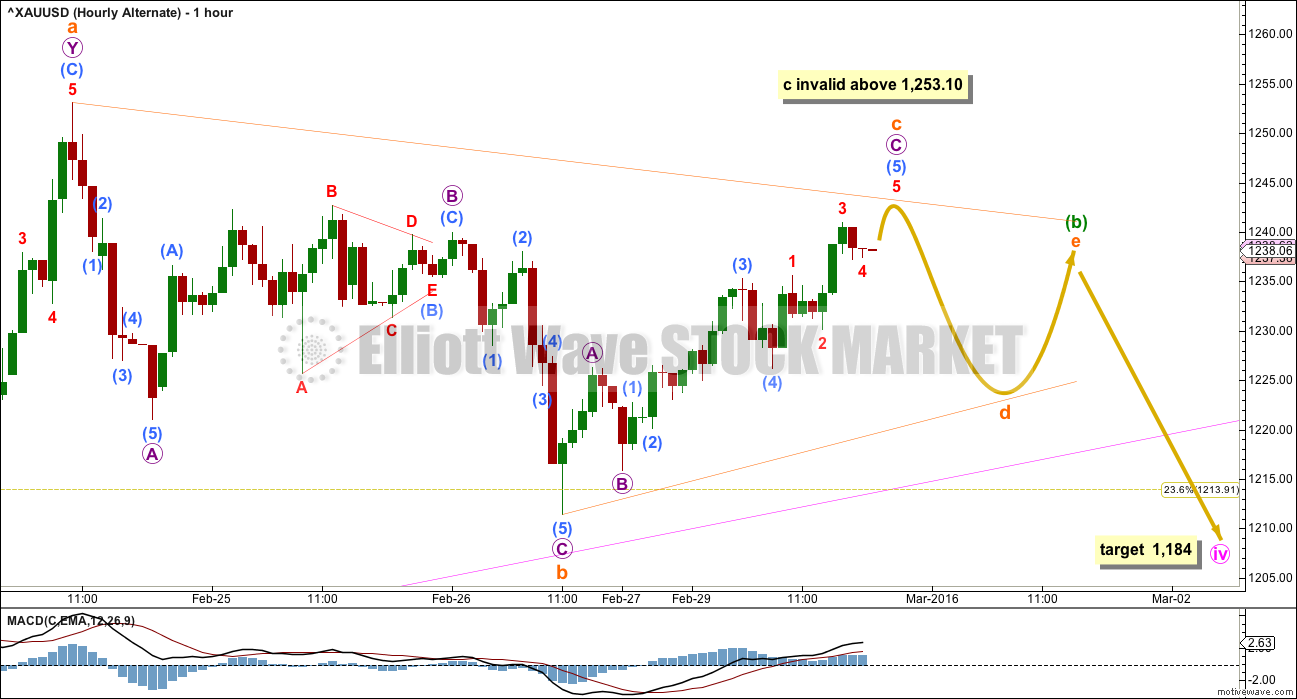
Minute wave iv may be continuing as a zigzag. This would offer no structural alternation with minute wave ii which was also a zigzag. For this reason, this must be an alternate wave count with a lower probability.
At this stage, if minute wave iv is continuing as a zigzag, then minuette wave (b) within it may be a triangle. This wave count no longer has the right look at the daily chart level. A single zigzag for minute wave iv should not have taken this long to unfold and it would be much longer in duration than the single zigzag for minute wave ii which lasted seven daily candlesticks. While a triangle could be expected to be longer lasting a zigzag should not be.
This wave count has a low probability, but alternates should always be considered for triangles. A new low below 1,211.45 would invalidate the main hourly wave count and confirm this alternate.
TECHNICAL ANALYSIS
Click chart to enlarge. Chart courtesy of StockCharts.com.
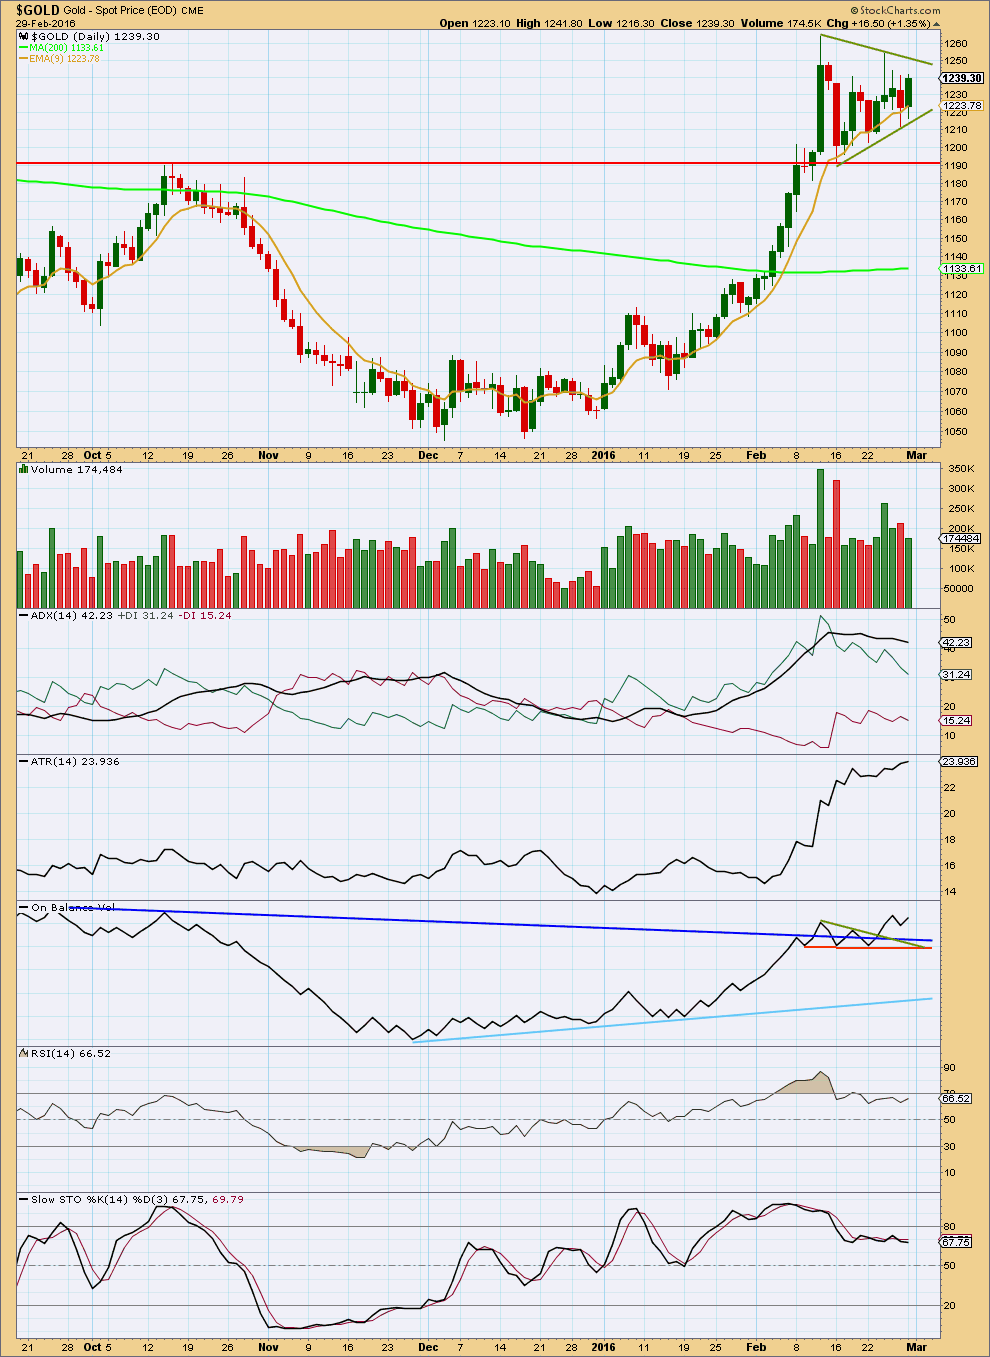
A triangle pattern looks to be forming. The trend lines are drawn across the top and bottom of the pattern. This is a fairly reliable continuation pattern. The breakout should be up. If price breaks above the upper green line on a day with an increase in volume, that would be a classic breakout from this pattern.
A decrease in volume now overall for the last few days again gives this consolidation a more typical look.
ADX is flat to declining indicating the market is correcting. ATR is now again increasing, so it now disagrees.
Apart from the outlier of 16th February, highest volume is for an upwards day. The 16th of February may include data for the holiday session of 15th February for which there is no daily candlestick in StockCharts data. If this candlestick for 16th February is ignored, then the breakout direction indicated by volume should be upwards.
If the volume for the daily candlestick of 16th February is taken into account. then the breakout direction indicated by volume should be downwards.
On Balance Volume may be providing an early indication. It has broken above all of its trend lines. OBV is often a reliable early indicator for price. This supports the Elliott wave count.
RSI is neutral. There is plenty of room for this market to rise or fall. Stochastics has returned from overbought.
This analysis is published @ 07:24 p.m. EST.
Gold price appears weak below pivot with 1224-20 holding and 1249-50 seen as limiting… Will be interesting to see which way Gold price goes; a pullback (short term decline) is expecting….
Lara, thank you for all your work, I really apreciate it! I have just 1 small question: is it not possible that subm. C of E is in fact subm. A of E and at aprox 1237 the B of C ended or is about to end, therefore we have a possibility tomorrow for seeing 1 final plunge to about 1217? If A=C that is… To me it looks more that way like minuete D ended in failed fifth at 1247.68 this past afternoon and the high during night at 1248.41 was in fact 3of5of D? If this prooves to be right and we start minor V of 3 at around 1217, maybe also we can shoot up more to 1300ish for end before m4 down starts? 🙂
I am really struggling to see your idea. A chart would be much easier.
Okay, I think I get it.
If minuette (d) ended in a truncation then it no longer fits as a zigzag.
E waves of triangles commonly fall short of the A-C trend line. If this one is done here it has a typical look and has lasted exactly a Fibonacci 13 days. That’s why I’ve entered a buy already.
Your idea is valid and possible. Which is why managing risk is so important in trading. And why the invalidation point must remain at 1,211.45. E could yet move lower.
E will be over when we see a new high above 1,248.44. If you want to wait for confirmation before entering a buy then wait for a new high above 1,248.44.
I understand, well I am basically gonna wait then and hoping I can load around 1217ish with a stop just at 1211ish for a ride up again. If not, i will load 1240+ indeed… I am more of a day trader then swing trader but this should be 1 consistent swing trade if it can go past m1 length! Thx alot for your answer, was not sure if my ideea was valid so I wanted your aprooval which I value alot! 🙂
I am feeling pretty lonely here, because all that I can see is the abyss that gold is about to plunge into. :). These are dreamy prices to short IMHO. Am looking for gold to drop a minimum $120 from these levels over the next couple months. Good luck all!
I’ll join you at 1,261 area minor wave 4 ski slope down this week.
I agree Matt, gold is overpriced on several levels. Gold:silver= overpriced Gold:commodities=overpriced Gold:U.S.Fundamentals= over exaggerated
Yellen “entertained” a “question” from congress regarding negative interest rates, she didn’t say neg. rates were required but media skewed her statement and blew things out of proportion. U.S. Numbers are coming in strong. COT is stretched… Weekly Stochastics is at a peak.. Macd is crossing over. volume is bearish on gold and GDX, and every article I read is bullish. Gold’s ripe for a Sizable drop. The chart that I posted yesterday may not rank high (technically), but it makes good sense…
I agreed with all of the above. I think it is funny how many analysts are openly admitting to purposely ignoring certain blatant bearish indicators to fit in their bullish picture.
I saw your charts. While I agree with the overall direction, I am using a different channel which connects the highs from Aug 28, 2013/ Mar 16, 2014 / Feb 11, 2016. My intermediate target low is 1107 by April or May.
Why seeing a new bull market requires a mindset change with the evidence and how silver’s recent under-performance need not be a worry.
http://seekingalpha.com/article/3940006-climbing-gold-wall-worry?auth_param=1cdi98:1bd8naa:a63192cfc67e7fac2d19d767a66a1642&uprof=45&dr=1#alt1
Guy who called gold’s bottom says it could jump 10% over next 9 months
Mar 1, 2016 3:01 p.m. ET
Q&A: State Street’s George Milling-Stanley says gold could hit $1,300-$1,350/oz. this year.
http://www.marketwatch.com/story/guy-who-called-golds-bottom-says-it-could-jump-10-over-next-9-months-2016-03-01
$1,261 target is the low of 1,227.27 today at 10:36 am + $34 in length for minute wave v = $1,261 target to sell miners before what may be an even bigger drop in minor wave 4.
I can see a count of 13 down for subminuette c of minuette (e) on the five minute chart. 13 is an impulsive number.
The clear three down may be complete at the last low.
I’ll be entering a buy with my stop just below 1,211.45.
Target 1,261.
Remember, I could be wrong. There is always an alternate wave count (even if I don’t publish one). No one can always be right. Manage risk carefully.
Actually no, that’s a terrible risk / reward ratio if I allow room for this market to move to the invalidation point.
I’m going to rethink where to place my stop, and if I don’t want to move it I may just place a rather small trade here.
I always use mental stops, unless I am sleeping, because the floor traders will sometimes run the market to take out published stops. But I went long at 1229 April futures and 1227 seem reasonable (now that we are at 1234. HOWEVER i wonder why we are only looking at 1261 target instead of higher ? Is this a short term target ,and would you use a trailing stop if we exceed 1261, Lara?
Yes, as it gets close I’ll see if the structure is complete. If it looks like it’s not I’ll use a trailing stop.
The target is for v to = i.
Because fifth waves out of fourth wave triangles can be surprisingly short.
Thank you Lara. “I must be doing something right- Singing to the music and Dancing with the light” From”Can U Get It” Nantucket Island MA, 1997. RECORDED IN Carly Simon’s barn on Martha’s Vineyard 1996.
Carly Simon = great music especially Reflections -greatest hits.
“this tendency for Gold to have surprisingly short fifth waves out of it’s fourth wave triangles”
After 1,261 target for minute v and minor 3 then down in minor 4.
“It will move into a correction.
Most likely to end within the price territory of this current fourth wave triangle, the fourth wave of one lesser degree.”
Would you care to comment on what price territory the 4th wave correction might end , before a fifth wave up to (1339)??
Lara didn’t give a price for minor wave 4 but look at the charts, “within the price territory of this current fourth wave triangle.”
By the way the 1,339 was target for minor wave 3 but Lara said it was too high and revised it to $34 up from bottom of minute wave iv and now that is changed to 1,261 for this minute v wave up which when it ends also ends minor wave 3. They both may end at 1,261.Then minor wave 4 down “correction lasting a week to three”.
I think that now there is a good risk/reward… Only 30 pips with stop at 1227, considering wave e finished
Agreed. That’s where I’ll put my stop.
Usually I prefer to give the market a bit more room to move. But if I do that here the risk / reward ratio is terrible.
Gold already tested twice today the 10:36 am today low of 1,227.27 and it held at 12:08 and 12:53 pm. I did buy some GDX at 1:00 pm 6 cents above the day low. Ready for the $37 minute wave v. I hope that Lara says that minute wave iv is already complete.
Any wave count on minuette wave (e) down to end minute iv?
Is gold now in the 4th wave of C wave down of A-B-C of minute (e) at 11:30 am or did the 5th wave already end at 1,227.27 at 10:36 am?
Hi Richard: Just wondering, really a break through 1225-1218 range is needed for deeper decline and whether gold price will be able to do that or not….
It doesn’t look like that will happen.
It also depends on where we are in the wave count on minuette (e) if we finished the 3 wave count down yet or not?
The gold low so far is 1227.27 at 10:36 am EST.
Break below 1211.45 would invalidate main hourly and go with alternate lower target of 1184, which looks unlikely so far.
Any wave count for the clear three down (A-B-C)from the top of minuette (d) at 1,248.65 at 9:16 pm EST Monday.
It appears that the A leg down ended at 1237.21 at 3:21 am
I appears the B leg up ended at 1247.95 at 8:09 am
Now in the C leg down and did the 3rd wave end at 1227.27 at 10:36 am EST?
Is gold now in the 4th wave of C wave down at 11:30 am or did the 5th wave already end?
I can see the structure of minuette (d) now complete as a zigzag.
Draw a trend line from the start of minuette (d) to subminuette b within it. See that price is finding support at that line. When that line is breached then expect minuette (e) downwards should be underway.
Look then for a clear three down to fall short of the (a)-(c) trend line.
IF my wave count for the triangle is correct and IF Gold follows a typical behaviour then a short term long side trade may net over $30 there.
Stops may be set just below 1,211.45. That would be the risk to a buy trade on Gold when (e) is finished.
There are three ways to take profit on this potential trade to the upside:
1. Set a target about $37 from the end of the triangle.
2. Once some upwards movement out of the triangle is clear then draw a trend line along the lower edge. As soon as that line is clearly breached then the trade may be closed.
3. A trailing stop.
The risk of missing profits: what if this tendency for Gold to have surprisingly short fifth waves out of it’s fourth wave triangles is overwhelmed by Gold’s tendency to have swift strong and long fifth waves to end it’s third wave impulses? This next move up is minute wave v to end minor 3 after all.
It is my judgement based on years of experience analysing this market that the tendency for a short fifth wave following a triangle may be stronger than the tendency for a fifth wave of a third to be long and strong.
As always, it is up to each member to manage risk to your account carefully. Take responsibility for your own trades. Don’t invest more than 3-5% of your equity on any one trade.
And for new members, if you have not read the terms of service please do so.
And a full disclosure from me on this one today:
Gold may finish it’s E wave of the triangle probably while I sleep. Because I can’t tell what price point that may be I’m not comfortable setting an order to open a buy without judging price movement at that time.
I may get up very early to try to catch the end, but if I miss it and price rockets up when I awake then I’m going to have to leave this one alone.
My equity is currently mostly tied up with an underwater position on S&P but I have confidence enough in my wave count there to hold on for now. So I’ll not lose any sleep over missing a short term trade on Gold. Literally.
Good luck everybody!
Thanks Lara for sharing your thoughts.
After minor 3 is complete will gold go down in a deep correction for minor 4???
It will move into a correction.
Most likely to end within the price territory of this current fourth wave triangle, the fourth wave of one lesser degree.
Lara:” This gives a target for minuette wave (d) to end about 1,245 – 1,247.” ……” It may end about the 0.236 Fibonacci ratio at 1,213.91. If it continues for a further one session, it may total a Fibonacci thirteen daily candlesticks.”
Gold is already trading at 1247. Next tomorrow will be wave e down to 1213.91????
Papudi the analysis has the main hourly which you mention and also has the hourly alternate wave down, minuette wave (b) which is still valid and has a different target for minute wave iv to end.
I hope the GDX will bust through the weekly downtrend channel that’s been in place since June 2013 . Today it’s touching the top of this channel on the weekly. An extra $34 to gold will definitely help GDX and HUI break out of this channel on the weekly. Also if gold makes $1260+ (or 20% from the low) on the daily other mainstream analysts (like Bespoke…the best mainstream newsletter) will have no choice but to officially call this a bull market not just Elliot Wave. So far, only Elliot Wave is calling this a bull market, I can’t wait for other systems to join in. Monetary-Metal is saying this may be a “stealth bull market”.
I’ve been waiting for nearly 5 years now to get back into gold in a big way like the good old days. I can’t wait any longer!
https://monetary-metals.com/gold-silver-ratio-breakout-report-28-feb-2016/
Some EW analysts are not calling this a bull market yet and still expecting a new low. They are fixated on bear outlook and waiting for a full 5 wave up then down without a new low before calling this a bull market (intermediate waves (1) and (2) would need to complete before their expectations make a major change for gold.. Some EW analysts didn’t consider the various levels of confirmation this bull market has already confirmed. They look at it as all of nothing bull and now it’s still a bear because it’s not 100% confirmed, which they violate EW practices to say that as EW is only probabilities I think Lara is still ahead of the crowd in calling that the bear market has changed to a gold bull market. The bottom of intermediate wave (2) will be another great buying time for the gold bull believers as even then many may be bearish which will keep prices low for miners..
Thomas, the busting through the weekly channel may be delayed. If I’m correct I think Lara may have commented since Friday that once minor wave 3 is over there may be a 1 to 3 week correction down?
“Lara February 27, 2016 at 9:44 pm
Slight.
If this fourth wave is a triangle as it so far looks like, then the following fifth wave upwards breakout may be very quick and surprisingly short. It could be over in just one or two days and only about $38 in total length.
And then Gold may move into another deeper more long lasting correction for minor 4.
That could fit with the bearish COT nicely.
The high may not be quite yet in, but another correction lasting a week to three may resolve the bearish mood.”
Reply
Thank you. This fits nicely with the annual ritual of pumping into the PDAC and the dumping 1-3 weeks afterward.